Cities with the Most Immigrants from South America in New Mexico
RELATED REPORTS & OPTIONS
South America
New Mexico
Compare Cities
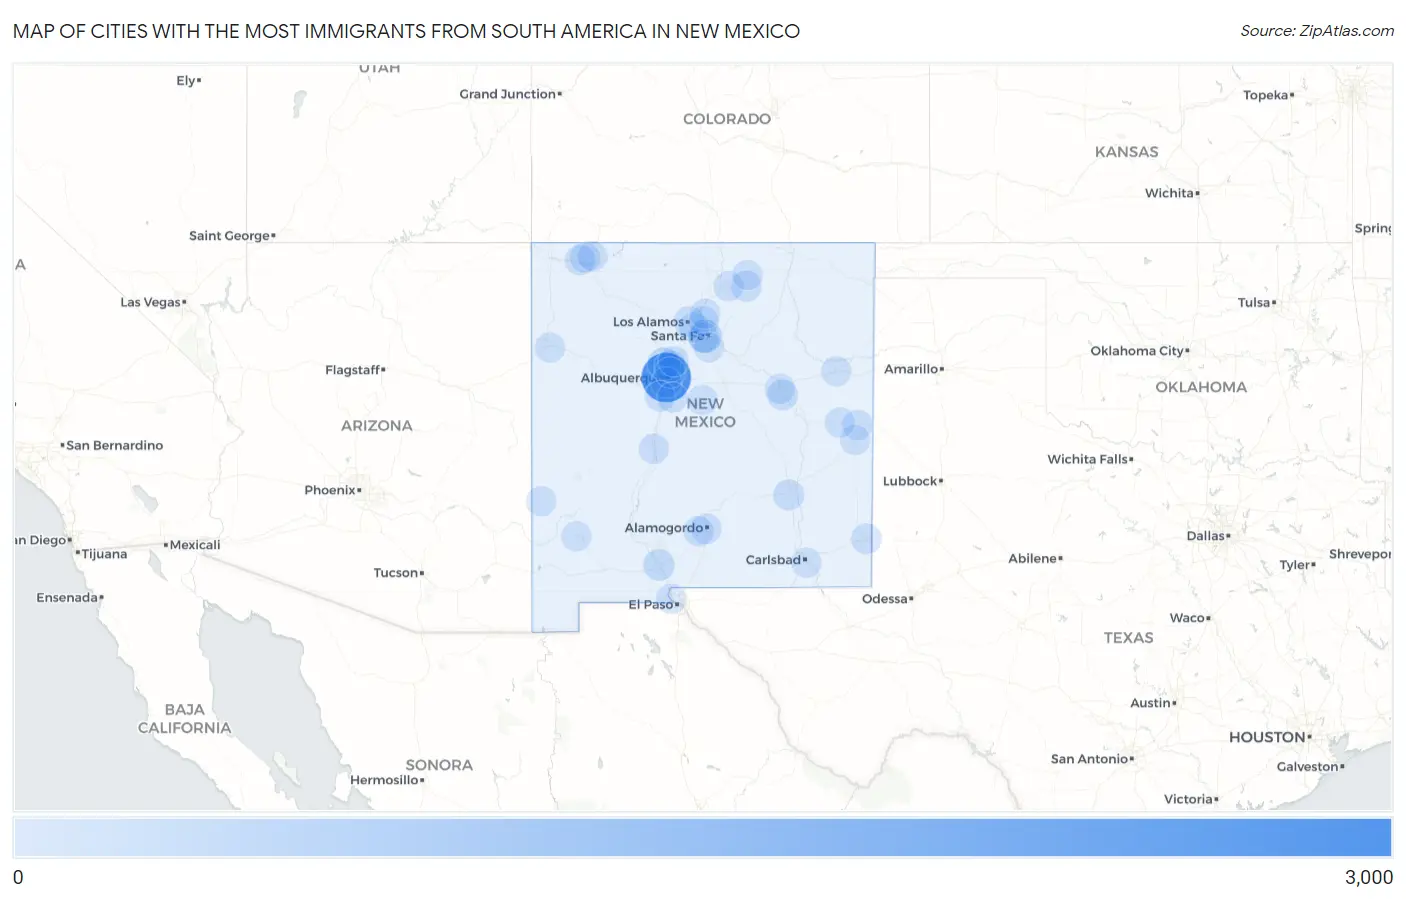
Map of Cities with the Most Immigrants from South America in New Mexico
0
3,000
Cities with the Most Immigrants from South America in New Mexico
| City | South America | vs State | vs National | |
| 1. | Albuquerque | 2,754 | 5,242(52.54%)#1 | 3,636,375(0.08%)#166 |
| 2. | Santa Fe | 462 | 5,242(8.81%)#2 | 3,636,375(0.01%)#965 |
| 3. | Rio Rancho | 312 | 5,242(5.95%)#3 | 3,636,375(0.01%)#1,308 |
| 4. | Espanola | 170 | 5,242(3.24%)#4 | 3,636,375(0.00%)#1,938 |
| 5. | Las Cruces | 168 | 5,242(3.20%)#5 | 3,636,375(0.00%)#1,949 |
| 6. | Corrales | 121 | 5,242(2.31%)#6 | 3,636,375(0.00%)#2,374 |
| 7. | Roswell | 105 | 5,242(2.00%)#7 | 3,636,375(0.00%)#2,559 |
| 8. | Angel Fire | 90 | 5,242(1.72%)#8 | 3,636,375(0.00%)#2,780 |
| 9. | Puerto De Luna | 70 | 5,242(1.34%)#9 | 3,636,375(0.00%)#3,145 |
| 10. | Hobbs | 55 | 5,242(1.05%)#10 | 3,636,375(0.00%)#3,516 |
| 11. | Farmington | 51 | 5,242(0.97%)#11 | 3,636,375(0.00%)#3,651 |
| 12. | Los Alamos | 50 | 5,242(0.95%)#12 | 3,636,375(0.00%)#3,693 |
| 13. | Alamogordo | 48 | 5,242(0.92%)#13 | 3,636,375(0.00%)#3,763 |
| 14. | Socorro | 40 | 5,242(0.76%)#14 | 3,636,375(0.00%)#4,068 |
| 15. | South Valley | 38 | 5,242(0.72%)#15 | 3,636,375(0.00%)#4,133 |
| 16. | Cannon Afb | 36 | 5,242(0.69%)#16 | 3,636,375(0.00%)#4,260 |
| 17. | Los Lunas | 33 | 5,242(0.63%)#17 | 3,636,375(0.00%)#4,368 |
| 18. | Estancia | 32 | 5,242(0.61%)#18 | 3,636,375(0.00%)#4,473 |
| 19. | Flora Vista | 29 | 5,242(0.55%)#19 | 3,636,375(0.00%)#4,634 |
| 20. | North Valley | 27 | 5,242(0.52%)#20 | 3,636,375(0.00%)#4,736 |
| 21. | Bernalillo | 27 | 5,242(0.52%)#21 | 3,636,375(0.00%)#4,743 |
| 22. | Meadow Lake | 26 | 5,242(0.50%)#22 | 3,636,375(0.00%)#4,822 |
| 23. | Holloman Afb | 26 | 5,242(0.50%)#23 | 3,636,375(0.00%)#4,826 |
| 24. | Agua Fria | 26 | 5,242(0.50%)#24 | 3,636,375(0.00%)#4,835 |
| 25. | White Rock | 22 | 5,242(0.42%)#25 | 3,636,375(0.00%)#5,095 |
| 26. | Tano Road | 22 | 5,242(0.42%)#26 | 3,636,375(0.00%)#5,124 |
| 27. | La Puebla | 22 | 5,242(0.42%)#27 | 3,636,375(0.00%)#5,133 |
| 28. | Carlsbad | 21 | 5,242(0.40%)#28 | 3,636,375(0.00%)#5,145 |
| 29. | Santa Rosa | 20 | 5,242(0.38%)#29 | 3,636,375(0.00%)#5,253 |
| 30. | Pleasanton | 14 | 5,242(0.27%)#30 | 3,636,375(0.00%)#5,838 |
| 31. | Silver City | 12 | 5,242(0.23%)#31 | 3,636,375(0.00%)#5,965 |
| 32. | Sunland Park | 11 | 5,242(0.21%)#32 | 3,636,375(0.00%)#6,089 |
| 33. | Gallup | 10 | 5,242(0.19%)#33 | 3,636,375(0.00%)#6,204 |
| 34. | Placitas Cdp Sandoval County | 9 | 5,242(0.17%)#34 | 3,636,375(0.00%)#6,434 |
| 35. | Portales | 7 | 5,242(0.13%)#35 | 3,636,375(0.00%)#6,681 |
| 36. | Aztec | 6 | 5,242(0.11%)#36 | 3,636,375(0.00%)#6,866 |
| 37. | Eldorado At Santa Fe | 6 | 5,242(0.11%)#37 | 3,636,375(0.00%)#6,871 |
| 38. | Taos | 5 | 5,242(0.10%)#38 | 3,636,375(0.00%)#7,029 |
| 39. | Tucumcari | 5 | 5,242(0.10%)#39 | 3,636,375(0.00%)#7,033 |
| 40. | Eagle Nest | 4 | 5,242(0.08%)#40 | 3,636,375(0.00%)#7,396 |
| 41. | Pojoaque | 2 | 5,242(0.04%)#41 | 3,636,375(0.00%)#7,655 |
| 42. | Melrose | 2 | 5,242(0.04%)#42 | 3,636,375(0.00%)#7,767 |
Common Questions
What are the Top 10 Cities with the Most Immigrants from South America in New Mexico?
Top 10 Cities with the Most Immigrants from South America in New Mexico are:
#1
2,754
#2
462
#3
312
#4
168
#5
121
#6
105
#7
90
#8
70
#9
55
#10
51
What city has the Most Immigrants from South America in New Mexico?
Albuquerque has the Most Immigrants from South America in New Mexico with 2,754.
What is the Total Immigrants from South America in the State of New Mexico?
Total Immigrants from South America in New Mexico is 5,242.
What is the Total Immigrants from South America in the United States?
Total Immigrants from South America in the United States is 3,636,375.