Cities with the Most Immigrants from South America in Iowa
RELATED REPORTS & OPTIONS
South America
Iowa
Compare Cities
Map of Cities with the Most Immigrants from South America in Iowa
0
600
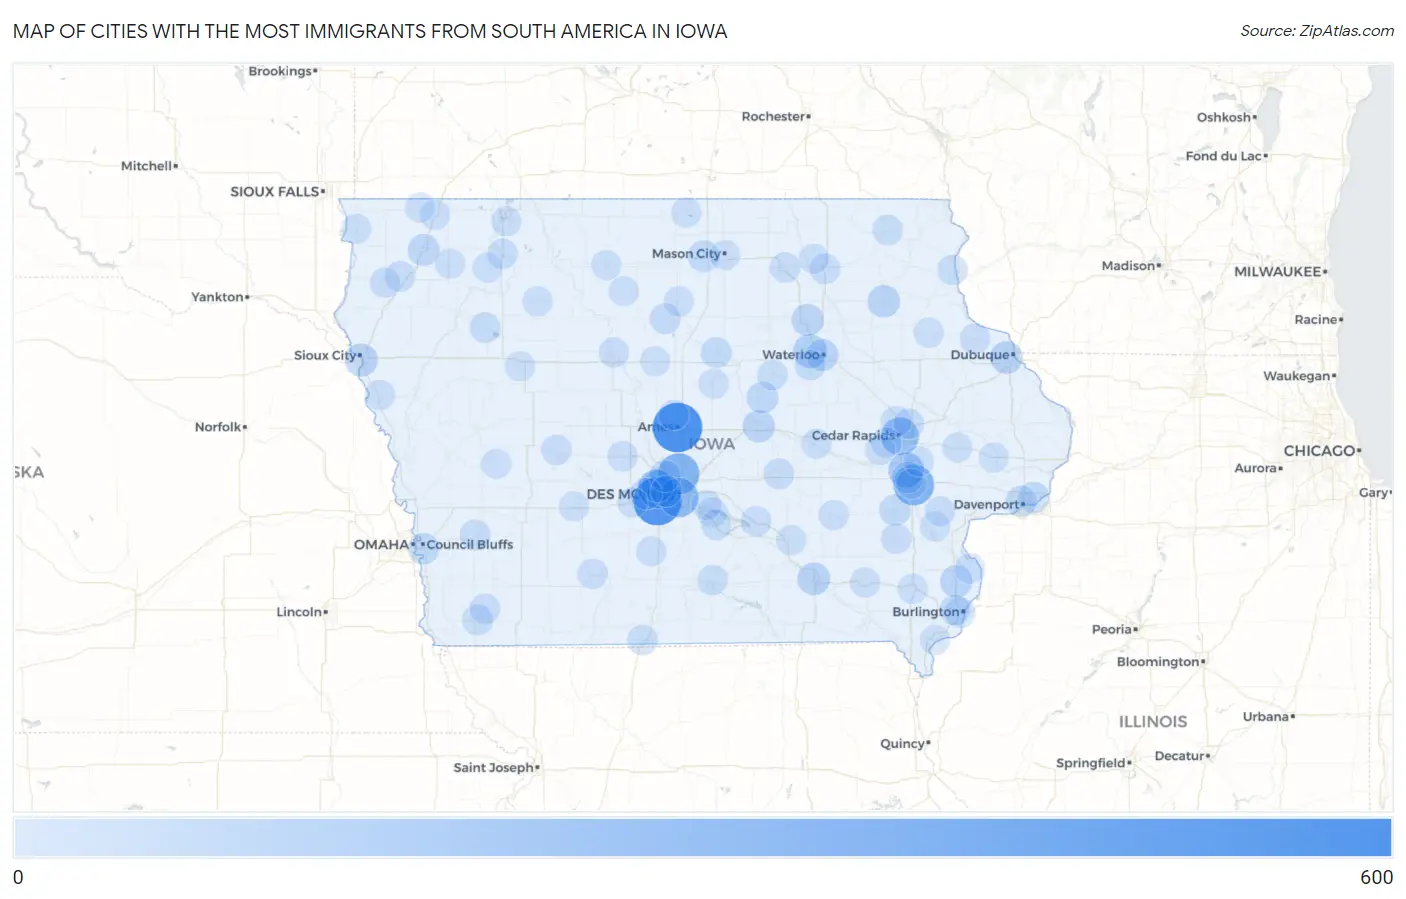
Cities with the Most Immigrants from South America in Iowa
| City | South America | vs State | vs National | |
| 1. | Ames | 599 | 4,688(12.78%)#1 | 3,636,375(0.02%)#795 |
| 2. | West Des Moines | 556 | 4,688(11.86%)#2 | 3,636,375(0.02%)#829 |
| 3. | Ankeny | 332 | 4,688(7.08%)#3 | 3,636,375(0.01%)#1,250 |
| 4. | Iowa City | 322 | 4,688(6.87%)#4 | 3,636,375(0.01%)#1,284 |
| 5. | Clive | 275 | 4,688(5.87%)#5 | 3,636,375(0.01%)#1,434 |
| 6. | Des Moines | 274 | 4,688(5.84%)#6 | 3,636,375(0.01%)#1,438 |
| 7. | Cedar Rapids | 228 | 4,688(4.86%)#7 | 3,636,375(0.01%)#1,622 |
| 8. | North Liberty | 163 | 4,688(3.48%)#8 | 3,636,375(0.00%)#1,995 |
| 9. | Cedar Falls | 114 | 4,688(2.43%)#9 | 3,636,375(0.00%)#2,433 |
| 10. | Sioux City | 84 | 4,688(1.79%)#10 | 3,636,375(0.00%)#2,859 |
| 11. | Dubuque | 77 | 4,688(1.64%)#11 | 3,636,375(0.00%)#2,965 |
| 12. | Ottumwa | 77 | 4,688(1.64%)#12 | 3,636,375(0.00%)#2,966 |
| 13. | Fayette | 71 | 4,688(1.51%)#13 | 3,636,375(0.00%)#3,127 |
| 14. | Mediapolis | 67 | 4,688(1.43%)#14 | 3,636,375(0.00%)#3,225 |
| 15. | Marshalltown | 62 | 4,688(1.32%)#15 | 3,636,375(0.00%)#3,327 |
| 16. | Waverly | 58 | 4,688(1.24%)#16 | 3,636,375(0.00%)#3,444 |
| 17. | Waterloo | 56 | 4,688(1.19%)#17 | 3,636,375(0.00%)#3,481 |
| 18. | Urbandale | 54 | 4,688(1.15%)#18 | 3,636,375(0.00%)#3,547 |
| 19. | Sheldon | 50 | 4,688(1.07%)#19 | 3,636,375(0.00%)#3,709 |
| 20. | Waukee | 47 | 4,688(1.00%)#20 | 3,636,375(0.00%)#3,790 |
| 21. | Conrad | 45 | 4,688(0.96%)#21 | 3,636,375(0.00%)#3,896 |
| 22. | Johnston | 44 | 4,688(0.94%)#22 | 3,636,375(0.00%)#3,904 |
| 23. | Clear Lake | 42 | 4,688(0.90%)#23 | 3,636,375(0.00%)#3,994 |
| 24. | Council Bluffs | 40 | 4,688(0.85%)#24 | 3,636,375(0.00%)#4,043 |
| 25. | Bettendorf | 40 | 4,688(0.85%)#25 | 3,636,375(0.00%)#4,045 |
| 26. | Coralville | 40 | 4,688(0.85%)#26 | 3,636,375(0.00%)#4,049 |
| 27. | Windsor Heights | 38 | 4,688(0.81%)#27 | 3,636,375(0.00%)#4,153 |
| 28. | Kalona | 36 | 4,688(0.77%)#28 | 3,636,375(0.00%)#4,262 |
| 29. | Davenport | 29 | 4,688(0.62%)#29 | 3,636,375(0.00%)#4,586 |
| 30. | Iowa Falls | 26 | 4,688(0.55%)#30 | 3,636,375(0.00%)#4,820 |
| 31. | Clarion | 24 | 4,688(0.51%)#31 | 3,636,375(0.00%)#4,963 |
| 32. | Shenandoah | 23 | 4,688(0.49%)#32 | 3,636,375(0.00%)#5,033 |
| 33. | Alta | 22 | 4,688(0.47%)#33 | 3,636,375(0.00%)#5,113 |
| 34. | Oakland | 20 | 4,688(0.43%)#34 | 3,636,375(0.00%)#5,266 |
| 35. | Burlington | 19 | 4,688(0.41%)#35 | 3,636,375(0.00%)#5,284 |
| 36. | Hiawatha | 19 | 4,688(0.41%)#36 | 3,636,375(0.00%)#5,312 |
| 37. | Grinnell | 18 | 4,688(0.38%)#37 | 3,636,375(0.00%)#5,390 |
| 38. | West Burlington | 18 | 4,688(0.38%)#38 | 3,636,375(0.00%)#5,416 |
| 39. | Hudson | 15 | 4,688(0.32%)#39 | 3,636,375(0.00%)#5,693 |
| 40. | Marion | 14 | 4,688(0.30%)#40 | 3,636,375(0.00%)#5,736 |
| 41. | Charles City | 14 | 4,688(0.30%)#41 | 3,636,375(0.00%)#5,762 |
| 42. | Orange City | 14 | 4,688(0.30%)#42 | 3,636,375(0.00%)#5,769 |
| 43. | New Hampton | 13 | 4,688(0.28%)#43 | 3,636,375(0.00%)#5,895 |
| 44. | Essex | 13 | 4,688(0.28%)#44 | 3,636,375(0.00%)#5,923 |
| 45. | Perry | 12 | 4,688(0.26%)#45 | 3,636,375(0.00%)#5,971 |
| 46. | Washington | 12 | 4,688(0.26%)#46 | 3,636,375(0.00%)#5,974 |
| 47. | Decorah | 11 | 4,688(0.23%)#47 | 3,636,375(0.00%)#6,109 |
| 48. | Lamoni | 11 | 4,688(0.23%)#48 | 3,636,375(0.00%)#6,153 |
| 49. | Holy Cross | 11 | 4,688(0.23%)#49 | 3,636,375(0.00%)#6,191 |
| 50. | Chariton | 10 | 4,688(0.21%)#50 | 3,636,375(0.00%)#6,265 |
| 51. | Fairfax | 10 | 4,688(0.21%)#51 | 3,636,375(0.00%)#6,290 |
| 52. | Creston | 9 | 4,688(0.19%)#52 | 3,636,375(0.00%)#6,406 |
| 53. | Pella | 8 | 4,688(0.17%)#53 | 3,636,375(0.00%)#6,524 |
| 54. | Coon Rapids | 8 | 4,688(0.17%)#54 | 3,636,375(0.00%)#6,612 |
| 55. | Gilbert | 8 | 4,688(0.17%)#55 | 3,636,375(0.00%)#6,621 |
| 56. | Fort Dodge | 7 | 4,688(0.15%)#56 | 3,636,375(0.00%)#6,662 |
| 57. | Spencer | 7 | 4,688(0.15%)#57 | 3,636,375(0.00%)#6,684 |
| 58. | Grundy Center | 7 | 4,688(0.15%)#58 | 3,636,375(0.00%)#6,737 |
| 59. | De Soto | 7 | 4,688(0.15%)#59 | 3,636,375(0.00%)#6,797 |
| 60. | Marquette | 7 | 4,688(0.15%)#60 | 3,636,375(0.00%)#6,817 |
| 61. | Maurice | 7 | 4,688(0.15%)#61 | 3,636,375(0.00%)#6,823 |
| 62. | Pleasantville | 6 | 4,688(0.13%)#62 | 3,636,375(0.00%)#6,929 |
| 63. | Fort Madison | 5 | 4,688(0.11%)#63 | 3,636,375(0.00%)#7,017 |
| 64. | Fairfield | 5 | 4,688(0.11%)#64 | 3,636,375(0.00%)#7,020 |
| 65. | Webster City | 5 | 4,688(0.11%)#65 | 3,636,375(0.00%)#7,023 |
| 66. | Belmond | 5 | 4,688(0.11%)#66 | 3,636,375(0.00%)#7,068 |
| 67. | Lake Mills | 5 | 4,688(0.11%)#67 | 3,636,375(0.00%)#7,087 |
| 68. | Laurens | 5 | 4,688(0.11%)#68 | 3,636,375(0.00%)#7,122 |
| 69. | Sloan | 5 | 4,688(0.11%)#69 | 3,636,375(0.00%)#7,131 |
| 70. | Hubbard | 5 | 4,688(0.11%)#70 | 3,636,375(0.00%)#7,141 |
| 71. | Edgewood | 5 | 4,688(0.11%)#71 | 3,636,375(0.00%)#7,150 |
| 72. | Truro | 5 | 4,688(0.11%)#72 | 3,636,375(0.00%)#7,155 |
| 73. | Mason City | 4 | 4,688(0.09%)#73 | 3,636,375(0.00%)#7,178 |
| 74. | Sibley | 4 | 4,688(0.09%)#74 | 3,636,375(0.00%)#7,235 |
| 75. | Sac City | 4 | 4,688(0.09%)#75 | 3,636,375(0.00%)#7,284 |
| 76. | Wheatland | 4 | 4,688(0.09%)#76 | 3,636,375(0.00%)#7,342 |
| 77. | University Park | 4 | 4,688(0.09%)#77 | 3,636,375(0.00%)#7,369 |
| 78. | Conesville | 4 | 4,688(0.09%)#78 | 3,636,375(0.00%)#7,381 |
| 79. | Walford | 3 | 4,688(0.06%)#79 | 3,636,375(0.00%)#7,487 |
| 80. | Arnolds Park | 3 | 4,688(0.06%)#80 | 3,636,375(0.00%)#7,525 |
| 81. | Primghar | 3 | 4,688(0.06%)#81 | 3,636,375(0.00%)#7,535 |
| 82. | Casey | 3 | 4,688(0.06%)#82 | 3,636,375(0.00%)#7,584 |
| 83. | Nichols | 3 | 4,688(0.06%)#83 | 3,636,375(0.00%)#7,587 |
| 84. | Swan | 3 | 4,688(0.06%)#84 | 3,636,375(0.00%)#7,609 |
| 85. | Solon | 2 | 4,688(0.04%)#85 | 3,636,375(0.00%)#7,645 |
| 86. | University Heights | 2 | 4,688(0.04%)#86 | 3,636,375(0.00%)#7,685 |
| 87. | Inwood | 2 | 4,688(0.04%)#87 | 3,636,375(0.00%)#7,720 |
| 88. | Little Rock | 2 | 4,688(0.04%)#88 | 3,636,375(0.00%)#7,775 |
| 89. | Runnells | 2 | 4,688(0.04%)#89 | 3,636,375(0.00%)#7,781 |
| 90. | Chelsea | 2 | 4,688(0.04%)#90 | 3,636,375(0.00%)#7,801 |
| 91. | Keswick | 2 | 4,688(0.04%)#91 | 3,636,375(0.00%)#7,810 |
| 92. | North Washington | 2 | 4,688(0.04%)#92 | 3,636,375(0.00%)#7,834 |
| 93. | Mount Pleasant | 1 | 4,688(0.02%)#93 | 3,636,375(0.00%)#7,860 |
| 94. | Algona | 1 | 4,688(0.02%)#94 | 3,636,375(0.00%)#7,866 |
| 95. | Stanwood | 1 | 4,688(0.02%)#95 | 3,636,375(0.00%)#7,937 |
| 96. | Royal | 1 | 4,688(0.02%)#96 | 3,636,375(0.00%)#7,943 |
| 97. | Irwin | 1 | 4,688(0.02%)#97 | 3,636,375(0.00%)#7,971 |
| 98. | Lu Verne | 1 | 4,688(0.02%)#98 | 3,636,375(0.00%)#7,978 |
| 99. | Oakville | 1 | 4,688(0.02%)#99 | 3,636,375(0.00%)#7,996 |
Common Questions
What are the Top 10 Cities with the Most Immigrants from South America in Iowa?
Top 10 Cities with the Most Immigrants from South America in Iowa are:
#1
599
#2
556
#3
332
#4
322
#5
275
#6
274
#7
228
#8
163
#9
114
#10
84
What city has the Most Immigrants from South America in Iowa?
Ames has the Most Immigrants from South America in Iowa with 599.
What is the Total Immigrants from South America in the State of Iowa?
Total Immigrants from South America in Iowa is 4,688.
What is the Total Immigrants from South America in the United States?
Total Immigrants from South America in the United States is 3,636,375.