Cities with the Most Immigrants from South America in Colorado
RELATED REPORTS & OPTIONS
South America
Colorado
Compare Cities
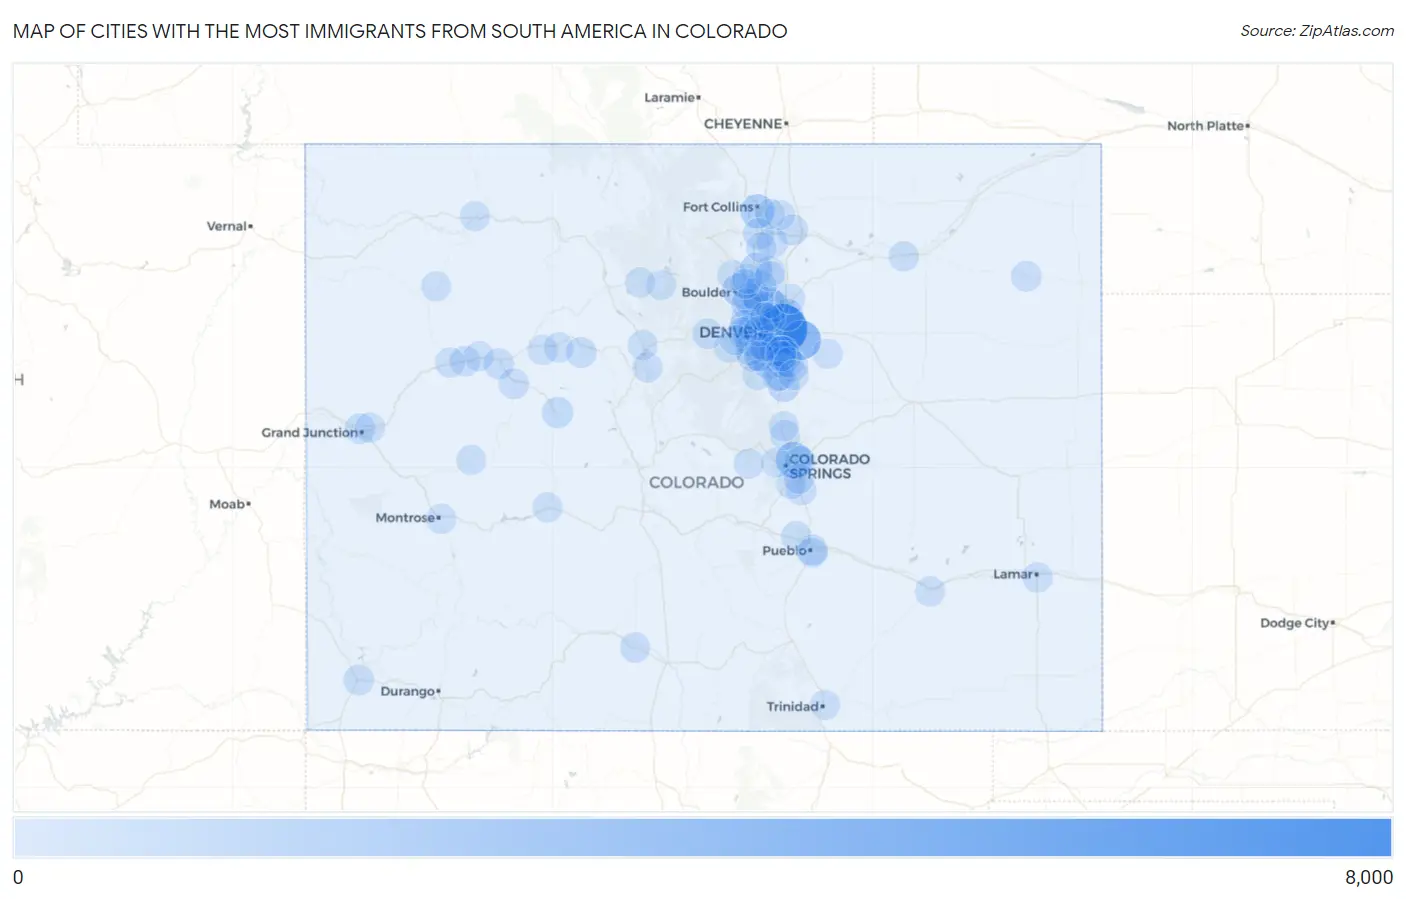
Map of Cities with the Most Immigrants from South America in Colorado
0
8,000
Cities with the Most Immigrants from South America in Colorado
| City | South America | vs State | vs National | |
| 1. | Denver | 6,203 | 29,325(21.15%)#1 | 3,636,375(0.17%)#68 |
| 2. | Aurora | 2,854 | 29,325(9.73%)#2 | 3,636,375(0.08%)#159 |
| 3. | Colorado Springs | 1,818 | 29,325(6.20%)#3 | 3,636,375(0.05%)#267 |
| 4. | Fort Collins | 1,203 | 29,325(4.10%)#4 | 3,636,375(0.03%)#401 |
| 5. | Thornton | 928 | 29,325(3.16%)#5 | 3,636,375(0.03%)#520 |
| 6. | Centennial | 866 | 29,325(2.95%)#6 | 3,636,375(0.02%)#560 |
| 7. | Boulder | 858 | 29,325(2.93%)#7 | 3,636,375(0.02%)#563 |
| 8. | Lakewood | 713 | 29,325(2.43%)#8 | 3,636,375(0.02%)#678 |
| 9. | Westminster | 711 | 29,325(2.42%)#9 | 3,636,375(0.02%)#679 |
| 10. | Longmont | 650 | 29,325(2.22%)#10 | 3,636,375(0.02%)#741 |
| 11. | Highlands Ranch | 569 | 29,325(1.94%)#11 | 3,636,375(0.02%)#822 |
| 12. | Commerce City | 534 | 29,325(1.82%)#12 | 3,636,375(0.01%)#852 |
| 13. | Castle Rock | 508 | 29,325(1.73%)#13 | 3,636,375(0.01%)#892 |
| 14. | Northglenn | 441 | 29,325(1.50%)#14 | 3,636,375(0.01%)#998 |
| 15. | Four Square Mile | 355 | 29,325(1.21%)#15 | 3,636,375(0.01%)#1,185 |
| 16. | Aspen | 331 | 29,325(1.13%)#16 | 3,636,375(0.01%)#1,262 |
| 17. | Loveland | 308 | 29,325(1.05%)#17 | 3,636,375(0.01%)#1,319 |
| 18. | Cimarron Hills | 286 | 29,325(0.98%)#18 | 3,636,375(0.01%)#1,389 |
| 19. | Parker | 280 | 29,325(0.95%)#19 | 3,636,375(0.01%)#1,411 |
| 20. | Arvada | 258 | 29,325(0.88%)#20 | 3,636,375(0.01%)#1,489 |
| 21. | Pueblo | 252 | 29,325(0.86%)#21 | 3,636,375(0.01%)#1,518 |
| 22. | Louisville | 227 | 29,325(0.77%)#22 | 3,636,375(0.01%)#1,631 |
| 23. | Greeley | 219 | 29,325(0.75%)#23 | 3,636,375(0.01%)#1,672 |
| 24. | Littleton | 204 | 29,325(0.70%)#24 | 3,636,375(0.01%)#1,742 |
| 25. | Glenwood Springs | 204 | 29,325(0.70%)#25 | 3,636,375(0.01%)#1,745 |
| 26. | Englewood | 202 | 29,325(0.69%)#26 | 3,636,375(0.01%)#1,753 |
| 27. | Edwards | 201 | 29,325(0.69%)#27 | 3,636,375(0.01%)#1,762 |
| 28. | Broomfield | 191 | 29,325(0.65%)#28 | 3,636,375(0.01%)#1,814 |
| 29. | Erie | 189 | 29,325(0.64%)#29 | 3,636,375(0.01%)#1,824 |
| 30. | Castle Pines | 182 | 29,325(0.62%)#30 | 3,636,375(0.01%)#1,864 |
| 31. | Dove Valley | 164 | 29,325(0.56%)#31 | 3,636,375(0.00%)#1,992 |
| 32. | Ken Caryl | 161 | 29,325(0.55%)#32 | 3,636,375(0.00%)#2,007 |
| 33. | Cortez | 161 | 29,325(0.55%)#33 | 3,636,375(0.00%)#2,011 |
| 34. | Grand Junction | 156 | 29,325(0.53%)#34 | 3,636,375(0.00%)#2,040 |
| 35. | Johnstown | 152 | 29,325(0.52%)#35 | 3,636,375(0.00%)#2,066 |
| 36. | Fountain | 149 | 29,325(0.51%)#36 | 3,636,375(0.00%)#2,080 |
| 37. | Lafayette | 144 | 29,325(0.49%)#37 | 3,636,375(0.00%)#2,131 |
| 38. | Yuma | 128 | 29,325(0.44%)#38 | 3,636,375(0.00%)#2,293 |
| 39. | Superior | 125 | 29,325(0.43%)#39 | 3,636,375(0.00%)#2,333 |
| 40. | Dakota Ridge | 122 | 29,325(0.42%)#40 | 3,636,375(0.00%)#2,358 |
| 41. | Greenwood Village | 113 | 29,325(0.39%)#41 | 3,636,375(0.00%)#2,452 |
| 42. | Lone Tree | 113 | 29,325(0.39%)#42 | 3,636,375(0.00%)#2,455 |
| 43. | Carbondale | 113 | 29,325(0.39%)#43 | 3,636,375(0.00%)#2,465 |
| 44. | Silt | 94 | 29,325(0.32%)#44 | 3,636,375(0.00%)#2,715 |
| 45. | Lamar | 86 | 29,325(0.29%)#45 | 3,636,375(0.00%)#2,834 |
| 46. | Cherry Creek | 81 | 29,325(0.28%)#46 | 3,636,375(0.00%)#2,913 |
| 47. | Monte Vista | 81 | 29,325(0.28%)#47 | 3,636,375(0.00%)#2,920 |
| 48. | Pueblo West | 76 | 29,325(0.26%)#48 | 3,636,375(0.00%)#2,985 |
| 49. | Fort Carson | 75 | 29,325(0.26%)#49 | 3,636,375(0.00%)#3,015 |
| 50. | Castle Pines Village | 71 | 29,325(0.24%)#50 | 3,636,375(0.00%)#3,121 |
| 51. | Fort Morgan | 70 | 29,325(0.24%)#51 | 3,636,375(0.00%)#3,136 |
| 52. | Wheat Ridge | 69 | 29,325(0.24%)#52 | 3,636,375(0.00%)#3,152 |
| 53. | Security Widefield | 67 | 29,325(0.23%)#53 | 3,636,375(0.00%)#3,202 |
| 54. | Applewood | 66 | 29,325(0.23%)#54 | 3,636,375(0.00%)#3,243 |
| 55. | Welby | 60 | 29,325(0.20%)#55 | 3,636,375(0.00%)#3,378 |
| 56. | Breckenridge | 58 | 29,325(0.20%)#56 | 3,636,375(0.00%)#3,452 |
| 57. | Park Center | 58 | 29,325(0.20%)#57 | 3,636,375(0.00%)#3,458 |
| 58. | Idaho Springs | 53 | 29,325(0.18%)#58 | 3,636,375(0.00%)#3,610 |
| 59. | Stonegate | 51 | 29,325(0.17%)#59 | 3,636,375(0.00%)#3,663 |
| 60. | La Junta | 50 | 29,325(0.17%)#60 | 3,636,375(0.00%)#3,702 |
| 61. | Meeker | 50 | 29,325(0.17%)#61 | 3,636,375(0.00%)#3,717 |
| 62. | Inverness | 49 | 29,325(0.17%)#62 | 3,636,375(0.00%)#3,752 |
| 63. | Craig | 46 | 29,325(0.16%)#63 | 3,636,375(0.00%)#3,844 |
| 64. | Fairmount | 45 | 29,325(0.15%)#64 | 3,636,375(0.00%)#3,869 |
| 65. | Niwot | 44 | 29,325(0.15%)#65 | 3,636,375(0.00%)#3,922 |
| 66. | Golden | 43 | 29,325(0.15%)#66 | 3,636,375(0.00%)#3,942 |
| 67. | Brighton | 42 | 29,325(0.14%)#67 | 3,636,375(0.00%)#3,978 |
| 68. | Montrose | 42 | 29,325(0.14%)#68 | 3,636,375(0.00%)#3,984 |
| 69. | Edgewater | 42 | 29,325(0.14%)#69 | 3,636,375(0.00%)#3,996 |
| 70. | The Pinery | 41 | 29,325(0.14%)#70 | 3,636,375(0.00%)#4,020 |
| 71. | Manitou Springs | 40 | 29,325(0.14%)#71 | 3,636,375(0.00%)#4,080 |
| 72. | Midland | 39 | 29,325(0.13%)#72 | 3,636,375(0.00%)#4,129 |
| 73. | Roxborough Park | 36 | 29,325(0.12%)#73 | 3,636,375(0.00%)#4,239 |
| 74. | Gypsum | 36 | 29,325(0.12%)#74 | 3,636,375(0.00%)#4,240 |
| 75. | Firestone | 35 | 29,325(0.12%)#75 | 3,636,375(0.00%)#4,274 |
| 76. | Trinidad | 32 | 29,325(0.11%)#76 | 3,636,375(0.00%)#4,442 |
| 77. | Brick Center | 31 | 29,325(0.11%)#77 | 3,636,375(0.00%)#4,530 |
| 78. | Sheridan | 30 | 29,325(0.10%)#78 | 3,636,375(0.00%)#4,554 |
| 79. | New Castle | 30 | 29,325(0.10%)#79 | 3,636,375(0.00%)#4,561 |
| 80. | Columbine | 29 | 29,325(0.10%)#80 | 3,636,375(0.00%)#4,590 |
| 81. | Eagle | 29 | 29,325(0.10%)#81 | 3,636,375(0.00%)#4,611 |
| 82. | Silverthorne | 29 | 29,325(0.10%)#82 | 3,636,375(0.00%)#4,619 |
| 83. | Evergreen | 28 | 29,325(0.10%)#83 | 3,636,375(0.00%)#4,677 |
| 84. | Severance | 27 | 29,325(0.09%)#84 | 3,636,375(0.00%)#4,746 |
| 85. | Timnath | 26 | 29,325(0.09%)#85 | 3,636,375(0.00%)#4,811 |
| 86. | Genesee | 25 | 29,325(0.09%)#86 | 3,636,375(0.00%)#4,881 |
| 87. | Gunnison | 24 | 29,325(0.08%)#87 | 3,636,375(0.00%)#4,942 |
| 88. | Sherrelwood | 23 | 29,325(0.08%)#88 | 3,636,375(0.00%)#4,994 |
| 89. | Granby | 22 | 29,325(0.08%)#89 | 3,636,375(0.00%)#5,114 |
| 90. | Altona | 22 | 29,325(0.08%)#90 | 3,636,375(0.00%)#5,138 |
| 91. | Gleneagle | 20 | 29,325(0.07%)#91 | 3,636,375(0.00%)#5,229 |
| 92. | Berthoud | 19 | 29,325(0.06%)#92 | 3,636,375(0.00%)#5,302 |
| 93. | Fruitvale | 19 | 29,325(0.06%)#93 | 3,636,375(0.00%)#5,310 |
| 94. | Gunbarrel | 18 | 29,325(0.06%)#94 | 3,636,375(0.00%)#5,387 |
| 95. | Woodmoor | 18 | 29,325(0.06%)#95 | 3,636,375(0.00%)#5,393 |
| 96. | Paonia | 17 | 29,325(0.06%)#96 | 3,636,375(0.00%)#5,533 |
| 97. | Frederick | 15 | 29,325(0.05%)#97 | 3,636,375(0.00%)#5,642 |
| 98. | Hot Sulphur Springs | 15 | 29,325(0.05%)#98 | 3,636,375(0.00%)#5,726 |
| 99. | Rifle | 14 | 29,325(0.05%)#99 | 3,636,375(0.00%)#5,752 |
| 100. | Salt Creek | 14 | 29,325(0.05%)#100 | 3,636,375(0.00%)#5,830 |
Common Questions
What are the Top 10 Cities with the Most Immigrants from South America in Colorado?
Top 10 Cities with the Most Immigrants from South America in Colorado are:
#1
6,203
#2
2,854
#3
1,818
#4
1,203
#5
928
#6
866
#7
858
#8
713
#9
711
#10
650
What city has the Most Immigrants from South America in Colorado?
Denver has the Most Immigrants from South America in Colorado with 6,203.
What is the Total Immigrants from South America in the State of Colorado?
Total Immigrants from South America in Colorado is 29,325.
What is the Total Immigrants from South America in the United States?
Total Immigrants from South America in the United States is 3,636,375.