Zip Codes with the Highest Percentage of Population with a Degree in Liberal Arts and History in Euclid, OH
RELATED REPORTS & OPTIONS
Liberal Arts and History
Euclid
Compare Zip Codes
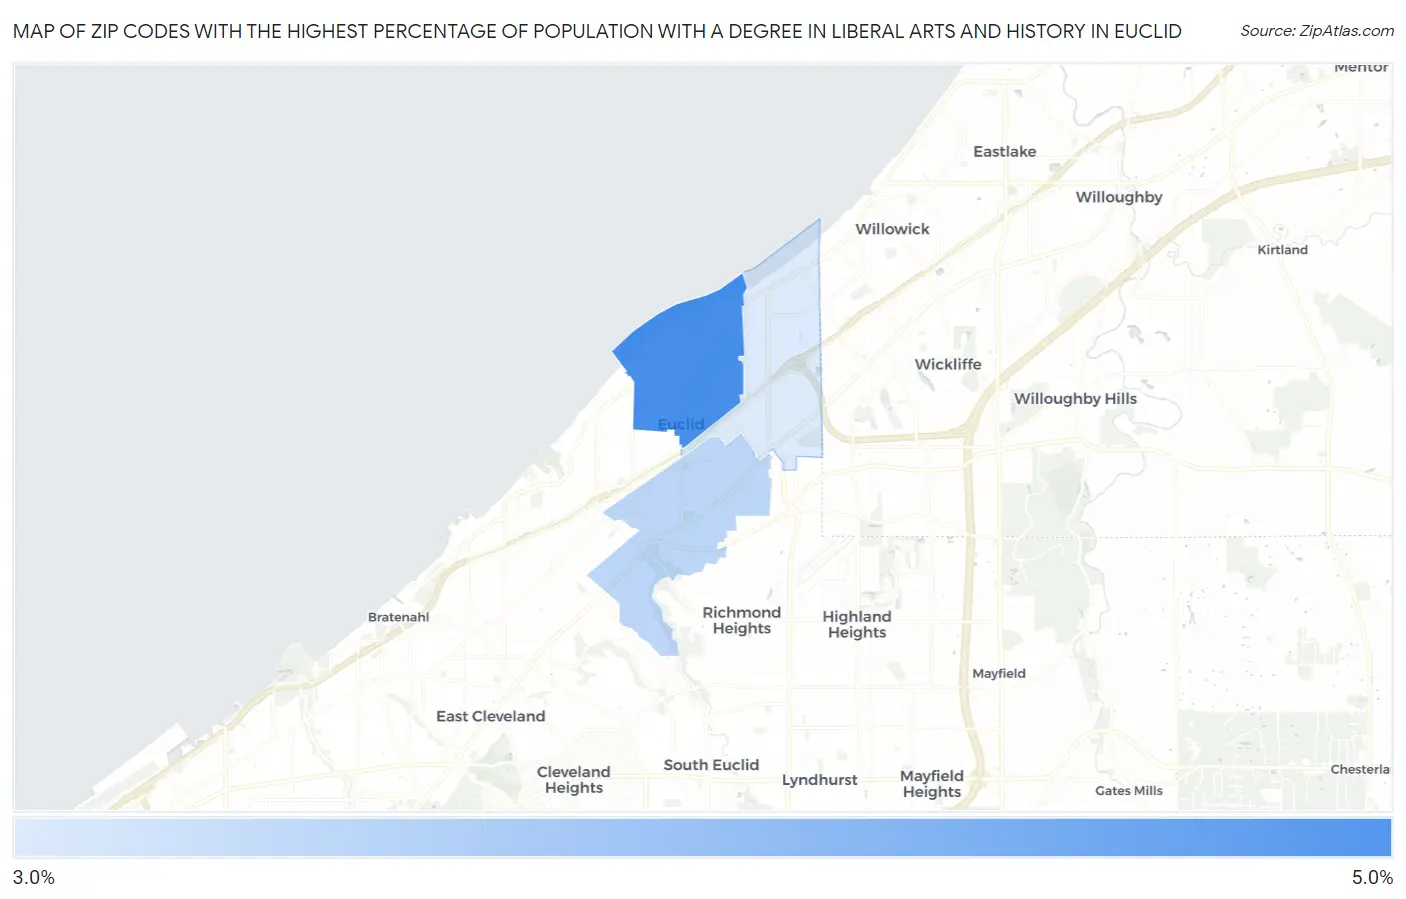
Map of Zip Codes with the Highest Percentage of Population with a Degree in Liberal Arts and History in Euclid
3.9%
4.4%
Zip Codes with the Highest Percentage of Population with a Degree in Liberal Arts and History in Euclid, OH
| Zip Code | % Graduates | vs State | vs National | |
| 1. | 44123 | 4.4% | 4.2%(+0.223)#408 | 4.9%(-0.452)#13,226 |
| 2. | 44117 | 4.0% | 4.2%(-0.175)#450 | 4.9%(-0.849)#14,680 |
| 3. | 44132 | 3.9% | 4.2%(-0.287)#464 | 4.9%(-0.961)#15,134 |
1
Common Questions
What are the Top Zip Codes with the Highest Percentage of Population with a Degree in Liberal Arts and History in Euclid, OH?
Top Zip Codes with the Highest Percentage of Population with a Degree in Liberal Arts and History in Euclid, OH are:
What zip code has the Highest Percentage of Population with a Degree in Liberal Arts and History in Euclid, OH?
44123 has the Highest Percentage of Population with a Degree in Liberal Arts and History in Euclid, OH with 4.4%.
What is the Percentage of Population with a Degree in Liberal Arts and History in Euclid, OH?
Percentage of Population with a Degree in Liberal Arts and History in Euclid is 4.2%.
What is the Percentage of Population with a Degree in Liberal Arts and History in Ohio?
Percentage of Population with a Degree in Liberal Arts and History in Ohio is 4.2%.
What is the Percentage of Population with a Degree in Liberal Arts and History in the United States?
Percentage of Population with a Degree in Liberal Arts and History in the United States is 4.9%.