Zip Codes with the Highest Percentage of Population with a Degree in Liberal Arts and History in Youngstown, OH
RELATED REPORTS & OPTIONS
Liberal Arts and History
Youngstown
Compare Zip Codes
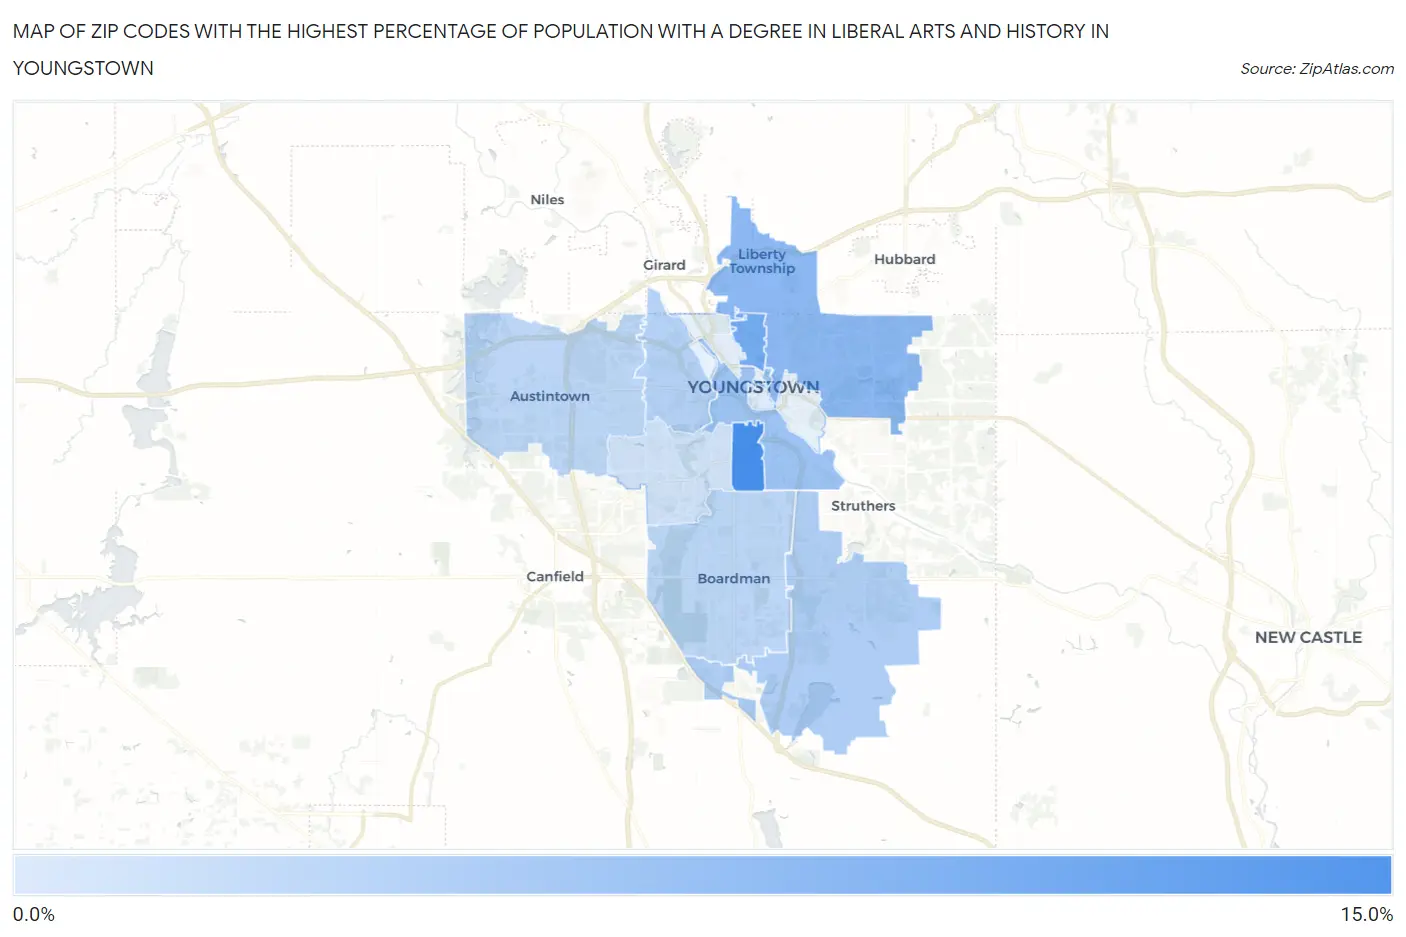
Map of Zip Codes with the Highest Percentage of Population with a Degree in Liberal Arts and History in Youngstown
1.3%
12.4%
Zip Codes with the Highest Percentage of Population with a Degree in Liberal Arts and History in Youngstown, OH
| Zip Code | % Graduates | vs State | vs National | |
| 1. | 44507 | 12.4% | 4.2%(+8.18)#60 | 4.9%(+7.50)#2,088 |
| 2. | 44504 | 8.8% | 4.2%(+4.62)#117 | 4.9%(+3.95)#4,012 |
| 3. | 44505 | 7.0% | 4.2%(+2.84)#179 | 4.9%(+2.16)#6,331 |
| 4. | 44502 | 5.7% | 4.2%(+1.47)#273 | 4.9%(+0.795)#9,382 |
| 5. | 44514 | 4.6% | 4.2%(+0.401)#387 | 4.9%(-0.273)#12,647 |
| 6. | 44509 | 4.1% | 4.2%(-0.126)#444 | 4.9%(-0.800)#14,502 |
| 7. | 44515 | 3.6% | 4.2%(-0.561)#502 | 4.9%(-1.24)#16,106 |
| 8. | 44512 | 3.5% | 4.2%(-0.668)#519 | 4.9%(-1.34)#16,481 |
| 9. | 44511 | 2.2% | 4.2%(-2.04)#725 | 4.9%(-2.71)#20,940 |
| 10. | 44503 | 1.3% | 4.2%(-2.92)#809 | 4.9%(-3.59)#22,900 |
1
Common Questions
What are the Top 10 Zip Codes with the Highest Percentage of Population with a Degree in Liberal Arts and History in Youngstown, OH?
Top 10 Zip Codes with the Highest Percentage of Population with a Degree in Liberal Arts and History in Youngstown, OH are:
What zip code has the Highest Percentage of Population with a Degree in Liberal Arts and History in Youngstown, OH?
44507 has the Highest Percentage of Population with a Degree in Liberal Arts and History in Youngstown, OH with 12.4%.
What is the Percentage of Population with a Degree in Liberal Arts and History in Youngstown, OH?
Percentage of Population with a Degree in Liberal Arts and History in Youngstown is 4.9%.
What is the Percentage of Population with a Degree in Liberal Arts and History in Ohio?
Percentage of Population with a Degree in Liberal Arts and History in Ohio is 4.2%.
What is the Percentage of Population with a Degree in Liberal Arts and History in the United States?
Percentage of Population with a Degree in Liberal Arts and History in the United States is 4.9%.