Williamsburg, OH Map & Demographics
Williamsburg Map
Williamsburg Overview
$28,863
PER CAPITA INCOME
$68,750
AVG FAMILY INCOME
$58,500
AVG HOUSEHOLD INCOME
0.3%
WAGE / INCOME GAP [ % ]
99.7¢/ $1
WAGE / INCOME GAP [ $ ]
0.41
INEQUALITY / GINI INDEX
2,583
TOTAL POPULATION
1,349
MALE POPULATION
1,234
FEMALE POPULATION
109.32
MALES / 100 FEMALES
91.48
FEMALES / 100 MALES
35.4
MEDIAN AGE
3.2
AVG FAMILY SIZE
2.5
AVG HOUSEHOLD SIZE
1,379
LABOR FORCE [ PEOPLE ]
63.5%
PERCENT IN LABOR FORCE
3.3%
UNEMPLOYMENT RATE
Williamsburg Zip Codes
Williamsburg Area Codes
Income in Williamsburg
Income Overview in Williamsburg
Per Capita Income in Williamsburg is $28,863, while median incomes of families and households are $68,750 and $58,500 respectively.
| Characteristic | Number | Measure |
| Per Capita Income | 2,583 | $28,863 |
| Median Family Income | 664 | $68,750 |
| Mean Family Income | 664 | $82,055 |
| Median Household Income | 986 | $58,500 |
| Mean Household Income | 986 | $70,781 |
| Income Deficit | 664 | $0 |
| Wage / Income Gap (%) | 2,583 | 0.34% |
| Wage / Income Gap ($) | 2,583 | 99.66¢ per $1 |
| Gini / Inequality Index | 2,583 | 0.41 |
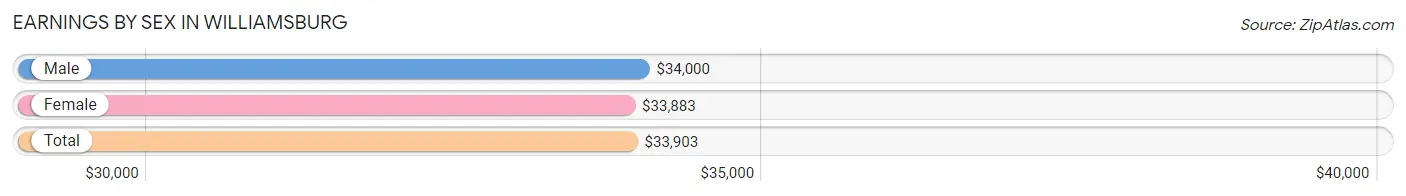
Earnings by Sex in Williamsburg
Average Earnings in Williamsburg are $33,903, $34,000 for men and $33,883 for women, a difference of 0.3%.
| Sex | Number | Average Earnings |
| Male | 826 (59.6%) | $34,000 |
| Female | 559 (40.4%) | $33,883 |
| Total | 1,385 (100.0%) | $33,903 |
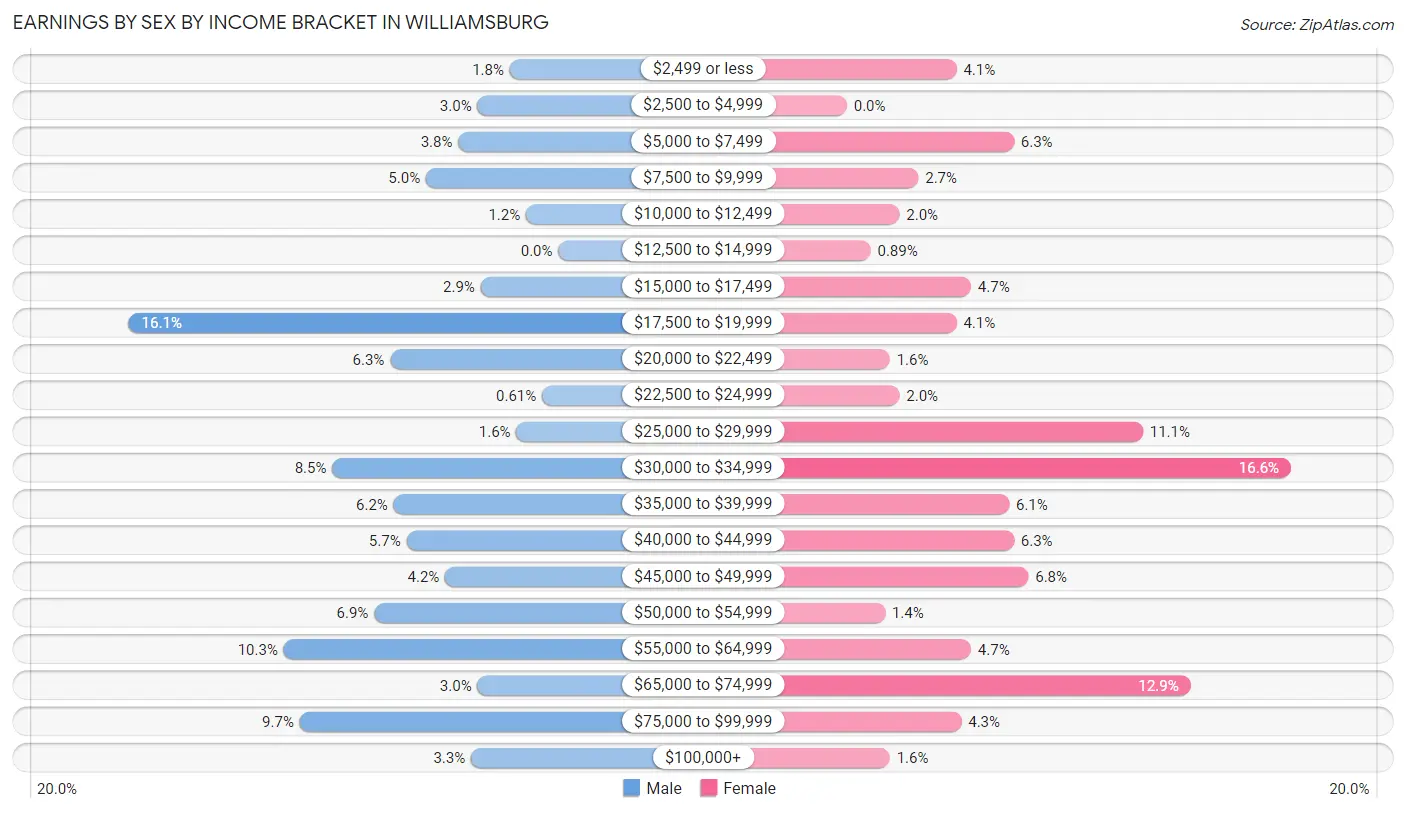
Earnings by Sex by Income Bracket in Williamsburg
The most common earnings brackets in Williamsburg are $17,500 to $19,999 for men (133 | 16.1%) and $30,000 to $34,999 for women (93 | 16.6%).
| Income | Male | Female |
| $2,499 or less | 15 (1.8%) | 23 (4.1%) |
| $2,500 to $4,999 | 25 (3.0%) | 0 (0.0%) |
| $5,000 to $7,499 | 31 (3.7%) | 35 (6.3%) |
| $7,500 to $9,999 | 41 (5.0%) | 15 (2.7%) |
| $10,000 to $12,499 | 10 (1.2%) | 11 (2.0%) |
| $12,500 to $14,999 | 0 (0.0%) | 5 (0.9%) |
| $15,000 to $17,499 | 24 (2.9%) | 26 (4.6%) |
| $17,500 to $19,999 | 133 (16.1%) | 23 (4.1%) |
| $20,000 to $22,499 | 52 (6.3%) | 9 (1.6%) |
| $22,500 to $24,999 | 5 (0.6%) | 11 (2.0%) |
| $25,000 to $29,999 | 13 (1.6%) | 62 (11.1%) |
| $30,000 to $34,999 | 70 (8.5%) | 93 (16.6%) |
| $35,000 to $39,999 | 51 (6.2%) | 34 (6.1%) |
| $40,000 to $44,999 | 47 (5.7%) | 35 (6.3%) |
| $45,000 to $49,999 | 35 (4.2%) | 38 (6.8%) |
| $50,000 to $54,999 | 57 (6.9%) | 8 (1.4%) |
| $55,000 to $64,999 | 85 (10.3%) | 26 (4.6%) |
| $65,000 to $74,999 | 25 (3.0%) | 72 (12.9%) |
| $75,000 to $99,999 | 80 (9.7%) | 24 (4.3%) |
| $100,000+ | 27 (3.3%) | 9 (1.6%) |
| Total | 826 (100.0%) | 559 (100.0%) |
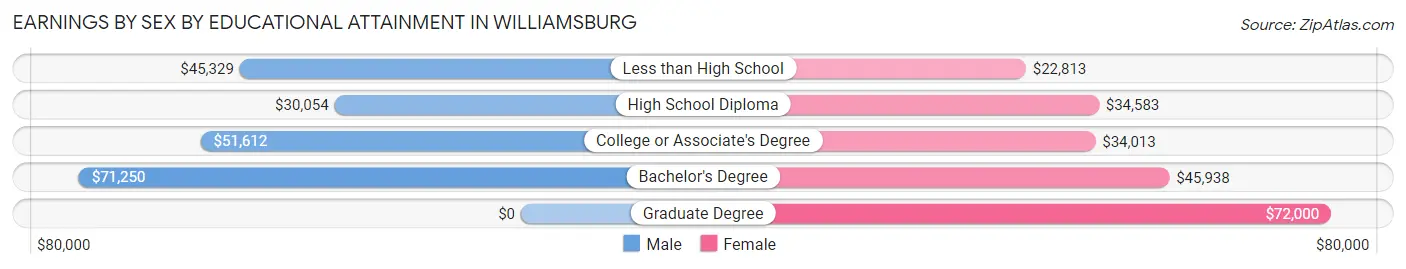
Earnings by Sex by Educational Attainment in Williamsburg
Average earnings in Williamsburg are $42,689 for men and $34,918 for women, a difference of 18.2%. Men with an educational attainment of bachelor's degree enjoy the highest average annual earnings of $71,250, while those with high school diploma education earn the least with $30,054. Women with an educational attainment of graduate degree earn the most with the average annual earnings of $72,000, while those with less than high school education have the smallest earnings of $22,813.
| Educational Attainment | Male Income | Female Income |
| Less than High School | $45,329 | $22,813 |
| High School Diploma | $30,054 | $34,583 |
| College or Associate's Degree | $51,612 | $34,013 |
| Bachelor's Degree | $71,250 | $45,938 |
| Graduate Degree | - | - |
| Total | $42,689 | $34,918 |
Family Income in Williamsburg
Family Income Brackets in Williamsburg
According to the Williamsburg family income data, there are 164 families falling into the $50,000 to $74,999 income range, which is the most common income bracket and makes up 24.7% of all families. Conversely, the $200,000+ income bracket is the least frequent group with only 19 families (2.9%) belonging to this category.
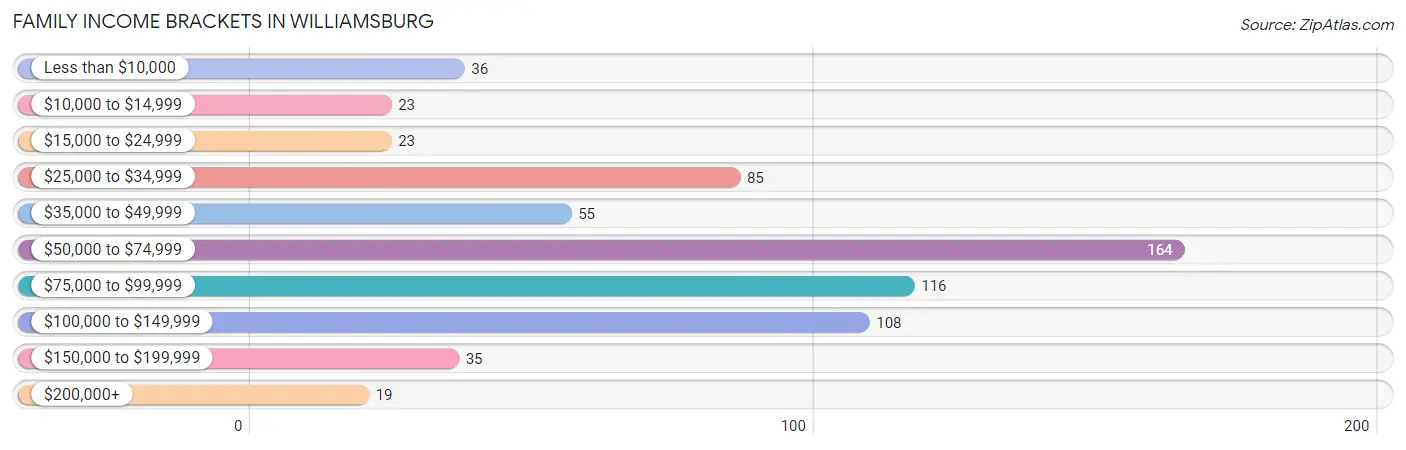
| Income Bracket | # Families | % Families |
| Less than $10,000 | 36 | 5.4% |
| $10,000 to $14,999 | 23 | 3.5% |
| $15,000 to $24,999 | 23 | 3.5% |
| $25,000 to $34,999 | 85 | 12.8% |
| $35,000 to $49,999 | 55 | 8.3% |
| $50,000 to $74,999 | 164 | 24.7% |
| $75,000 to $99,999 | 116 | 17.5% |
| $100,000 to $149,999 | 108 | 16.3% |
| $150,000 to $199,999 | 35 | 5.3% |
| $200,000+ | 19 | 2.9% |
Family Income by Famaliy Size in Williamsburg
4-person families (71 | 10.7%) account for the highest median family income in Williamsburg with $81,779 per family, while 2-person families (361 | 54.4%) have the highest median income of $27,840 per family member.
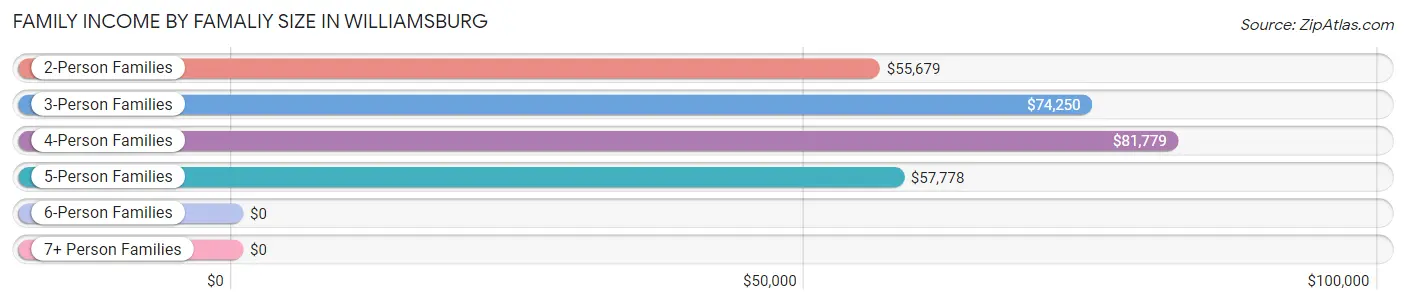
| Income Bracket | # Families | Median Income |
| 2-Person Families | 361 (54.4%) | $55,679 |
| 3-Person Families | 123 (18.5%) | $74,250 |
| 4-Person Families | 71 (10.7%) | $81,779 |
| 5-Person Families | 54 (8.1%) | $57,778 |
| 6-Person Families | 55 (8.3%) | $0 |
| 7+ Person Families | 0 (0.0%) | $0 |
| Total | 664 (100.0%) | $68,750 |
Family Income by Number of Earners in Williamsburg
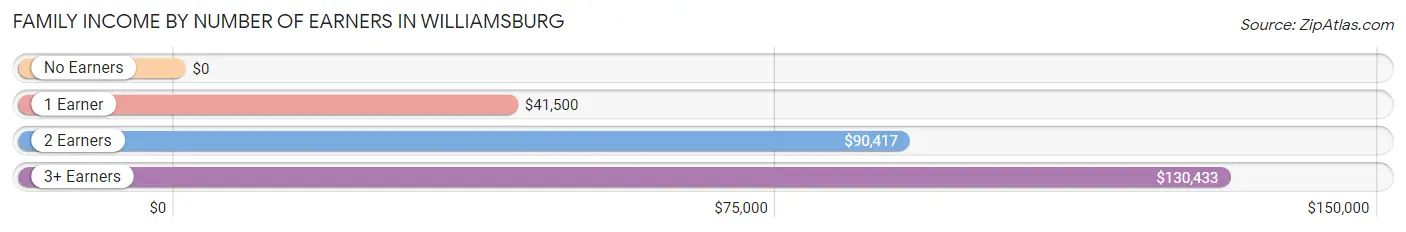
| Number of Earners | # Families | Median Income |
| No Earners | 108 (16.3%) | $0 |
| 1 Earner | 214 (32.2%) | $41,500 |
| 2 Earners | 271 (40.8%) | $90,417 |
| 3+ Earners | 71 (10.7%) | $130,433 |
| Total | 664 (100.0%) | $68,750 |
Household Income in Williamsburg
Household Income Brackets in Williamsburg
With 234 households falling in the category, the $50,000 to $74,999 income range is the most frequent in Williamsburg, accounting for 23.7% of all households. In contrast, only 19 households (1.9%) fall into the $200,000+ income bracket, making it the least populous group.
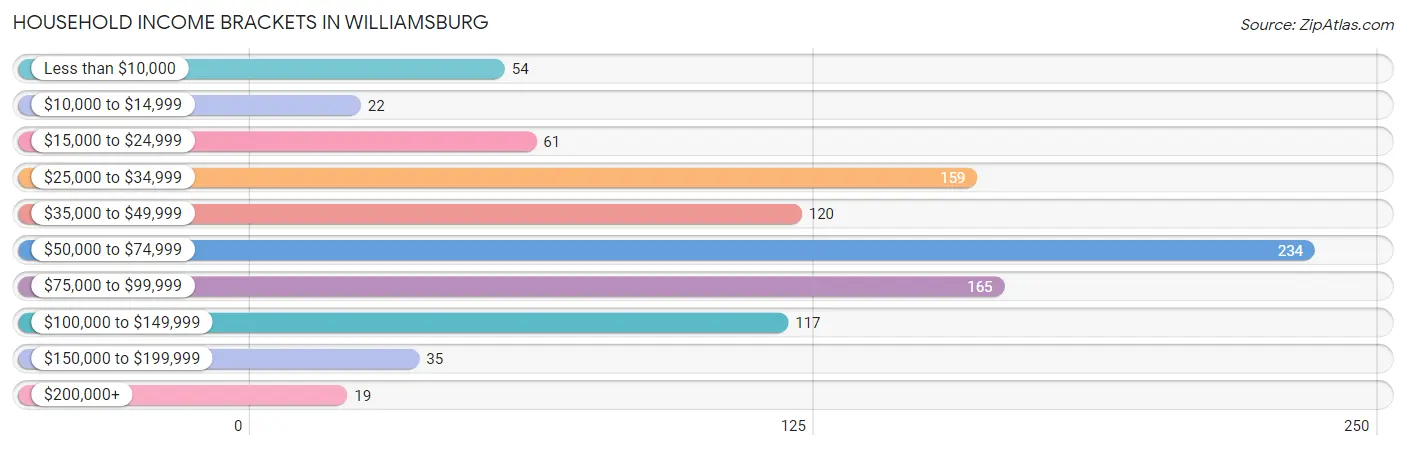
| Income Bracket | # Households | % Households |
| Less than $10,000 | 54 | 5.5% |
| $10,000 to $14,999 | 22 | 2.2% |
| $15,000 to $24,999 | 61 | 6.2% |
| $25,000 to $34,999 | 159 | 16.1% |
| $35,000 to $49,999 | 120 | 12.2% |
| $50,000 to $74,999 | 234 | 23.7% |
| $75,000 to $99,999 | 165 | 16.7% |
| $100,000 to $149,999 | 117 | 11.9% |
| $150,000 to $199,999 | 35 | 3.5% |
| $200,000+ | 19 | 1.9% |
Household Income by Householder Age in Williamsburg
The median household income in Williamsburg is $58,500, with the highest median household income of $72,155 found in the 25 to 44 years age bracket for the primary householder. A total of 312 households (31.6%) fall into this category. Meanwhile, the 65+ years age bracket for the primary householder has the lowest median household income of $38,250, with 224 households (22.7%) in this group.
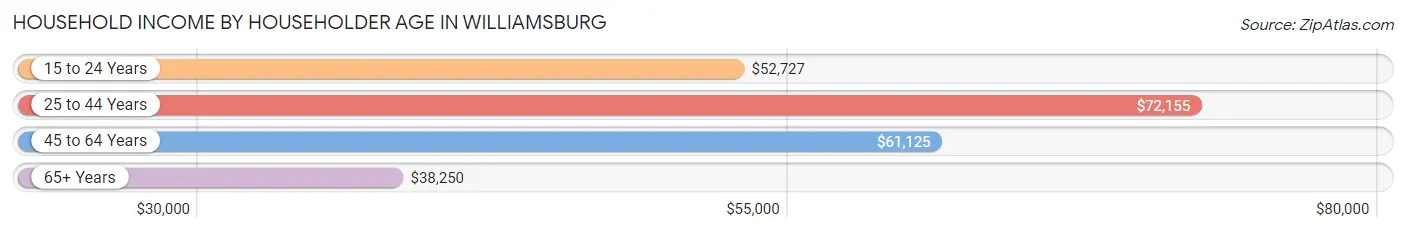
| Income Bracket | # Households | Median Income |
| 15 to 24 Years | 44 (4.5%) | $52,727 |
| 25 to 44 Years | 312 (31.6%) | $72,155 |
| 45 to 64 Years | 406 (41.2%) | $61,125 |
| 65+ Years | 224 (22.7%) | $38,250 |
| Total | 986 (100.0%) | $58,500 |
Poverty in Williamsburg
Income Below Poverty by Sex and Age in Williamsburg
With 12.7% poverty level for males and 18.1% for females among the residents of Williamsburg, 16 and 17 year old males and 16 and 17 year old females are the most vulnerable to poverty, with 48 males (65.7%) and 15 females (75.0%) in their respective age groups living below the poverty level.
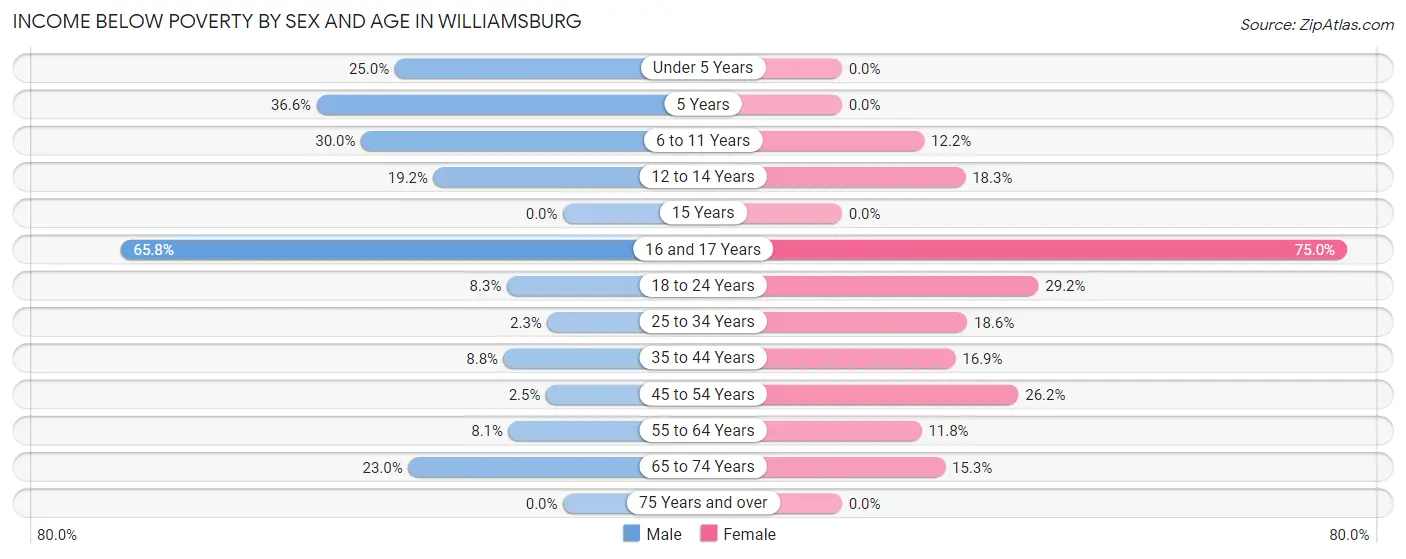
| Age Bracket | Male | Female |
| Under 5 Years | 15 (25.0%) | 0 (0.0%) |
| 5 Years | 15 (36.6%) | 0 (0.0%) |
| 6 to 11 Years | 9 (30.0%) | 11 (12.2%) |
| 12 to 14 Years | 10 (19.2%) | 11 (18.3%) |
| 15 Years | 0 (0.0%) | 0 (0.0%) |
| 16 and 17 Years | 48 (65.7%) | 15 (75.0%) |
| 18 to 24 Years | 15 (8.3%) | 54 (29.2%) |
| 25 to 34 Years | 6 (2.3%) | 24 (18.6%) |
| 35 to 44 Years | 15 (8.8%) | 29 (16.9%) |
| 45 to 54 Years | 4 (2.5%) | 38 (26.2%) |
| 55 to 64 Years | 14 (8.1%) | 20 (11.8%) |
| 65 to 74 Years | 20 (23.0%) | 21 (15.3%) |
| 75 Years and over | 0 (0.0%) | 0 (0.0%) |
| Total | 171 (12.7%) | 223 (18.1%) |
Income Above Poverty by Sex and Age in Williamsburg
According to the poverty statistics in Williamsburg, males aged 15 years and females aged under 5 years are the age groups that are most secure financially, with 100.0% of males and 100.0% of females in these age groups living above the poverty line.
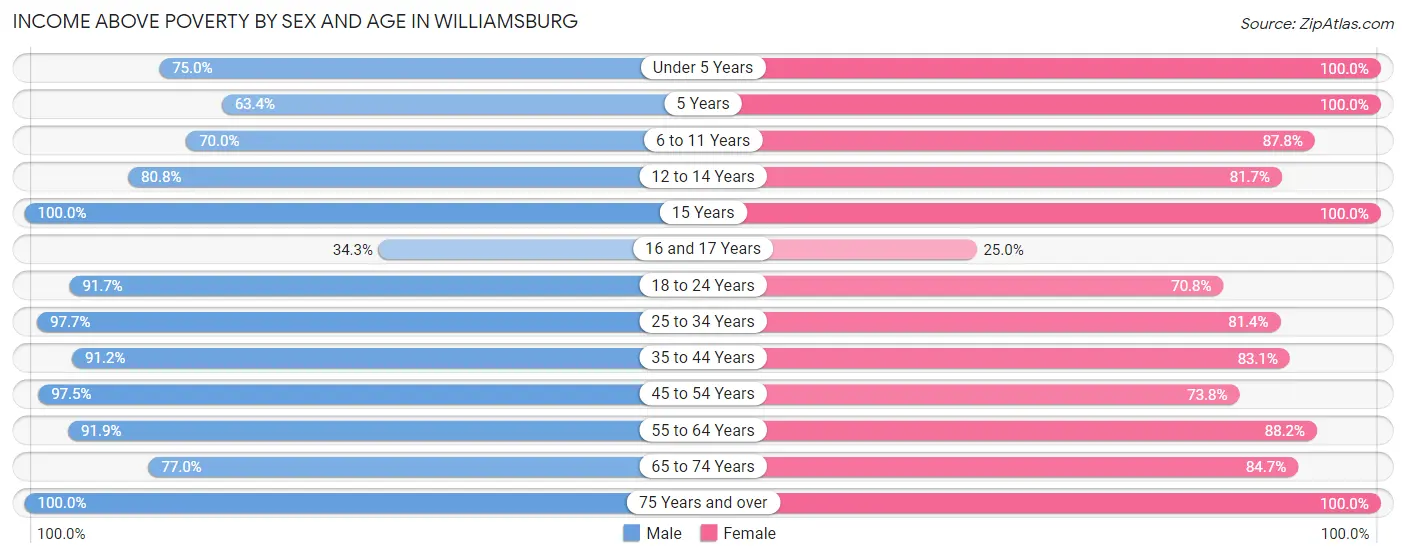
| Age Bracket | Male | Female |
| Under 5 Years | 45 (75.0%) | 54 (100.0%) |
| 5 Years | 26 (63.4%) | 7 (100.0%) |
| 6 to 11 Years | 21 (70.0%) | 79 (87.8%) |
| 12 to 14 Years | 42 (80.8%) | 49 (81.7%) |
| 15 Years | 12 (100.0%) | 5 (100.0%) |
| 16 and 17 Years | 25 (34.3%) | 5 (25.0%) |
| 18 to 24 Years | 165 (91.7%) | 131 (70.8%) |
| 25 to 34 Years | 252 (97.7%) | 105 (81.4%) |
| 35 to 44 Years | 155 (91.2%) | 143 (83.1%) |
| 45 to 54 Years | 154 (97.5%) | 107 (73.8%) |
| 55 to 64 Years | 159 (91.9%) | 149 (88.2%) |
| 65 to 74 Years | 67 (77.0%) | 116 (84.7%) |
| 75 Years and over | 55 (100.0%) | 61 (100.0%) |
| Total | 1,178 (87.3%) | 1,011 (81.9%) |
Income Below Poverty Among Married-Couple Families in Williamsburg
The poverty statistics for married-couple families in Williamsburg show that 4.9% or 26 of the total 528 families live below the poverty line. Families with 3 or 4 children have the highest poverty rate of 35.6%, comprising of 16 families. On the other hand, families with 1 or 2 children have the lowest poverty rate of 0.0%, which includes 0 families.
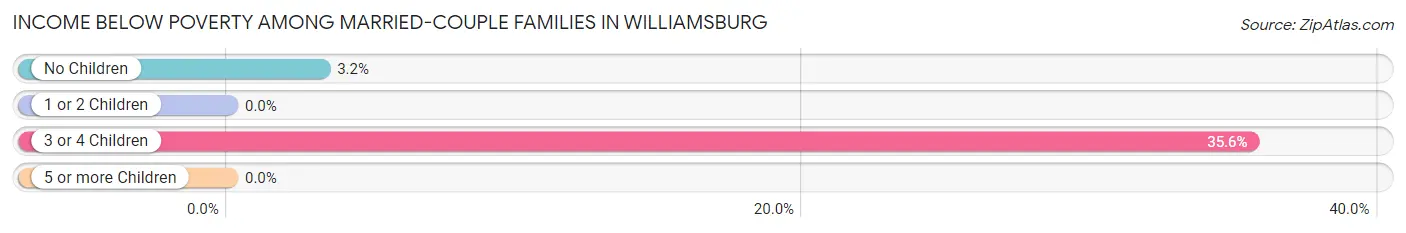
| Children | Above Poverty | Below Poverty |
| No Children | 302 (96.8%) | 10 (3.2%) |
| 1 or 2 Children | 171 (100.0%) | 0 (0.0%) |
| 3 or 4 Children | 29 (64.4%) | 16 (35.6%) |
| 5 or more Children | 0 (0.0%) | 0 (0.0%) |
| Total | 502 (95.1%) | 26 (4.9%) |
Income Below Poverty Among Single-Parent Households in Williamsburg
According to the poverty data in Williamsburg, 100.0% or 5 single-father households and 48.1% or 63 single-mother households are living below the poverty line. Among single-father households, those with 1 or 2 children have the highest poverty rate, with 5 households (100.0%) experiencing poverty. Likewise, among single-mother households, those with 1 or 2 children have the highest poverty rate, with 63 households (85.1%) falling below the poverty line.
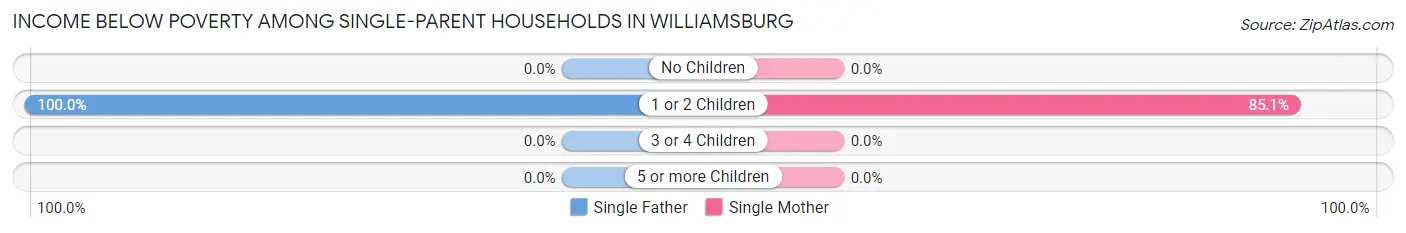
| Children | Single Father | Single Mother |
| No Children | 0 (0.0%) | 0 (0.0%) |
| 1 or 2 Children | 5 (100.0%) | 63 (85.1%) |
| 3 or 4 Children | 0 (0.0%) | 0 (0.0%) |
| 5 or more Children | 0 (0.0%) | 0 (0.0%) |
| Total | 5 (100.0%) | 63 (48.1%) |
Income Below Poverty Among Married-Couple vs Single-Parent Households in Williamsburg
The poverty data for Williamsburg shows that 26 of the married-couple family households (4.9%) and 68 of the single-parent households (50.0%) are living below the poverty level. Within the married-couple family households, those with 3 or 4 children have the highest poverty rate, with 16 households (35.6%) falling below the poverty line. Among the single-parent households, those with 1 or 2 children have the highest poverty rate, with 68 household (86.1%) living below poverty.
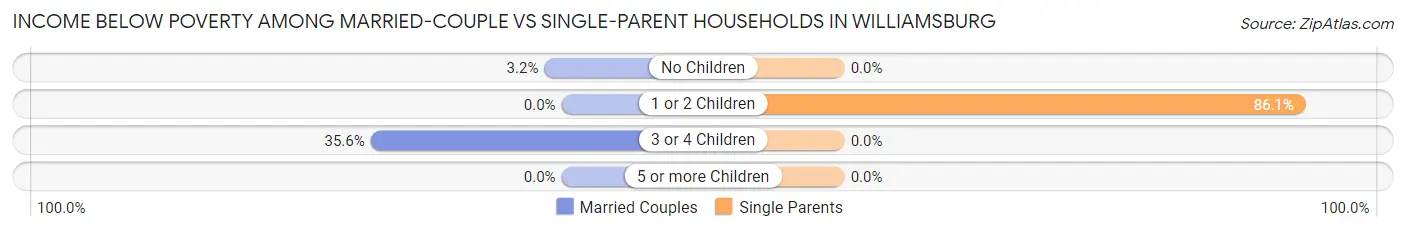
| Children | Married-Couple Families | Single-Parent Households |
| No Children | 10 (3.2%) | 0 (0.0%) |
| 1 or 2 Children | 0 (0.0%) | 68 (86.1%) |
| 3 or 4 Children | 16 (35.6%) | 0 (0.0%) |
| 5 or more Children | 0 (0.0%) | 0 (0.0%) |
| Total | 26 (4.9%) | 68 (50.0%) |
Race in Williamsburg
The most populous races in Williamsburg are White / Caucasian (2,414 | 93.5%), Some other Race (106 | 4.1%), and Two or more Races (40 | 1.5%).
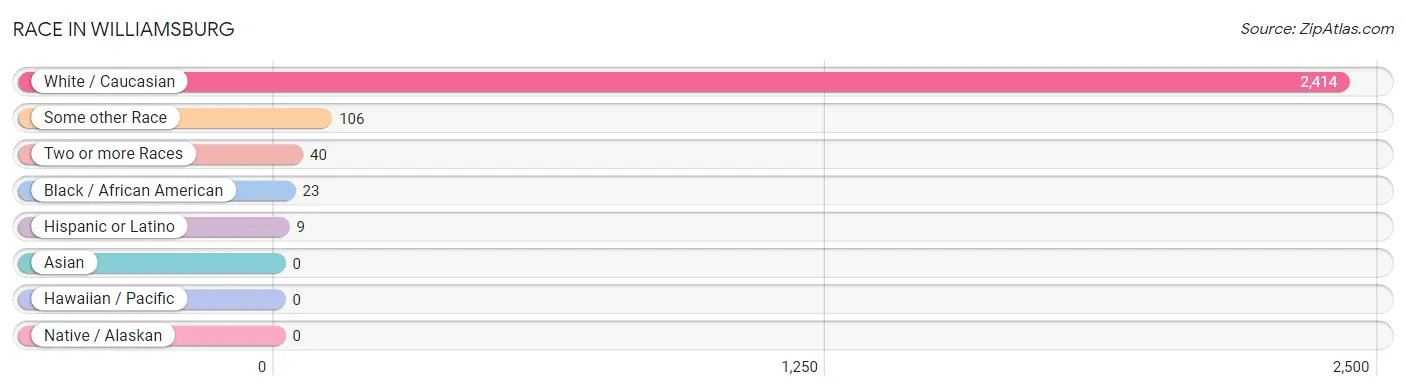
| Race | # Population | % Population |
| Asian | 0 | 0.0% |
| Black / African American | 23 | 0.9% |
| Hawaiian / Pacific | 0 | 0.0% |
| Hispanic or Latino | 9 | 0.4% |
| Native / Alaskan | 0 | 0.0% |
| White / Caucasian | 2,414 | 93.5% |
| Two or more Races | 40 | 1.5% |
| Some other Race | 106 | 4.1% |
| Total | 2,583 | 100.0% |
Ancestry in Williamsburg
The most populous ancestries reported in Williamsburg are German (483 | 18.7%), American (308 | 11.9%), Irish (252 | 9.8%), English (201 | 7.8%), and Italian (33 | 1.3%), together accounting for 49.4% of all Williamsburg residents.
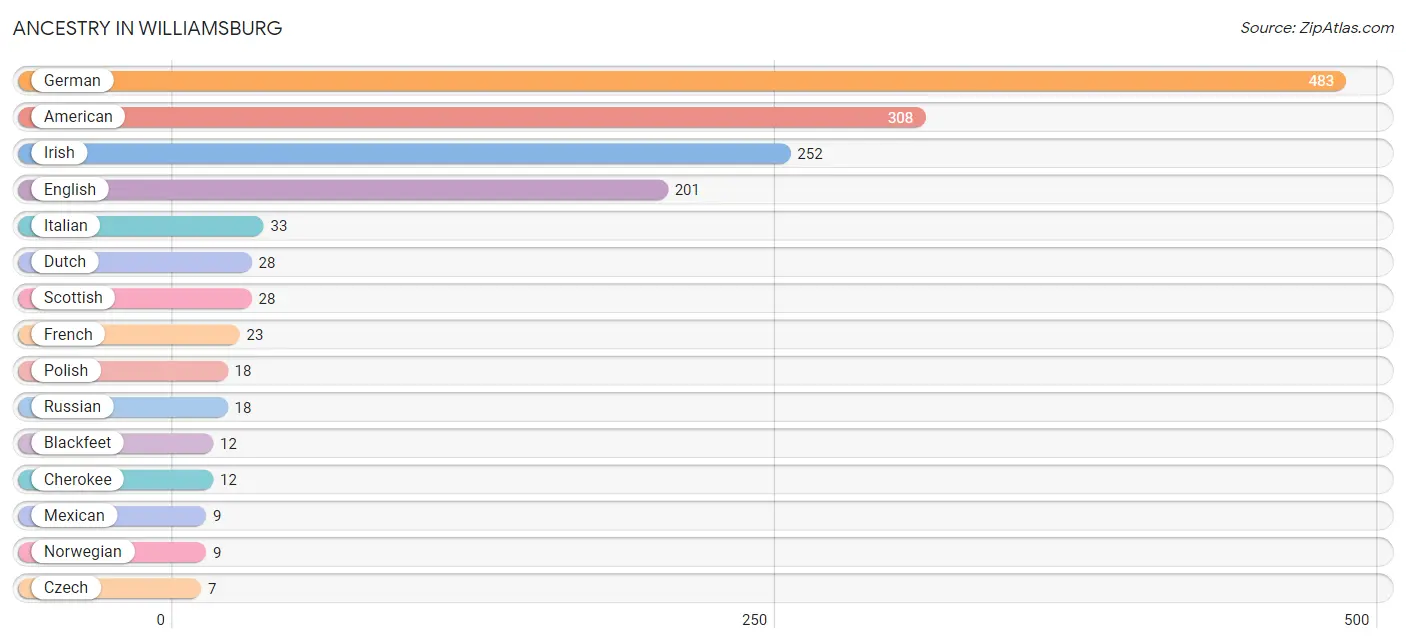
| Ancestry | # Population | % Population |
| American | 308 | 11.9% |
| Blackfeet | 12 | 0.5% |
| Cherokee | 12 | 0.5% |
| Czech | 7 | 0.3% |
| Danish | 5 | 0.2% |
| Dutch | 28 | 1.1% |
| English | 201 | 7.8% |
| French | 23 | 0.9% |
| French American Indian | 3 | 0.1% |
| German | 483 | 18.7% |
| Hungarian | 6 | 0.2% |
| Irish | 252 | 9.8% |
| Italian | 33 | 1.3% |
| Mexican | 9 | 0.4% |
| Norwegian | 9 | 0.4% |
| Polish | 18 | 0.7% |
| Russian | 18 | 0.7% |
| Scotch-Irish | 7 | 0.3% |
| Scottish | 28 | 1.1% |
| Slovak | 3 | 0.1% |
| Swedish | 7 | 0.3% |
| Welsh | 7 | 0.3% | View All 22 Rows |
Immigrants in Williamsburg

| Immigration Origin | # Population | % Population | View All 0 Rows |
Sex and Age in Williamsburg
Sex and Age in Williamsburg
The most populous age groups in Williamsburg are 30 to 34 Years (205 | 15.2%) for men and 20 to 24 Years (177 | 14.3%) for women.
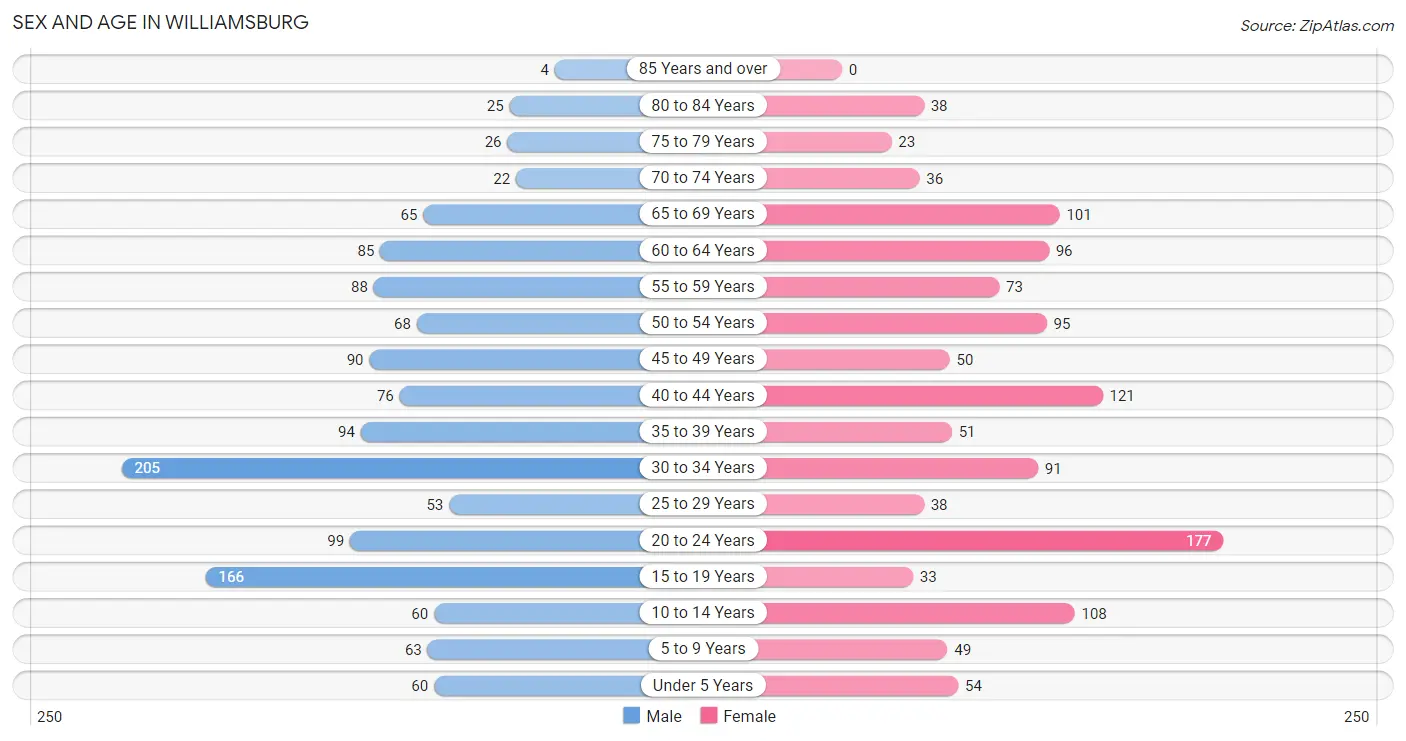
| Age Bracket | Male | Female |
| Under 5 Years | 60 (4.4%) | 54 (4.4%) |
| 5 to 9 Years | 63 (4.7%) | 49 (4.0%) |
| 10 to 14 Years | 60 (4.4%) | 108 (8.7%) |
| 15 to 19 Years | 166 (12.3%) | 33 (2.7%) |
| 20 to 24 Years | 99 (7.3%) | 177 (14.3%) |
| 25 to 29 Years | 53 (3.9%) | 38 (3.1%) |
| 30 to 34 Years | 205 (15.2%) | 91 (7.4%) |
| 35 to 39 Years | 94 (7.0%) | 51 (4.1%) |
| 40 to 44 Years | 76 (5.6%) | 121 (9.8%) |
| 45 to 49 Years | 90 (6.7%) | 50 (4.1%) |
| 50 to 54 Years | 68 (5.0%) | 95 (7.7%) |
| 55 to 59 Years | 88 (6.5%) | 73 (5.9%) |
| 60 to 64 Years | 85 (6.3%) | 96 (7.8%) |
| 65 to 69 Years | 65 (4.8%) | 101 (8.2%) |
| 70 to 74 Years | 22 (1.6%) | 36 (2.9%) |
| 75 to 79 Years | 26 (1.9%) | 23 (1.9%) |
| 80 to 84 Years | 25 (1.8%) | 38 (3.1%) |
| 85 Years and over | 4 (0.3%) | 0 (0.0%) |
| Total | 1,349 (100.0%) | 1,234 (100.0%) |
Families and Households in Williamsburg
Median Family Size in Williamsburg
The median family size in Williamsburg is 3.17 persons per family, with single female/mother families (131 | 19.7%) accounting for the largest median family size of 3.23 persons per family. On the other hand, single male/father families (5 | 0.7%) represent the smallest median family size with 2.00 persons per family.
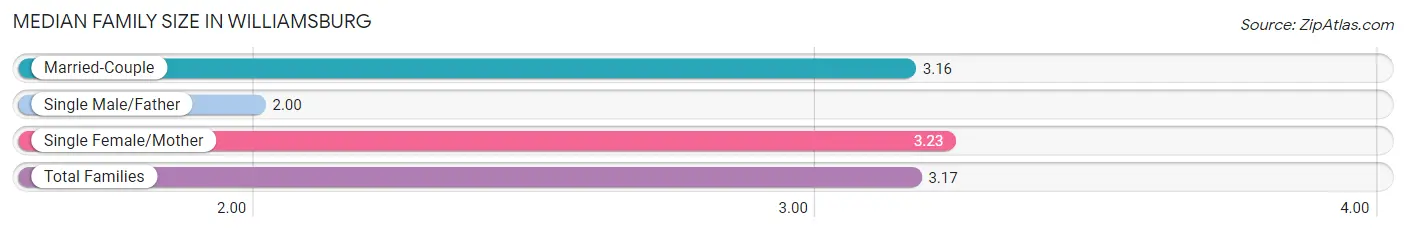
| Family Type | # Families | Family Size |
| Married-Couple | 528 (79.5%) | 3.16 |
| Single Male/Father | 5 (0.7%) | 2.00 |
| Single Female/Mother | 131 (19.7%) | 3.23 |
| Total Families | 664 (100.0%) | 3.17 |
Median Household Size in Williamsburg
The median household size in Williamsburg is 2.55 persons per household, with single female/mother households (131 | 13.3%) accounting for the largest median household size of 3.46 persons per household. non-family households (322 | 32.7%) represent the smallest median household size with 1.15 persons per household.
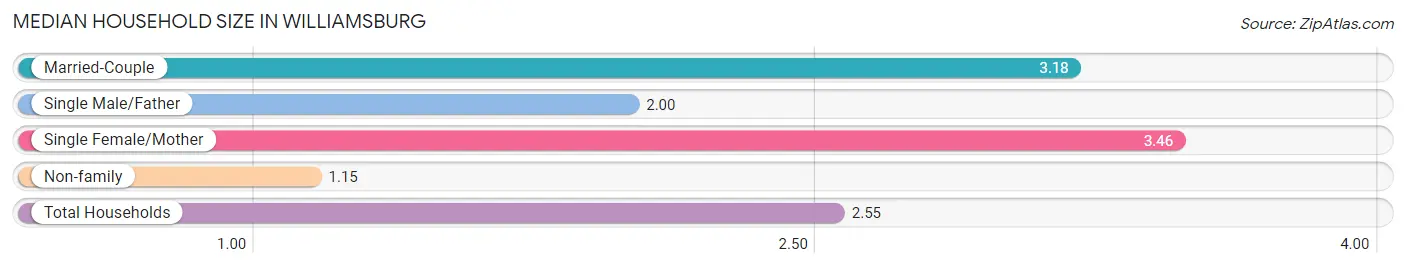
| Household Type | # Households | Household Size |
| Married-Couple | 528 (53.5%) | 3.18 |
| Single Male/Father | 5 (0.5%) | 2.00 |
| Single Female/Mother | 131 (13.3%) | 3.46 |
| Non-family | 322 (32.7%) | 1.15 |
| Total Households | 986 (100.0%) | 2.55 |
Household Size by Marriage Status in Williamsburg
Out of a total of 986 households in Williamsburg, 664 (67.3%) are family households, while 322 (32.7%) are nonfamily households. The most numerous type of family households are 2-person households, comprising 351, and the most common type of nonfamily households are 1-person households, comprising 275.
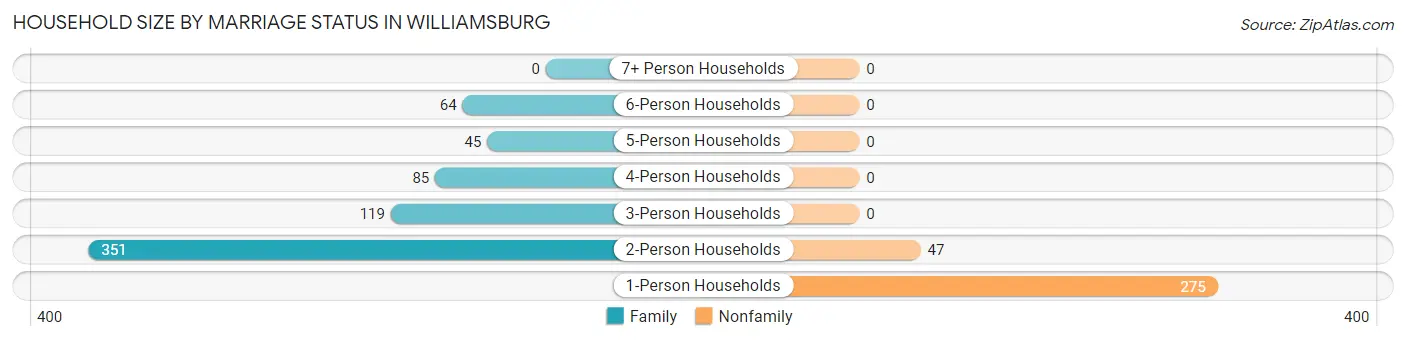
| Household Size | Family Households | Nonfamily Households |
| 1-Person Households | - | 275 (27.9%) |
| 2-Person Households | 351 (35.6%) | 47 (4.8%) |
| 3-Person Households | 119 (12.1%) | 0 (0.0%) |
| 4-Person Households | 85 (8.6%) | 0 (0.0%) |
| 5-Person Households | 45 (4.6%) | 0 (0.0%) |
| 6-Person Households | 64 (6.5%) | 0 (0.0%) |
| 7+ Person Households | 0 (0.0%) | 0 (0.0%) |
| Total | 664 (67.3%) | 322 (32.7%) |
Female Fertility in Williamsburg
Fertility by Age in Williamsburg
Average fertility rate in Williamsburg is 116.0 births per 1,000 women. Women in the age bracket of 20 to 34 years have the highest fertility rate with 186.0 births per 1,000 women. Women in the age bracket of 20 to 34 years acount for 86.4% of all women with births.
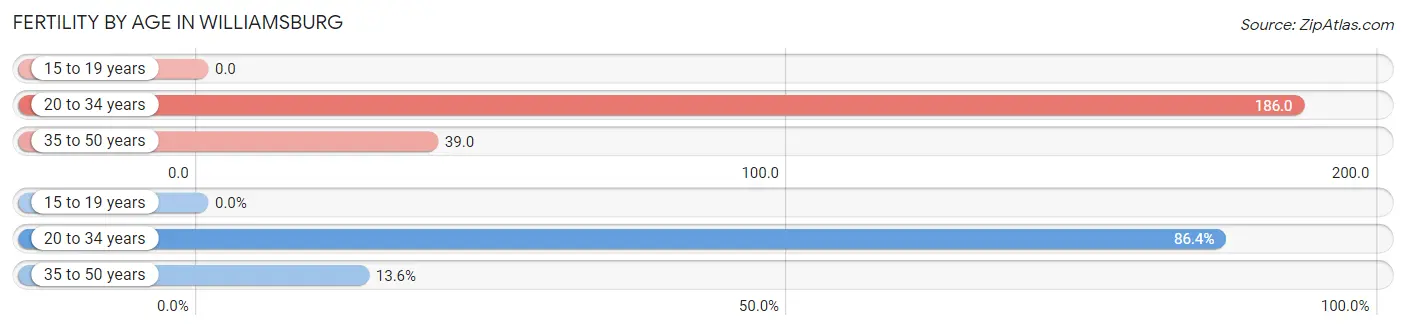
| Age Bracket | Women with Births | Births / 1,000 Women |
| 15 to 19 years | 0 (0.0%) | 0.0 |
| 20 to 34 years | 57 (86.4%) | 186.0 |
| 35 to 50 years | 9 (13.6%) | 39.0 |
| Total | 66 (100.0%) | 116.0 |
Fertility by Age by Marriage Status in Williamsburg
77.3% of women with births (66) in Williamsburg are married. The highest percentage of unmarried women with births falls into 20 to 34 years age bracket with 26.3% of them unmarried at the time of birth, while the lowest percentage of unmarried women with births belong to 35 to 50 years age bracket with 0.0% of them unmarried.
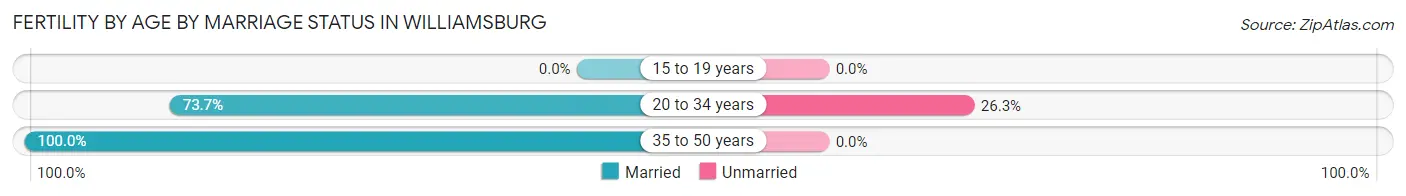
| Age Bracket | Married | Unmarried |
| 15 to 19 years | 0 (0.0%) | 0 (0.0%) |
| 20 to 34 years | 42 (73.7%) | 15 (26.3%) |
| 35 to 50 years | 9 (100.0%) | 0 (0.0%) |
| Total | 51 (77.3%) | 15 (22.7%) |
Fertility by Education in Williamsburg
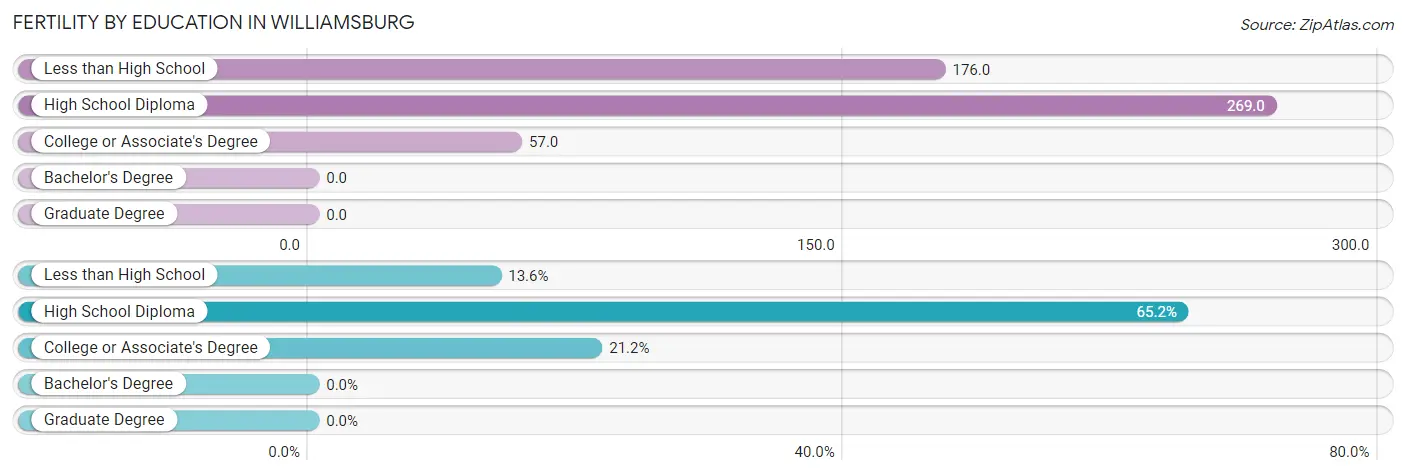
| Educational Attainment | Women with Births | Births / 1,000 Women |
| Less than High School | 9 (13.6%) | 176.0 |
| High School Diploma | 43 (65.1%) | 269.0 |
| College or Associate's Degree | 14 (21.2%) | 57.0 |
| Bachelor's Degree | 0 (0.0%) | 0.0 |
| Graduate Degree | 0 (0.0%) | 0.0 |
| Total | 66 (100.0%) | 116.0 |
Fertility by Education by Marriage Status in Williamsburg
22.7% of women with births in Williamsburg are unmarried. Women with the educational attainment of college or associate's degree are most likely to be married with 100.0% of them married at childbirth, while women with the educational attainment of less than high school are least likely to be married with 100.0% of them unmarried at childbirth.
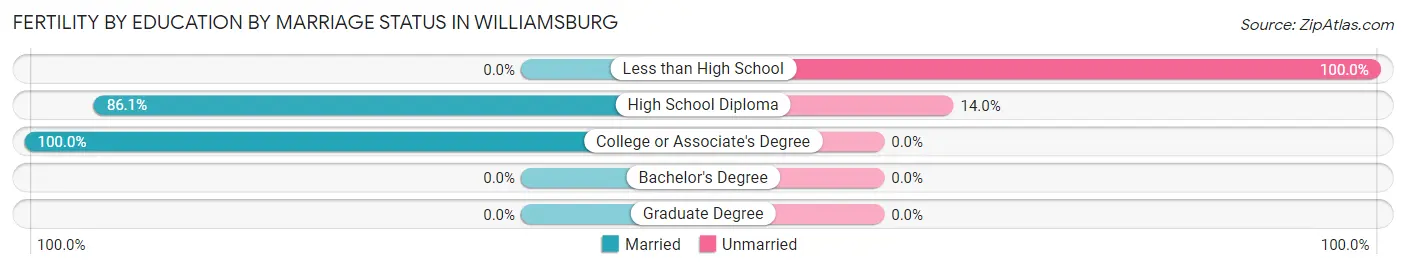
| Educational Attainment | Married | Unmarried |
| Less than High School | 0 (0.0%) | 9 (100.0%) |
| High School Diploma | 37 (86.1%) | 6 (14.0%) |
| College or Associate's Degree | 14 (100.0%) | 0 (0.0%) |
| Bachelor's Degree | 0 (0.0%) | 0 (0.0%) |
| Graduate Degree | 0 (0.0%) | 0 (0.0%) |
| Total | 51 (77.3%) | 15 (22.7%) |
Employment Characteristics in Williamsburg
Employment by Class of Employer in Williamsburg
Among the 1,327 employed individuals in Williamsburg, private company employees (1,115 | 84.0%), local government employees (107 | 8.1%), and not-for-profit organizations (37 | 2.8%) make up the most common classes of employment.
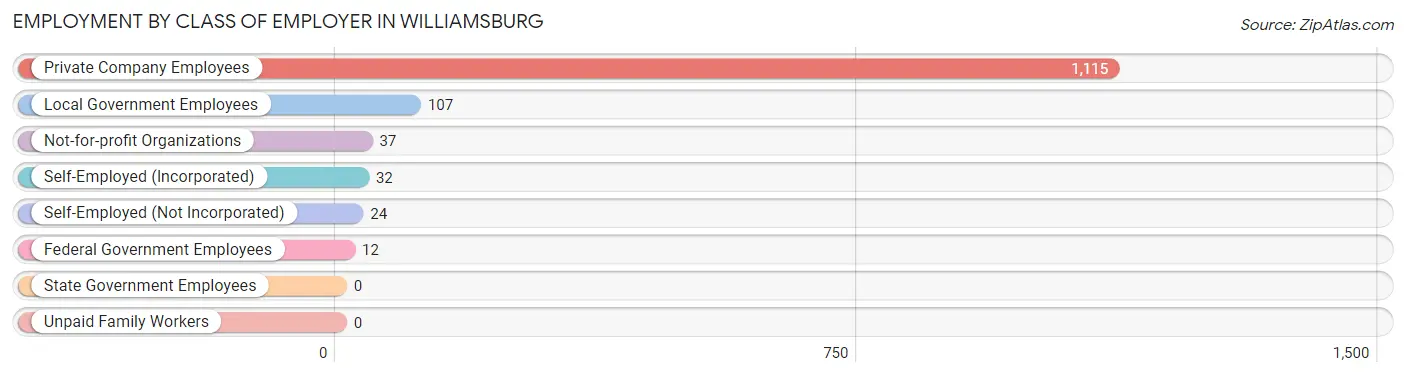
| Employer Class | # Employees | % Employees |
| Private Company Employees | 1,115 | 84.0% |
| Self-Employed (Incorporated) | 32 | 2.4% |
| Self-Employed (Not Incorporated) | 24 | 1.8% |
| Not-for-profit Organizations | 37 | 2.8% |
| Local Government Employees | 107 | 8.1% |
| State Government Employees | 0 | 0.0% |
| Federal Government Employees | 12 | 0.9% |
| Unpaid Family Workers | 0 | 0.0% |
| Total | 1,327 | 100.0% |
Employment Status by Age in Williamsburg
According to the labor force statistics for Williamsburg, out of the total population over 16 years of age (2,172), 63.5% or 1,379 individuals are in the labor force, with 3.3% or 46 of them unemployed. The age group with the highest labor force participation rate is 25 to 29 years, with 100.0% or 91 individuals in the labor force. Within the labor force, the 20 to 24 years age range has the highest percentage of unemployed individuals, with 12.8% or 20 of them being unemployed.
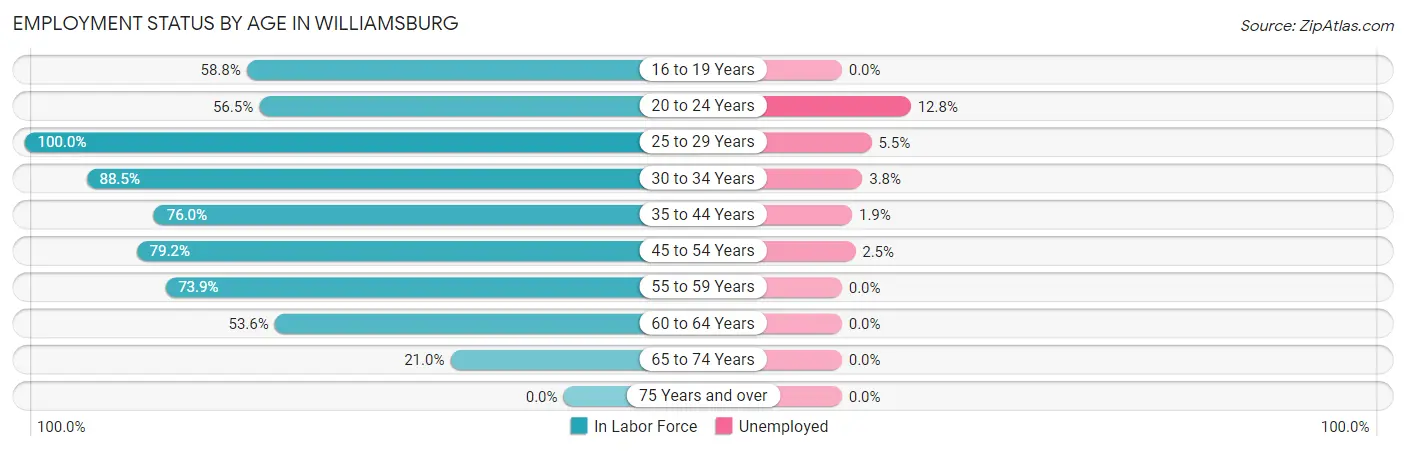
| Age Bracket | In Labor Force | Unemployed |
| 16 to 19 Years | 107 (58.8%) | 0 (0.0%) |
| 20 to 24 Years | 156 (56.5%) | 20 (12.8%) |
| 25 to 29 Years | 91 (100.0%) | 5 (5.5%) |
| 30 to 34 Years | 262 (88.5%) | 10 (3.8%) |
| 35 to 44 Years | 260 (76.0%) | 5 (1.9%) |
| 45 to 54 Years | 240 (79.2%) | 6 (2.5%) |
| 55 to 59 Years | 119 (73.9%) | 0 (0.0%) |
| 60 to 64 Years | 97 (53.6%) | 0 (0.0%) |
| 65 to 74 Years | 47 (21.0%) | 0 (0.0%) |
| 75 Years and over | 0 (0.0%) | 0 (0.0%) |
| Total | 1,379 (63.5%) | 46 (3.3%) |
Employment Status by Educational Attainment in Williamsburg
According to labor force statistics for Williamsburg, 77.8% of individuals (1,069) out of the total population between 25 and 64 years of age (1,374) are in the labor force, with 2.4% or 26 of them being unemployed. The group with the highest labor force participation rate are those with the educational attainment of bachelor's degree or higher, with 84.3% or 118 individuals in the labor force. Within the labor force, individuals with less than high school education have the highest percentage of unemployment, with 7.7% or 6 of them being unemployed.
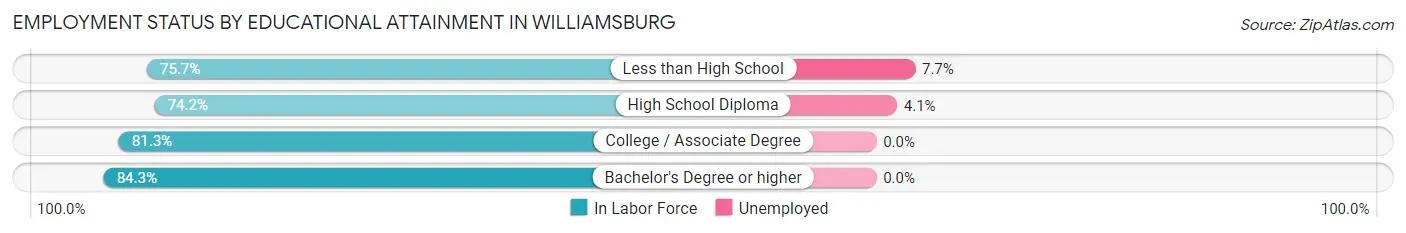
| Educational Attainment | In Labor Force | Unemployed |
| Less than High School | 78 (75.7%) | 8 (7.7%) |
| High School Diploma | 483 (74.2%) | 27 (4.1%) |
| College / Associate Degree | 390 (81.3%) | 0 (0.0%) |
| Bachelor's Degree or higher | 118 (84.3%) | 0 (0.0%) |
| Total | 1,069 (77.8%) | 33 (2.4%) |
Employment Occupations by Sex in Williamsburg
Management, Business, Science and Arts Occupations
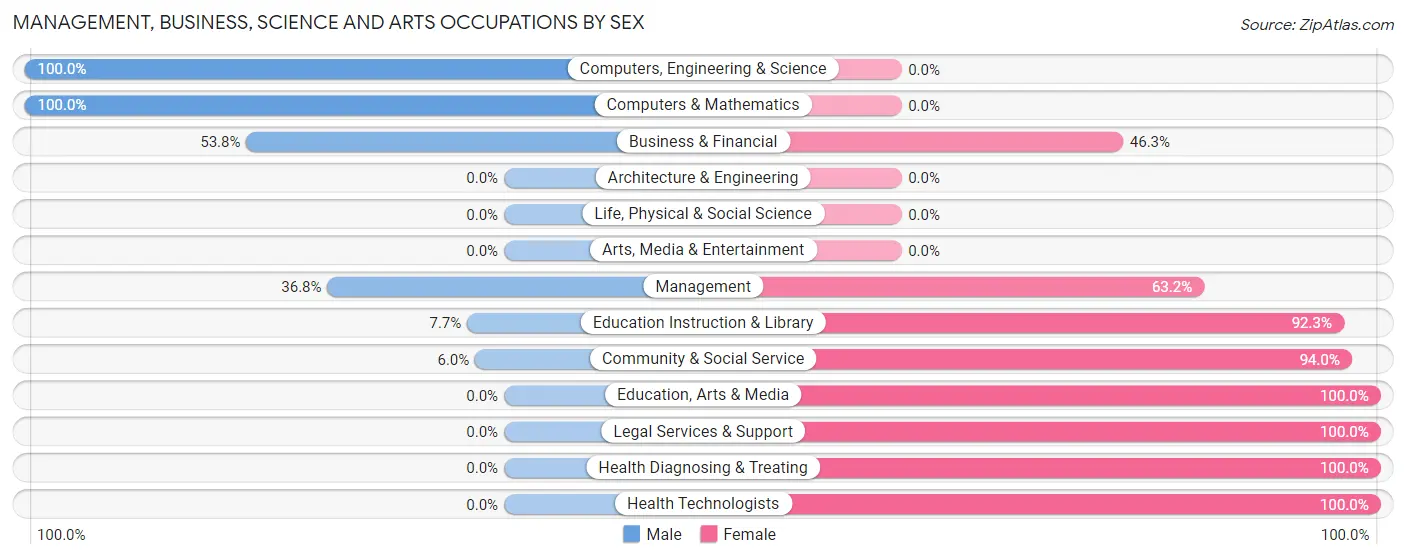
The most common Management, Business, Science and Arts occupations in Williamsburg are Management (133 | 10.0%), Community & Social Service (83 | 6.2%), Business & Financial (80 | 6.0%), Education Instruction & Library (65 | 4.9%), and Health Diagnosing & Treating (45 | 3.4%).
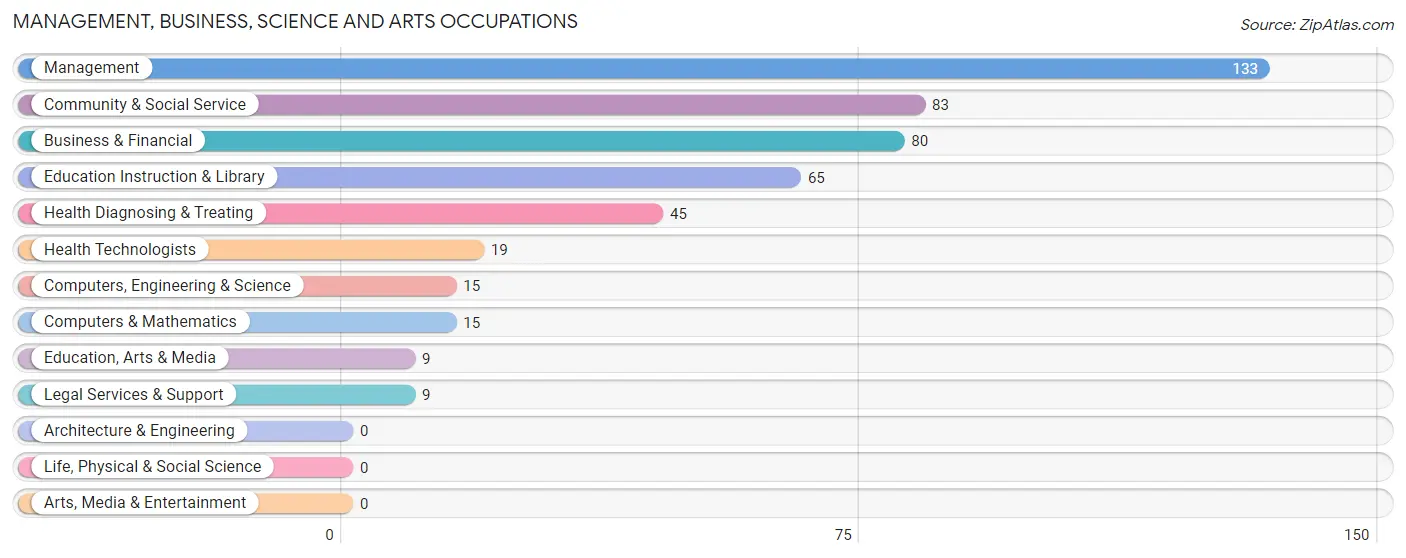
Management, Business, Science and Arts Occupations by Sex
Within the Management, Business, Science and Arts occupations in Williamsburg, the most male-oriented occupations are Computers, Engineering & Science (100.0%), Computers & Mathematics (100.0%), and Business & Financial (53.7%), while the most female-oriented occupations are Education, Arts & Media (100.0%), Legal Services & Support (100.0%), and Health Diagnosing & Treating (100.0%).
| Occupation | Male | Female |
| Management | 49 (36.8%) | 84 (63.2%) |
| Business & Financial | 43 (53.7%) | 37 (46.3%) |
| Computers, Engineering & Science | 15 (100.0%) | 0 (0.0%) |
| Computers & Mathematics | 15 (100.0%) | 0 (0.0%) |
| Architecture & Engineering | 0 (0.0%) | 0 (0.0%) |
| Life, Physical & Social Science | 0 (0.0%) | 0 (0.0%) |
| Community & Social Service | 5 (6.0%) | 78 (94.0%) |
| Education, Arts & Media | 0 (0.0%) | 9 (100.0%) |
| Legal Services & Support | 0 (0.0%) | 9 (100.0%) |
| Education Instruction & Library | 5 (7.7%) | 60 (92.3%) |
| Arts, Media & Entertainment | 0 (0.0%) | 0 (0.0%) |
| Health Diagnosing & Treating | 0 (0.0%) | 45 (100.0%) |
| Health Technologists | 0 (0.0%) | 19 (100.0%) |
| Total (Category) | 112 (31.5%) | 244 (68.5%) |
| Total (Overall) | 806 (60.5%) | 527 (39.5%) |
Services Occupations
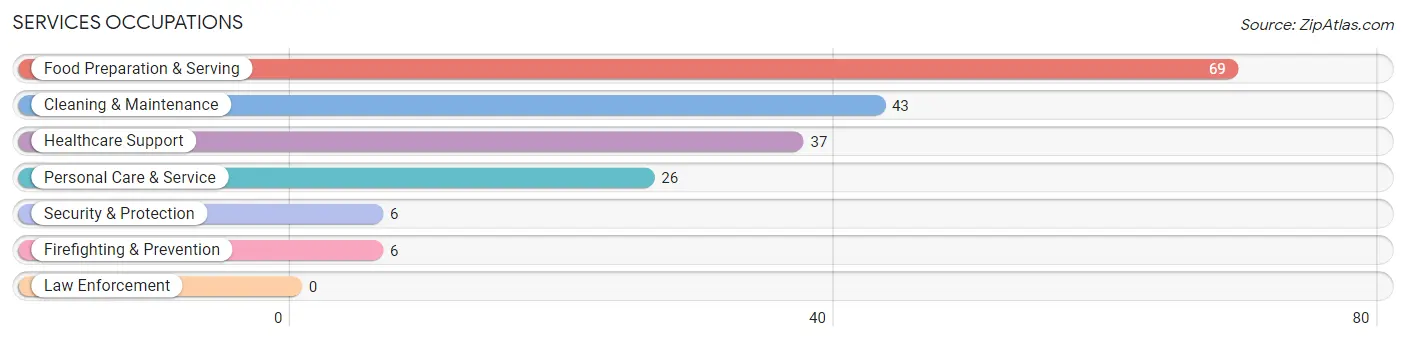
The most common Services occupations in Williamsburg are Food Preparation & Serving (69 | 5.2%), Cleaning & Maintenance (43 | 3.2%), Healthcare Support (37 | 2.8%), Personal Care & Service (26 | 1.9%), and Security & Protection (6 | 0.4%).
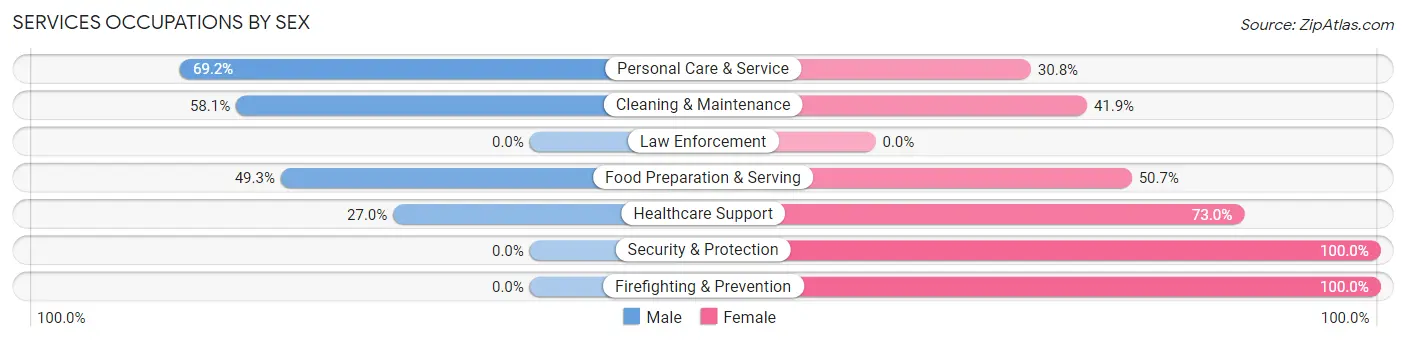
Services Occupations by Sex
Within the Services occupations in Williamsburg, the most male-oriented occupations are Personal Care & Service (69.2%), Cleaning & Maintenance (58.1%), and Food Preparation & Serving (49.3%), while the most female-oriented occupations are Security & Protection (100.0%), Firefighting & Prevention (100.0%), and Healthcare Support (73.0%).
| Occupation | Male | Female |
| Healthcare Support | 10 (27.0%) | 27 (73.0%) |
| Security & Protection | 0 (0.0%) | 6 (100.0%) |
| Firefighting & Prevention | 0 (0.0%) | 6 (100.0%) |
| Law Enforcement | 0 (0.0%) | 0 (0.0%) |
| Food Preparation & Serving | 34 (49.3%) | 35 (50.7%) |
| Cleaning & Maintenance | 25 (58.1%) | 18 (41.9%) |
| Personal Care & Service | 18 (69.2%) | 8 (30.8%) |
| Total (Category) | 87 (48.1%) | 94 (51.9%) |
| Total (Overall) | 806 (60.5%) | 527 (39.5%) |
Sales and Office Occupations
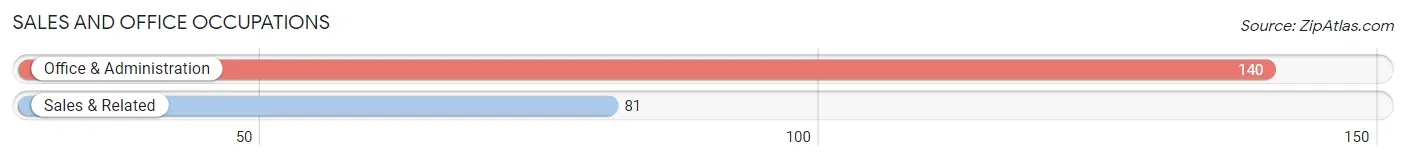
The most common Sales and Office occupations in Williamsburg are Office & Administration (140 | 10.5%), and Sales & Related (81 | 6.1%).
Sales and Office Occupations by Sex
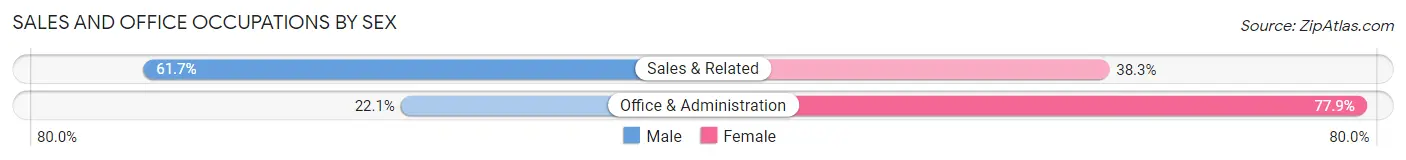
| Occupation | Male | Female |
| Sales & Related | 50 (61.7%) | 31 (38.3%) |
| Office & Administration | 31 (22.1%) | 109 (77.9%) |
| Total (Category) | 81 (36.6%) | 140 (63.3%) |
| Total (Overall) | 806 (60.5%) | 527 (39.5%) |
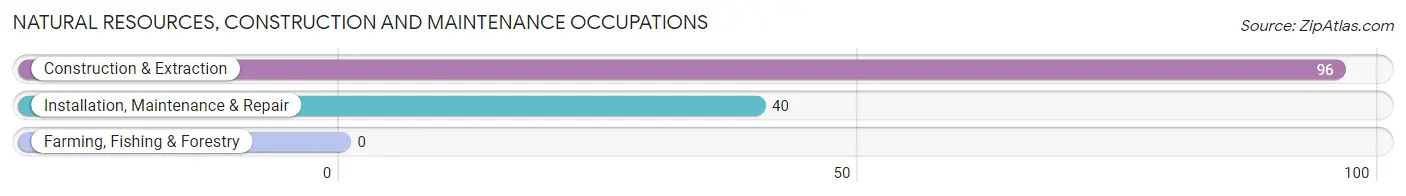
Natural Resources, Construction and Maintenance Occupations
The most common Natural Resources, Construction and Maintenance occupations in Williamsburg are Construction & Extraction (96 | 7.2%), and Installation, Maintenance & Repair (40 | 3.0%).
Natural Resources, Construction and Maintenance Occupations by Sex
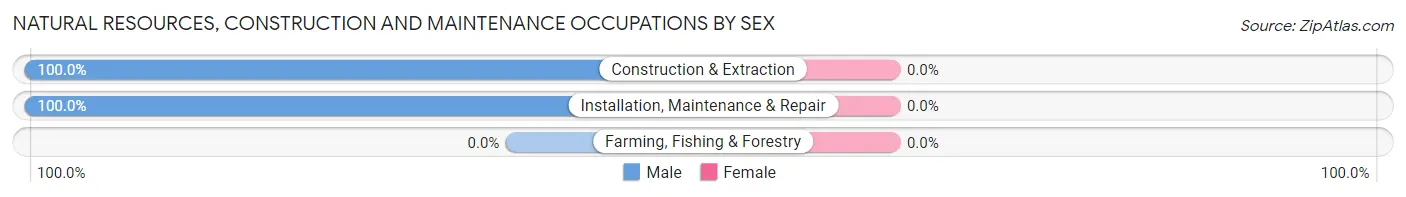
| Occupation | Male | Female |
| Farming, Fishing & Forestry | 0 (0.0%) | 0 (0.0%) |
| Construction & Extraction | 96 (100.0%) | 0 (0.0%) |
| Installation, Maintenance & Repair | 40 (100.0%) | 0 (0.0%) |
| Total (Category) | 136 (100.0%) | 0 (0.0%) |
| Total (Overall) | 806 (60.5%) | 527 (39.5%) |
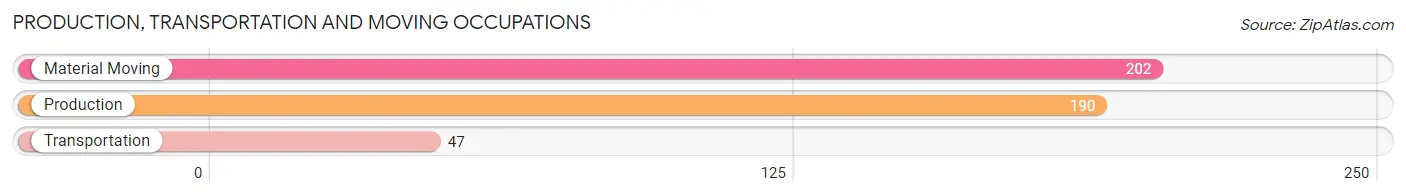
Production, Transportation and Moving Occupations
The most common Production, Transportation and Moving occupations in Williamsburg are Material Moving (202 | 15.1%), Production (190 | 14.2%), and Transportation (47 | 3.5%).
Production, Transportation and Moving Occupations by Sex
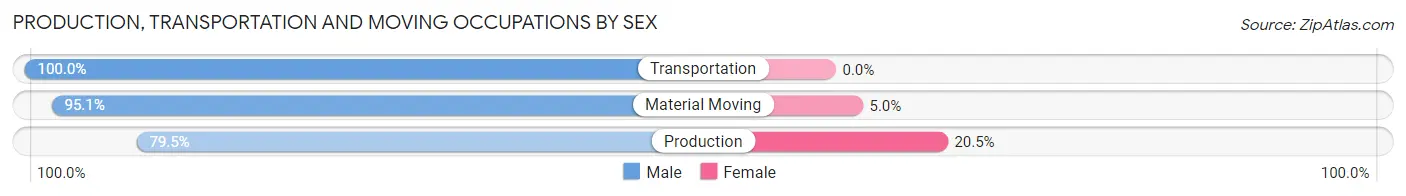
| Occupation | Male | Female |
| Production | 151 (79.5%) | 39 (20.5%) |
| Transportation | 47 (100.0%) | 0 (0.0%) |
| Material Moving | 192 (95.1%) | 10 (5.0%) |
| Total (Category) | 390 (88.8%) | 49 (11.2%) |
| Total (Overall) | 806 (60.5%) | 527 (39.5%) |
Employment Industries by Sex in Williamsburg
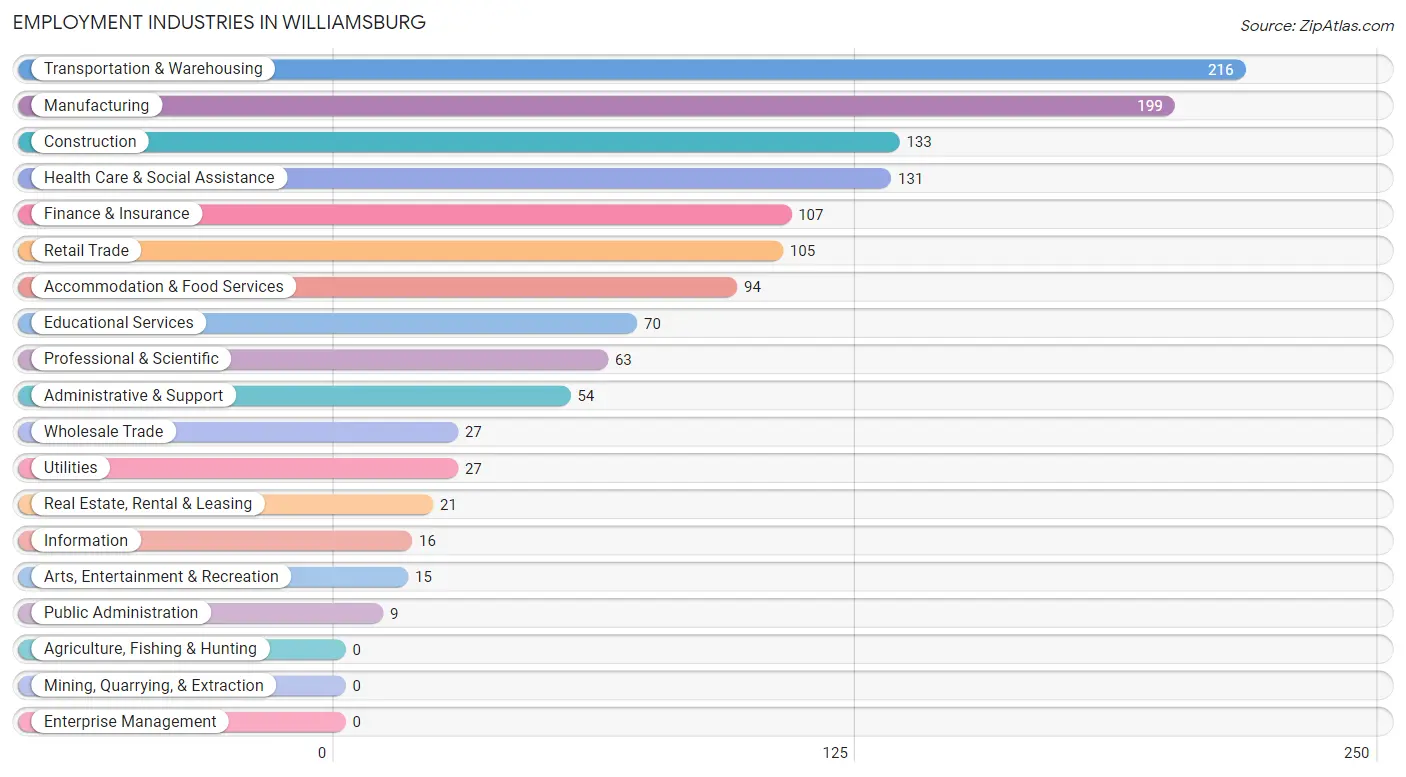
Employment Industries in Williamsburg
The major employment industries in Williamsburg include Transportation & Warehousing (216 | 16.2%), Manufacturing (199 | 14.9%), Construction (133 | 10.0%), Health Care & Social Assistance (131 | 9.8%), and Finance & Insurance (107 | 8.0%).
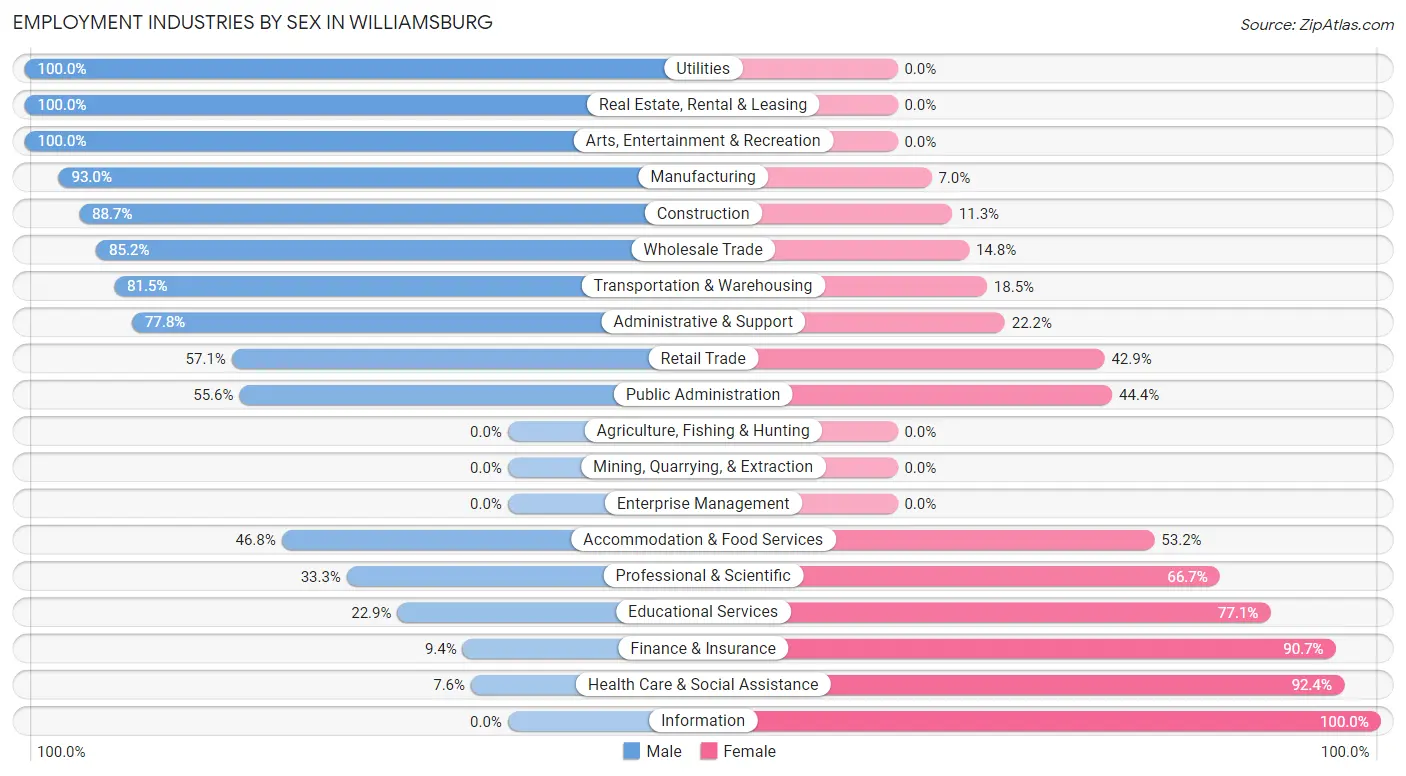
Employment Industries by Sex in Williamsburg
The Williamsburg industries that see more men than women are Utilities (100.0%), Real Estate, Rental & Leasing (100.0%), and Arts, Entertainment & Recreation (100.0%), whereas the industries that tend to have a higher number of women are Information (100.0%), Health Care & Social Assistance (92.4%), and Finance & Insurance (90.6%).
| Industry | Male | Female |
| Agriculture, Fishing & Hunting | 0 (0.0%) | 0 (0.0%) |
| Mining, Quarrying, & Extraction | 0 (0.0%) | 0 (0.0%) |
| Construction | 118 (88.7%) | 15 (11.3%) |
| Manufacturing | 185 (93.0%) | 14 (7.0%) |
| Wholesale Trade | 23 (85.2%) | 4 (14.8%) |
| Retail Trade | 60 (57.1%) | 45 (42.9%) |
| Transportation & Warehousing | 176 (81.5%) | 40 (18.5%) |
| Utilities | 27 (100.0%) | 0 (0.0%) |
| Information | 0 (0.0%) | 16 (100.0%) |
| Finance & Insurance | 10 (9.3%) | 97 (90.6%) |
| Real Estate, Rental & Leasing | 21 (100.0%) | 0 (0.0%) |
| Professional & Scientific | 21 (33.3%) | 42 (66.7%) |
| Enterprise Management | 0 (0.0%) | 0 (0.0%) |
| Administrative & Support | 42 (77.8%) | 12 (22.2%) |
| Educational Services | 16 (22.9%) | 54 (77.1%) |
| Health Care & Social Assistance | 10 (7.6%) | 121 (92.4%) |
| Arts, Entertainment & Recreation | 15 (100.0%) | 0 (0.0%) |
| Accommodation & Food Services | 44 (46.8%) | 50 (53.2%) |
| Public Administration | 5 (55.6%) | 4 (44.4%) |
| Total | 806 (60.5%) | 527 (39.5%) |
Education in Williamsburg
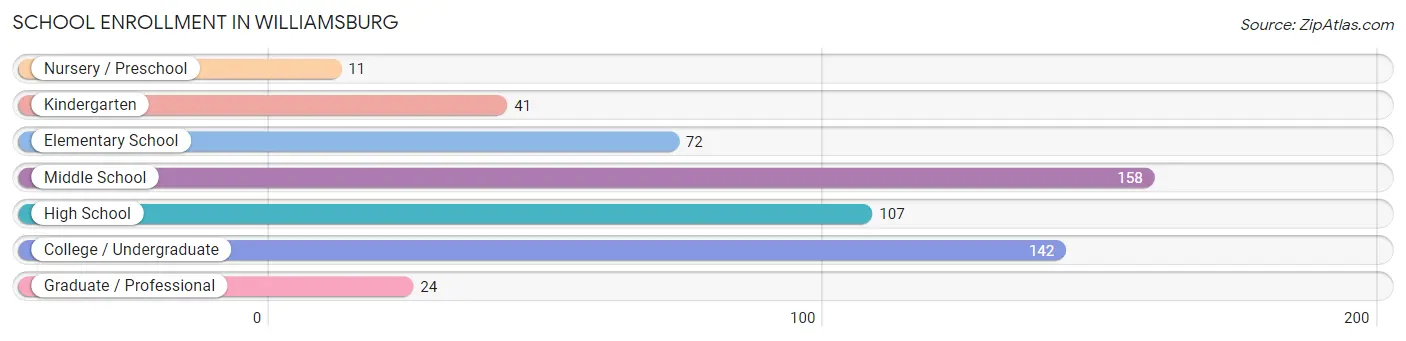
School Enrollment in Williamsburg
The most common levels of schooling among the 555 students in Williamsburg are middle school (158 | 28.5%), college / undergraduate (142 | 25.6%), and high school (107 | 19.3%).
| School Level | # Students | % Students |
| Nursery / Preschool | 11 | 2.0% |
| Kindergarten | 41 | 7.4% |
| Elementary School | 72 | 13.0% |
| Middle School | 158 | 28.5% |
| High School | 107 | 19.3% |
| College / Undergraduate | 142 | 25.6% |
| Graduate / Professional | 24 | 4.3% |
| Total | 555 | 100.0% |
School Enrollment by Age by Funding Source in Williamsburg
Out of a total of 555 students who are enrolled in schools in Williamsburg, 90 (16.2%) attend a private institution, while the remaining 465 (83.8%) are enrolled in public schools. The age group of 25 to 34 year olds has the highest likelihood of being enrolled in private schools, with 6 (100.0% in the age bracket) enrolled. Conversely, the age group of 10 to 14 year olds has the lowest likelihood of being enrolled in a private school, with 168 (100.0% in the age bracket) attending a public institution.
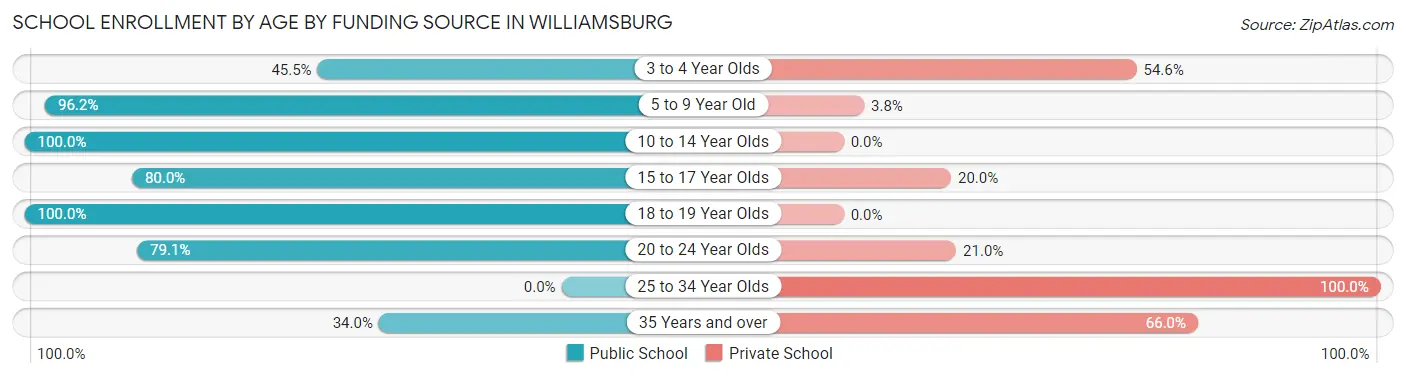
| Age Bracket | Public School | Private School |
| 3 to 4 Year Olds | 5 (45.5%) | 6 (54.5%) |
| 5 to 9 Year Old | 101 (96.2%) | 4 (3.8%) |
| 10 to 14 Year Olds | 168 (100.0%) | 0 (0.0%) |
| 15 to 17 Year Olds | 84 (80.0%) | 21 (20.0%) |
| 18 to 19 Year Olds | 8 (100.0%) | 0 (0.0%) |
| 20 to 24 Year Olds | 83 (79.0%) | 22 (20.9%) |
| 25 to 34 Year Olds | 0 (0.0%) | 6 (100.0%) |
| 35 Years and over | 16 (34.0%) | 31 (66.0%) |
| Total | 465 (83.8%) | 90 (16.2%) |
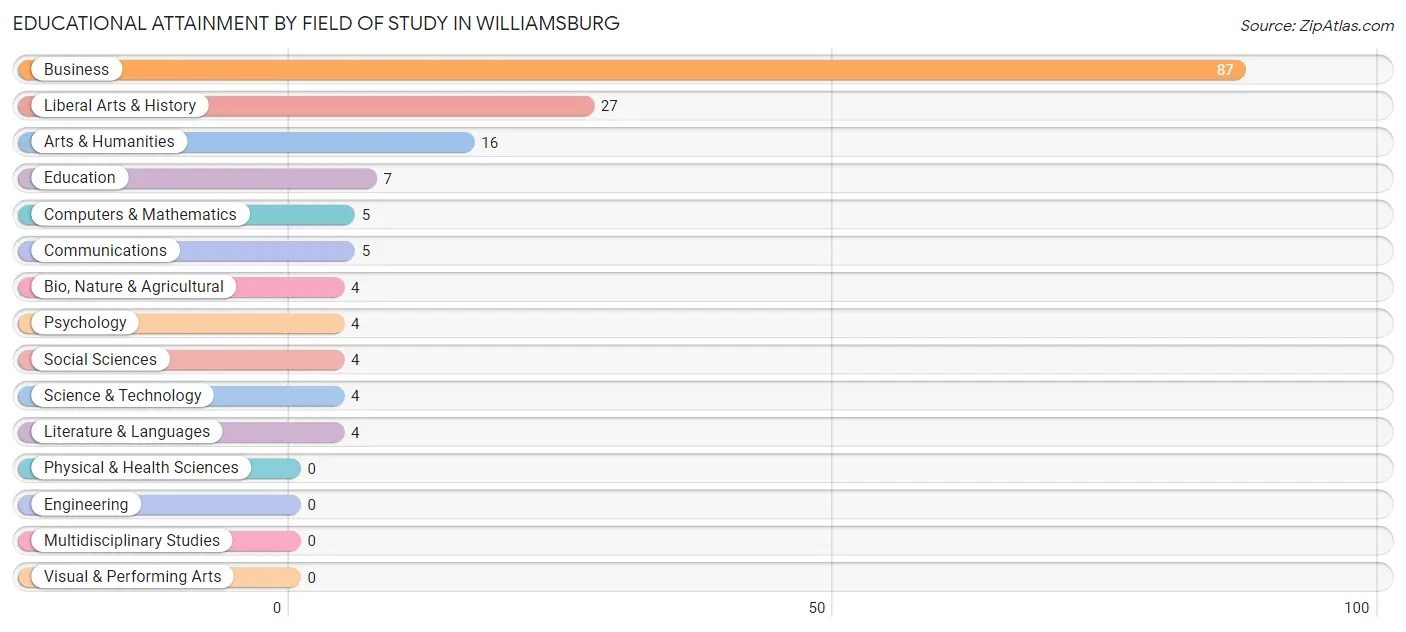
Educational Attainment by Field of Study in Williamsburg
Business (87 | 52.1%), liberal arts & history (27 | 16.2%), arts & humanities (16 | 9.6%), education (7 | 4.2%), and computers & mathematics (5 | 3.0%) are the most common fields of study among 167 individuals in Williamsburg who have obtained a bachelor's degree or higher.
| Field of Study | # Graduates | % Graduates |
| Computers & Mathematics | 5 | 3.0% |
| Bio, Nature & Agricultural | 4 | 2.4% |
| Physical & Health Sciences | 0 | 0.0% |
| Psychology | 4 | 2.4% |
| Social Sciences | 4 | 2.4% |
| Engineering | 0 | 0.0% |
| Multidisciplinary Studies | 0 | 0.0% |
| Science & Technology | 4 | 2.4% |
| Business | 87 | 52.1% |
| Education | 7 | 4.2% |
| Literature & Languages | 4 | 2.4% |
| Liberal Arts & History | 27 | 16.2% |
| Visual & Performing Arts | 0 | 0.0% |
| Communications | 5 | 3.0% |
| Arts & Humanities | 16 | 9.6% |
| Total | 167 | 100.0% |
Transportation & Commute in Williamsburg
Vehicle Availability by Sex in Williamsburg
The most prevalent vehicle ownership categories in Williamsburg are males with 2 vehicles (367, accounting for 45.9%) and females with 2 vehicles (198, making up 69.6%).
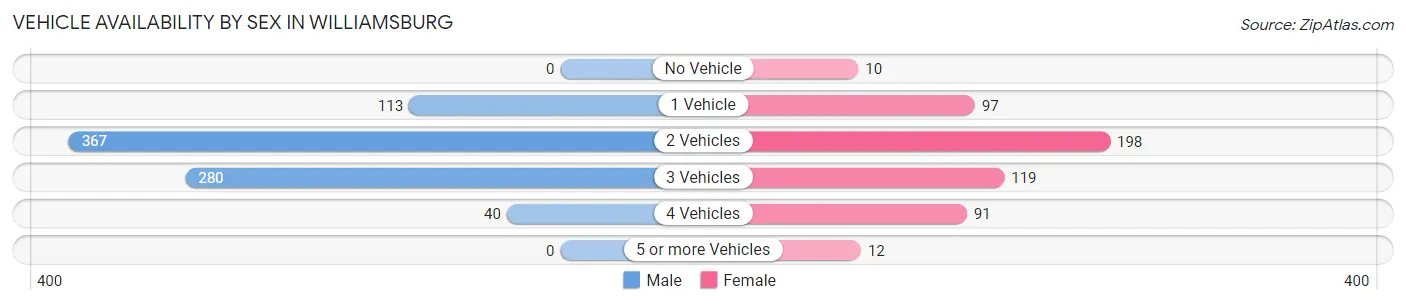
| Vehicles Available | Male | Female |
| No Vehicle | 0 (0.0%) | 10 (1.9%) |
| 1 Vehicle | 113 (14.1%) | 97 (18.4%) |
| 2 Vehicles | 367 (45.9%) | 198 (37.6%) |
| 3 Vehicles | 280 (35.0%) | 119 (22.6%) |
| 4 Vehicles | 40 (5.0%) | 91 (17.3%) |
| 5 or more Vehicles | 0 (0.0%) | 12 (2.3%) |
| Total | 800 (100.0%) | 527 (100.0%) |
Commute Time in Williamsburg
The most frequently occuring commute durations in Williamsburg are 15 to 19 minutes (315 commuters, 24.1%), 20 to 24 minutes (173 commuters, 13.3%), and 45 to 59 minutes (156 commuters, 11.9%).
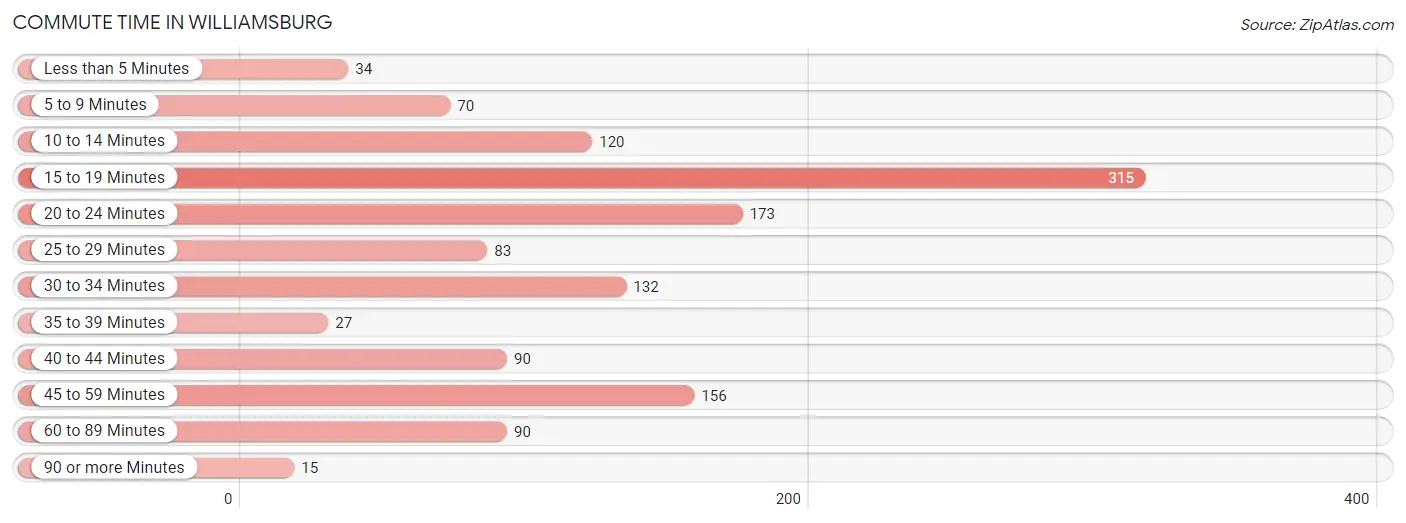
| Commute Time | # Commuters | % Commuters |
| Less than 5 Minutes | 34 | 2.6% |
| 5 to 9 Minutes | 70 | 5.4% |
| 10 to 14 Minutes | 120 | 9.2% |
| 15 to 19 Minutes | 315 | 24.1% |
| 20 to 24 Minutes | 173 | 13.3% |
| 25 to 29 Minutes | 83 | 6.4% |
| 30 to 34 Minutes | 132 | 10.1% |
| 35 to 39 Minutes | 27 | 2.1% |
| 40 to 44 Minutes | 90 | 6.9% |
| 45 to 59 Minutes | 156 | 11.9% |
| 60 to 89 Minutes | 90 | 6.9% |
| 90 or more Minutes | 15 | 1.1% |
Commute Time by Sex in Williamsburg
The most common commute times in Williamsburg are 15 to 19 minutes (234 commuters, 29.7%) for males and 30 to 34 minutes (89 commuters, 17.2%) for females.
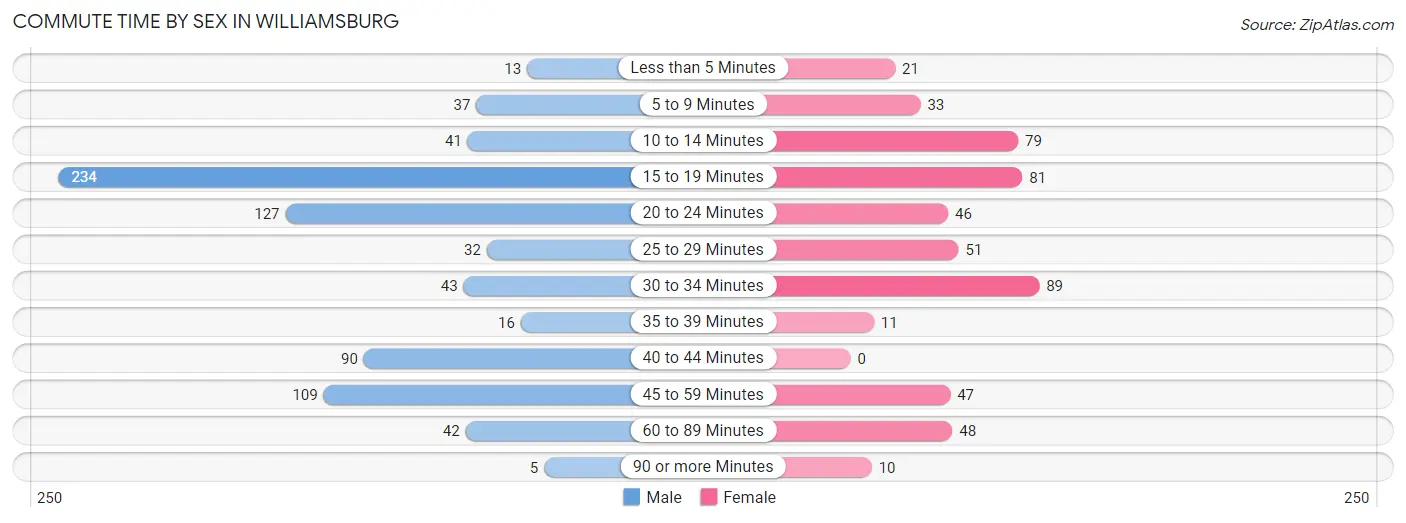
| Commute Time | Male | Female |
| Less than 5 Minutes | 13 (1.7%) | 21 (4.1%) |
| 5 to 9 Minutes | 37 (4.7%) | 33 (6.4%) |
| 10 to 14 Minutes | 41 (5.2%) | 79 (15.3%) |
| 15 to 19 Minutes | 234 (29.7%) | 81 (15.7%) |
| 20 to 24 Minutes | 127 (16.1%) | 46 (8.9%) |
| 25 to 29 Minutes | 32 (4.1%) | 51 (9.9%) |
| 30 to 34 Minutes | 43 (5.4%) | 89 (17.2%) |
| 35 to 39 Minutes | 16 (2.0%) | 11 (2.1%) |
| 40 to 44 Minutes | 90 (11.4%) | 0 (0.0%) |
| 45 to 59 Minutes | 109 (13.8%) | 47 (9.1%) |
| 60 to 89 Minutes | 42 (5.3%) | 48 (9.3%) |
| 90 or more Minutes | 5 (0.6%) | 10 (1.9%) |
Time of Departure to Work by Sex in Williamsburg
The most frequent times of departure to work in Williamsburg are 12:00 PM to 3:59 PM (171, 21.7%) for males and 6:30 AM to 6:59 AM (112, 21.7%) for females.
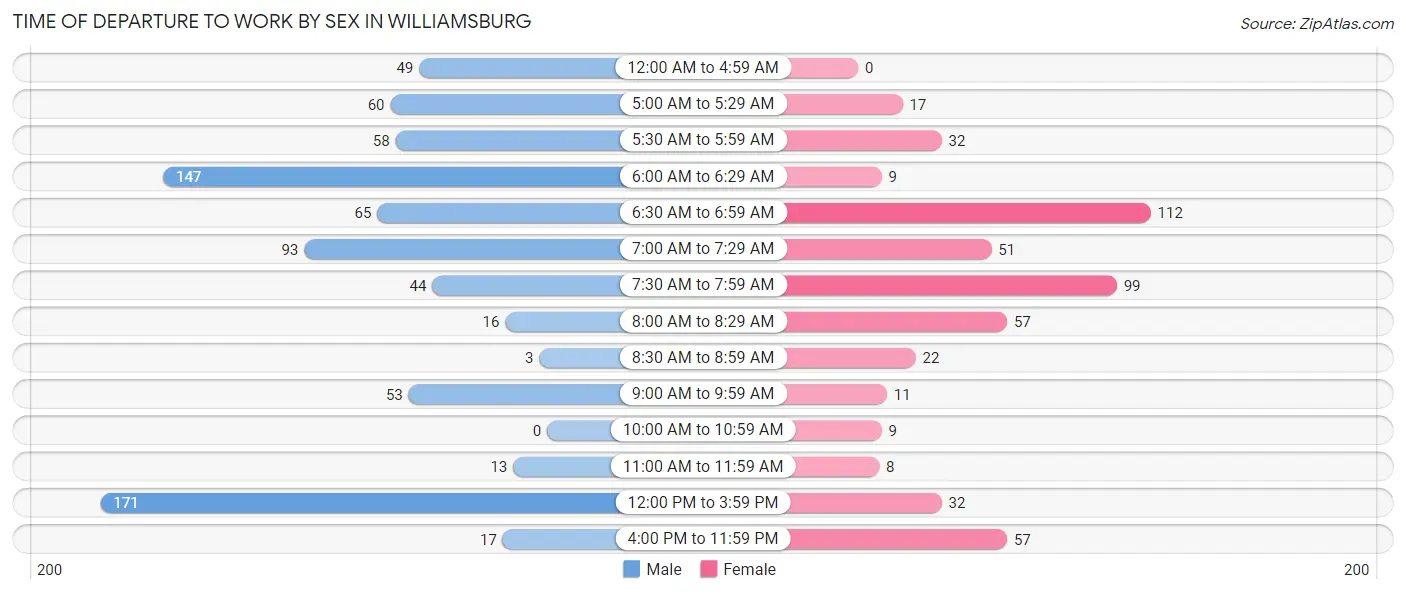
| Time of Departure | Male | Female |
| 12:00 AM to 4:59 AM | 49 (6.2%) | 0 (0.0%) |
| 5:00 AM to 5:29 AM | 60 (7.6%) | 17 (3.3%) |
| 5:30 AM to 5:59 AM | 58 (7.3%) | 32 (6.2%) |
| 6:00 AM to 6:29 AM | 147 (18.6%) | 9 (1.7%) |
| 6:30 AM to 6:59 AM | 65 (8.2%) | 112 (21.7%) |
| 7:00 AM to 7:29 AM | 93 (11.8%) | 51 (9.9%) |
| 7:30 AM to 7:59 AM | 44 (5.6%) | 99 (19.2%) |
| 8:00 AM to 8:29 AM | 16 (2.0%) | 57 (11.1%) |
| 8:30 AM to 8:59 AM | 3 (0.4%) | 22 (4.3%) |
| 9:00 AM to 9:59 AM | 53 (6.7%) | 11 (2.1%) |
| 10:00 AM to 10:59 AM | 0 (0.0%) | 9 (1.7%) |
| 11:00 AM to 11:59 AM | 13 (1.7%) | 8 (1.5%) |
| 12:00 PM to 3:59 PM | 171 (21.7%) | 32 (6.2%) |
| 4:00 PM to 11:59 PM | 17 (2.1%) | 57 (11.1%) |
| Total | 789 (100.0%) | 516 (100.0%) |
Housing Occupancy in Williamsburg
Occupancy by Ownership in Williamsburg
Of the total 986 dwellings in Williamsburg, owner-occupied units account for 597 (60.6%), while renter-occupied units make up 389 (39.5%).
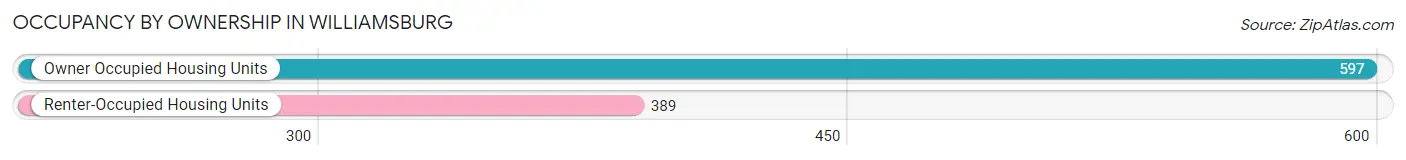
| Occupancy | # Housing Units | % Housing Units |
| Owner Occupied Housing Units | 597 | 60.6% |
| Renter-Occupied Housing Units | 389 | 39.5% |
| Total Occupied Housing Units | 986 | 100.0% |
Occupancy by Household Size in Williamsburg
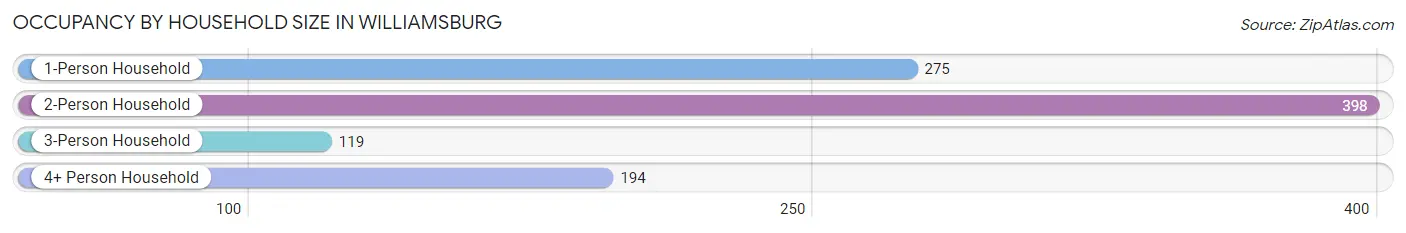
| Household Size | # Housing Units | % Housing Units |
| 1-Person Household | 275 | 27.9% |
| 2-Person Household | 398 | 40.4% |
| 3-Person Household | 119 | 12.1% |
| 4+ Person Household | 194 | 19.7% |
| Total Housing Units | 986 | 100.0% |
Occupancy by Ownership by Household Size in Williamsburg
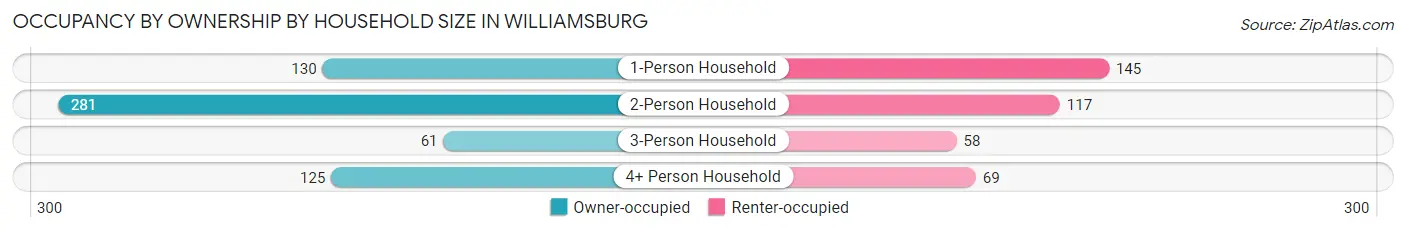
| Household Size | Owner-occupied | Renter-occupied |
| 1-Person Household | 130 (47.3%) | 145 (52.7%) |
| 2-Person Household | 281 (70.6%) | 117 (29.4%) |
| 3-Person Household | 61 (51.3%) | 58 (48.7%) |
| 4+ Person Household | 125 (64.4%) | 69 (35.6%) |
| Total Housing Units | 597 (60.6%) | 389 (39.5%) |
Occupancy by Educational Attainment in Williamsburg
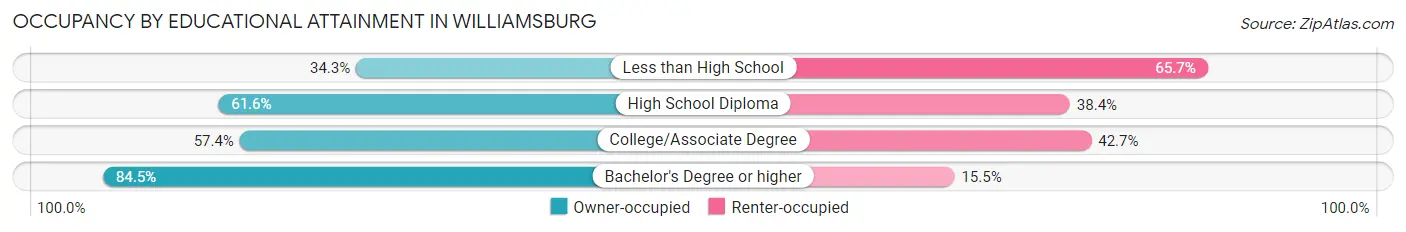
| Household Size | Owner-occupied | Renter-occupied |
| Less than High School | 24 (34.3%) | 46 (65.7%) |
| High School Diploma | 287 (61.6%) | 179 (38.4%) |
| College/Associate Degree | 199 (57.4%) | 148 (42.6%) |
| Bachelor's Degree or higher | 87 (84.5%) | 16 (15.5%) |
Occupancy by Age of Householder in Williamsburg
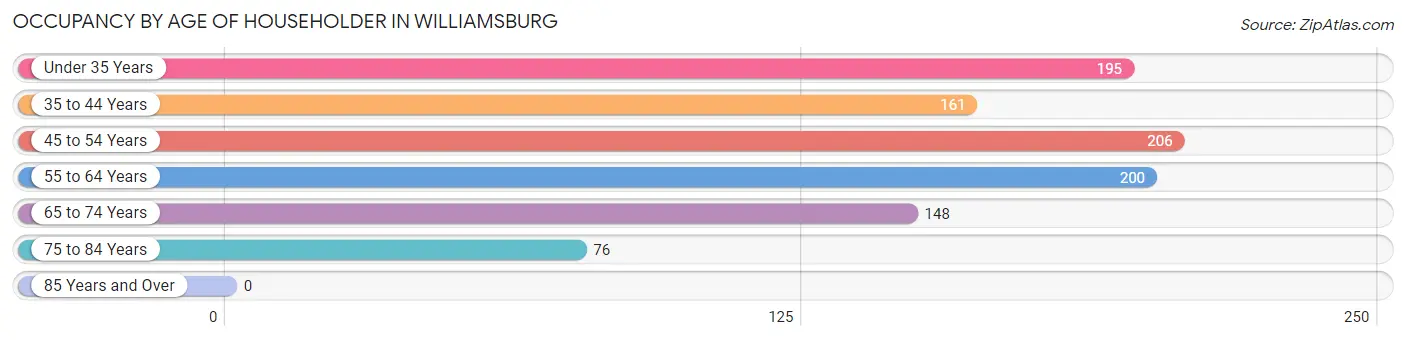
| Age Bracket | # Households | % Households |
| Under 35 Years | 195 | 19.8% |
| 35 to 44 Years | 161 | 16.3% |
| 45 to 54 Years | 206 | 20.9% |
| 55 to 64 Years | 200 | 20.3% |
| 65 to 74 Years | 148 | 15.0% |
| 75 to 84 Years | 76 | 7.7% |
| 85 Years and Over | 0 | 0.0% |
| Total | 986 | 100.0% |
Housing Finances in Williamsburg
Median Income by Occupancy in Williamsburg
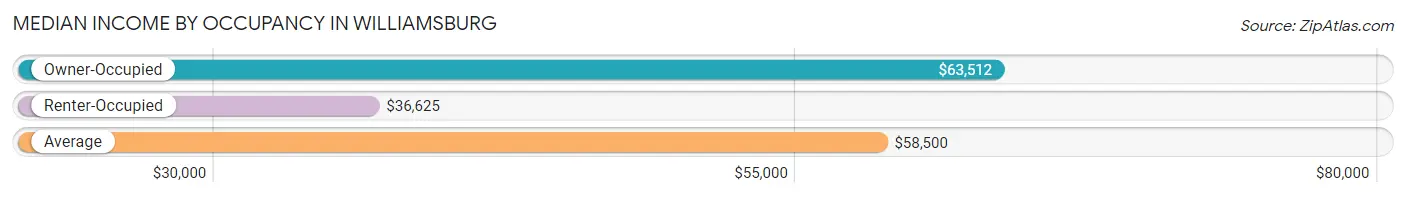
| Occupancy Type | # Households | Median Income |
| Owner-Occupied | 597 (60.6%) | $63,512 |
| Renter-Occupied | 389 (39.5%) | $36,625 |
| Average | 986 (100.0%) | $58,500 |
Occupancy by Householder Income Bracket in Williamsburg
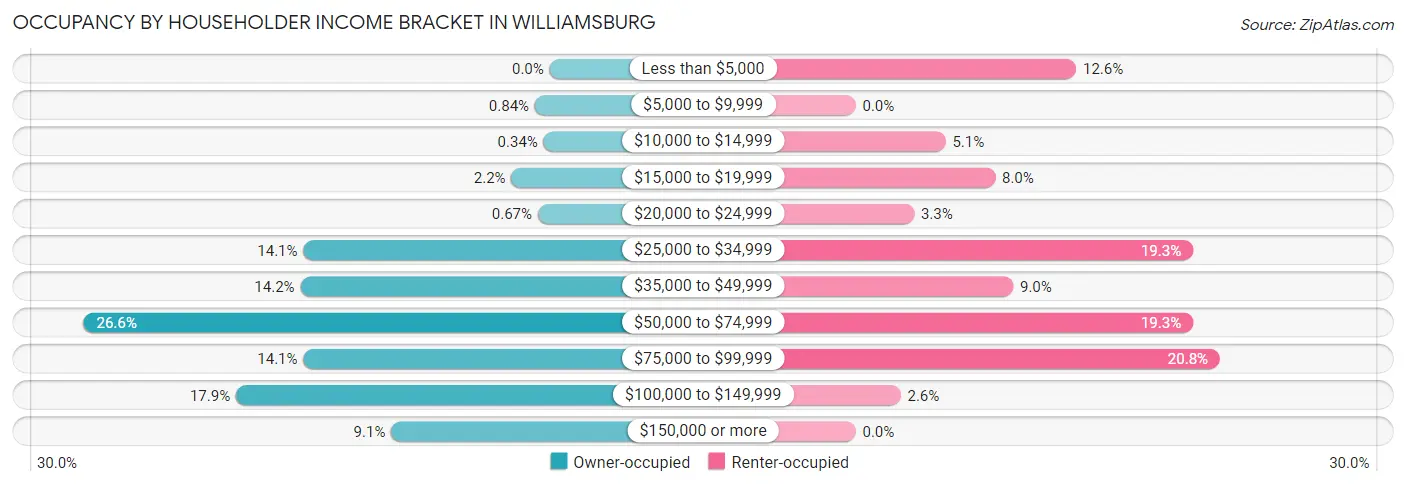
| Income Bracket | Owner-occupied | Renter-occupied |
| Less than $5,000 | 0 (0.0%) | 49 (12.6%) |
| $5,000 to $9,999 | 5 (0.8%) | 0 (0.0%) |
| $10,000 to $14,999 | 2 (0.3%) | 20 (5.1%) |
| $15,000 to $19,999 | 13 (2.2%) | 31 (8.0%) |
| $20,000 to $24,999 | 4 (0.7%) | 13 (3.3%) |
| $25,000 to $34,999 | 84 (14.1%) | 75 (19.3%) |
| $35,000 to $49,999 | 85 (14.2%) | 35 (9.0%) |
| $50,000 to $74,999 | 159 (26.6%) | 75 (19.3%) |
| $75,000 to $99,999 | 84 (14.1%) | 81 (20.8%) |
| $100,000 to $149,999 | 107 (17.9%) | 10 (2.6%) |
| $150,000 or more | 54 (9.0%) | 0 (0.0%) |
| Total | 597 (100.0%) | 389 (100.0%) |
Monthly Housing Cost Tiers in Williamsburg
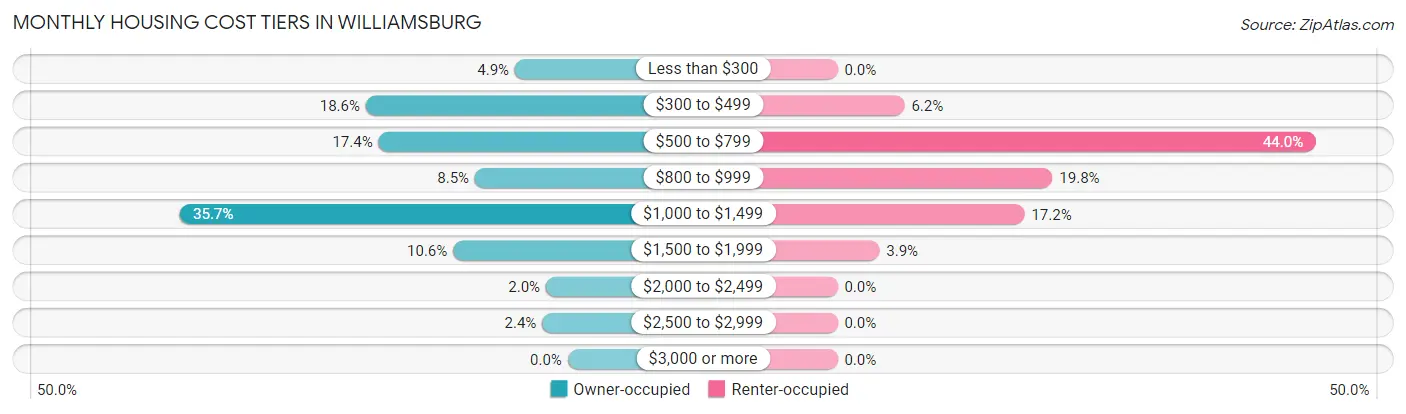
| Monthly Cost | Owner-occupied | Renter-occupied |
| Less than $300 | 29 (4.9%) | 0 (0.0%) |
| $300 to $499 | 111 (18.6%) | 24 (6.2%) |
| $500 to $799 | 104 (17.4%) | 171 (44.0%) |
| $800 to $999 | 51 (8.5%) | 77 (19.8%) |
| $1,000 to $1,499 | 213 (35.7%) | 67 (17.2%) |
| $1,500 to $1,999 | 63 (10.5%) | 15 (3.9%) |
| $2,000 to $2,499 | 12 (2.0%) | 0 (0.0%) |
| $2,500 to $2,999 | 14 (2.4%) | 0 (0.0%) |
| $3,000 or more | 0 (0.0%) | 0 (0.0%) |
| Total | 597 (100.0%) | 389 (100.0%) |
Physical Housing Characteristics in Williamsburg
Housing Structures in Williamsburg
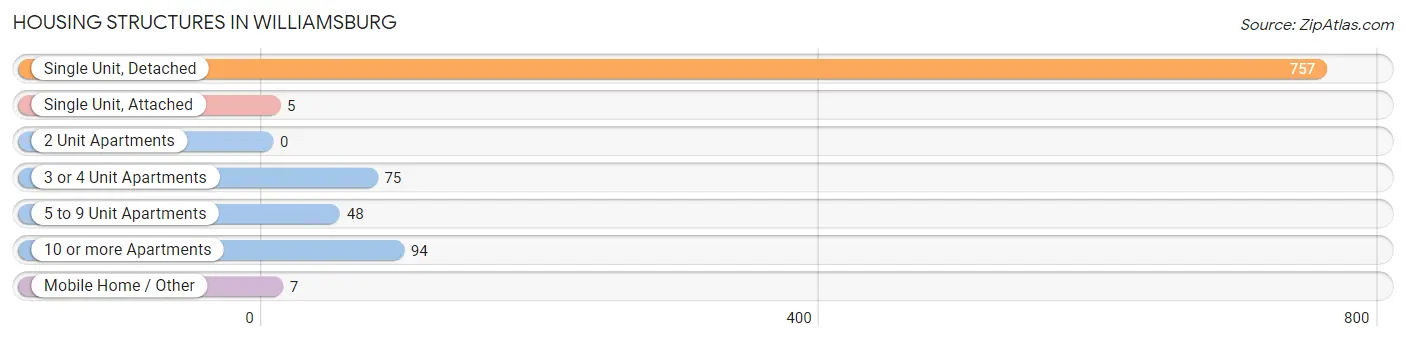
| Structure Type | # Housing Units | % Housing Units |
| Single Unit, Detached | 757 | 76.8% |
| Single Unit, Attached | 5 | 0.5% |
| 2 Unit Apartments | 0 | 0.0% |
| 3 or 4 Unit Apartments | 75 | 7.6% |
| 5 to 9 Unit Apartments | 48 | 4.9% |
| 10 or more Apartments | 94 | 9.5% |
| Mobile Home / Other | 7 | 0.7% |
| Total | 986 | 100.0% |
Housing Structures by Occupancy in Williamsburg
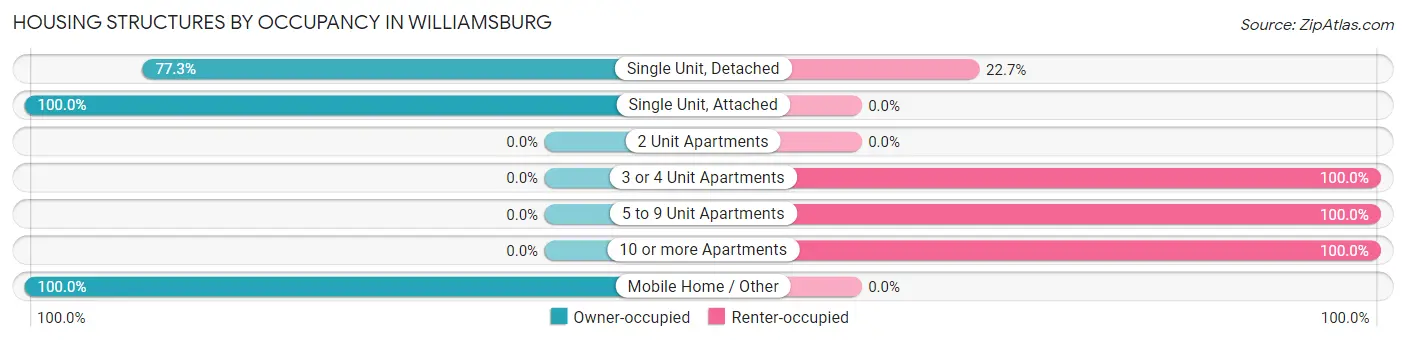
| Structure Type | Owner-occupied | Renter-occupied |
| Single Unit, Detached | 585 (77.3%) | 172 (22.7%) |
| Single Unit, Attached | 5 (100.0%) | 0 (0.0%) |
| 2 Unit Apartments | 0 (0.0%) | 0 (0.0%) |
| 3 or 4 Unit Apartments | 0 (0.0%) | 75 (100.0%) |
| 5 to 9 Unit Apartments | 0 (0.0%) | 48 (100.0%) |
| 10 or more Apartments | 0 (0.0%) | 94 (100.0%) |
| Mobile Home / Other | 7 (100.0%) | 0 (0.0%) |
| Total | 597 (60.6%) | 389 (39.5%) |
Housing Structures by Number of Rooms in Williamsburg
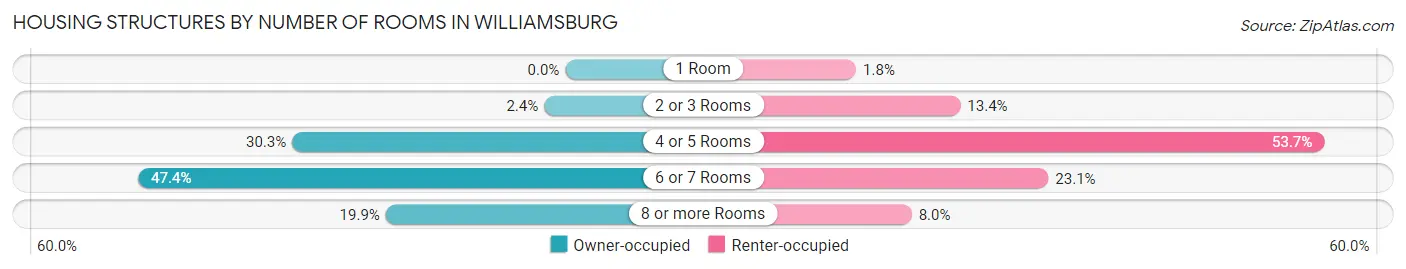
| Number of Rooms | Owner-occupied | Renter-occupied |
| 1 Room | 0 (0.0%) | 7 (1.8%) |
| 2 or 3 Rooms | 14 (2.4%) | 52 (13.4%) |
| 4 or 5 Rooms | 181 (30.3%) | 209 (53.7%) |
| 6 or 7 Rooms | 283 (47.4%) | 90 (23.1%) |
| 8 or more Rooms | 119 (19.9%) | 31 (8.0%) |
| Total | 597 (100.0%) | 389 (100.0%) |
Housing Structure by Heating Type in Williamsburg
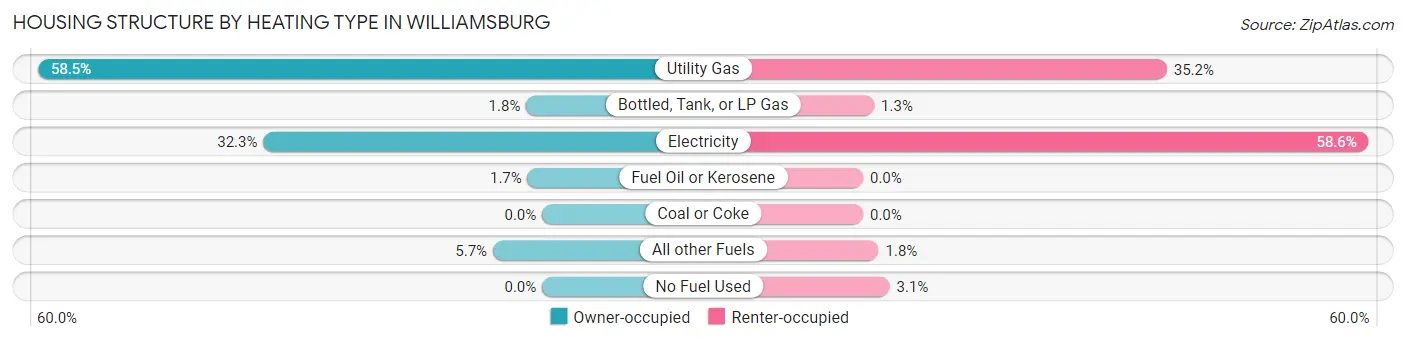
| Heating Type | Owner-occupied | Renter-occupied |
| Utility Gas | 349 (58.5%) | 137 (35.2%) |
| Bottled, Tank, or LP Gas | 11 (1.8%) | 5 (1.3%) |
| Electricity | 193 (32.3%) | 228 (58.6%) |
| Fuel Oil or Kerosene | 10 (1.7%) | 0 (0.0%) |
| Coal or Coke | 0 (0.0%) | 0 (0.0%) |
| All other Fuels | 34 (5.7%) | 7 (1.8%) |
| No Fuel Used | 0 (0.0%) | 12 (3.1%) |
| Total | 597 (100.0%) | 389 (100.0%) |
Household Vehicle Usage in Williamsburg
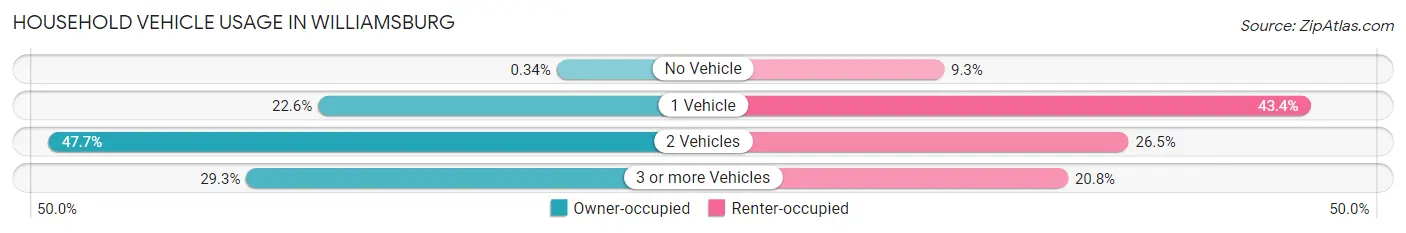
| Vehicles per Household | Owner-occupied | Renter-occupied |
| No Vehicle | 2 (0.3%) | 36 (9.2%) |
| 1 Vehicle | 135 (22.6%) | 169 (43.4%) |
| 2 Vehicles | 285 (47.7%) | 103 (26.5%) |
| 3 or more Vehicles | 175 (29.3%) | 81 (20.8%) |
| Total | 597 (100.0%) | 389 (100.0%) |
Real Estate & Mortgages in Williamsburg
Real Estate and Mortgage Overview in Williamsburg
| Characteristic | Without Mortgage | With Mortgage |
| Housing Units | 219 | 378 |
| Median Property Value | $95,200 | $169,600 |
| Median Household Income | $55,036 | $42 |
| Monthly Housing Costs | $394 | $0 |
| Real Estate Taxes | $921 | $24 |
Property Value by Mortgage Status in Williamsburg
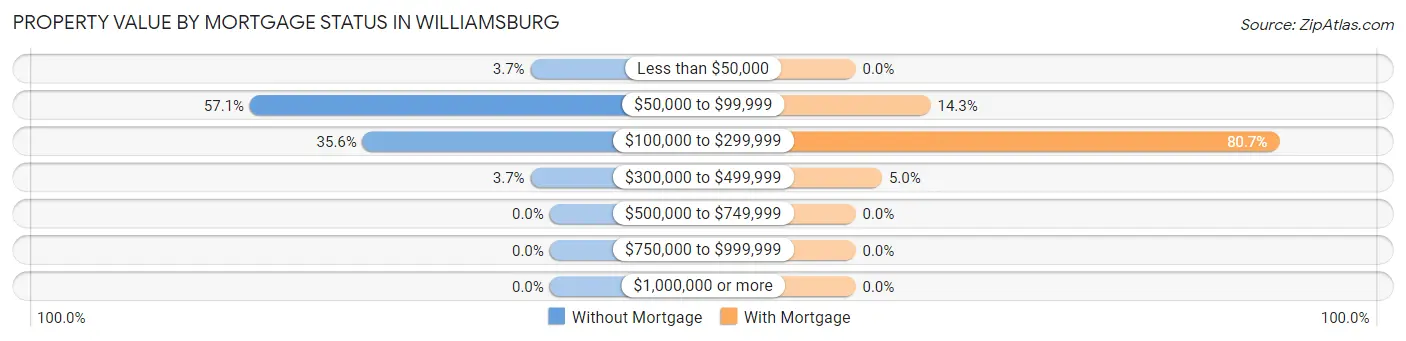
| Property Value | Without Mortgage | With Mortgage |
| Less than $50,000 | 8 (3.6%) | 0 (0.0%) |
| $50,000 to $99,999 | 125 (57.1%) | 54 (14.3%) |
| $100,000 to $299,999 | 78 (35.6%) | 305 (80.7%) |
| $300,000 to $499,999 | 8 (3.6%) | 19 (5.0%) |
| $500,000 to $749,999 | 0 (0.0%) | 0 (0.0%) |
| $750,000 to $999,999 | 0 (0.0%) | 0 (0.0%) |
| $1,000,000 or more | 0 (0.0%) | 0 (0.0%) |
| Total | 219 (100.0%) | 378 (100.0%) |
Household Income by Mortgage Status in Williamsburg
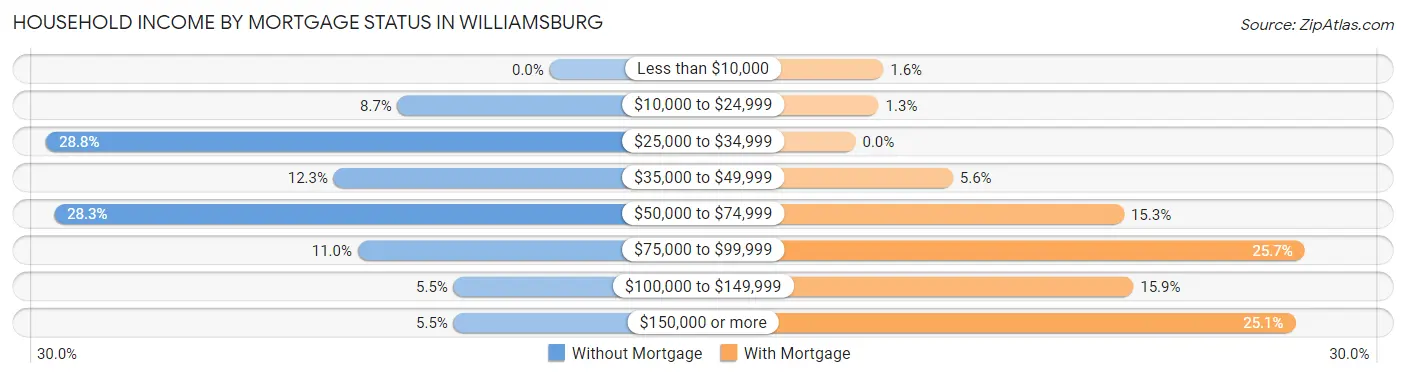
| Household Income | Without Mortgage | With Mortgage |
| Less than $10,000 | 0 (0.0%) | 6 (1.6%) |
| $10,000 to $24,999 | 19 (8.7%) | 5 (1.3%) |
| $25,000 to $34,999 | 63 (28.8%) | 0 (0.0%) |
| $35,000 to $49,999 | 27 (12.3%) | 21 (5.6%) |
| $50,000 to $74,999 | 62 (28.3%) | 58 (15.3%) |
| $75,000 to $99,999 | 24 (11.0%) | 97 (25.7%) |
| $100,000 to $149,999 | 12 (5.5%) | 60 (15.9%) |
| $150,000 or more | 12 (5.5%) | 95 (25.1%) |
| Total | 219 (100.0%) | 378 (100.0%) |
Property Value to Household Income Ratio in Williamsburg
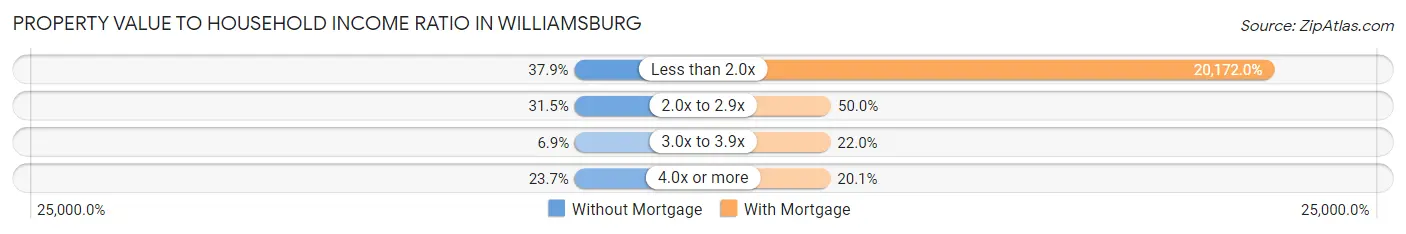
| Value-to-Income Ratio | Without Mortgage | With Mortgage |
| Less than 2.0x | 83 (37.9%) | 76,250 (20,172.0%) |
| 2.0x to 2.9x | 69 (31.5%) | 189 (50.0%) |
| 3.0x to 3.9x | 15 (6.9%) | 83 (22.0%) |
| 4.0x or more | 52 (23.7%) | 76 (20.1%) |
| Total | 219 (100.0%) | 378 (100.0%) |
Real Estate Taxes by Mortgage Status in Williamsburg
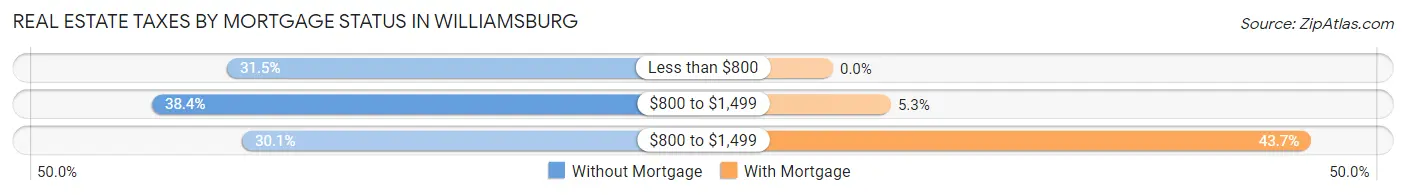
| Property Taxes | Without Mortgage | With Mortgage |
| Less than $800 | 69 (31.5%) | 0 (0.0%) |
| $800 to $1,499 | 84 (38.4%) | 20 (5.3%) |
| $800 to $1,499 | 66 (30.1%) | 165 (43.6%) |
| Total | 219 (100.0%) | 378 (100.0%) |
Health & Disability in Williamsburg
Health Insurance Coverage by Age in Williamsburg
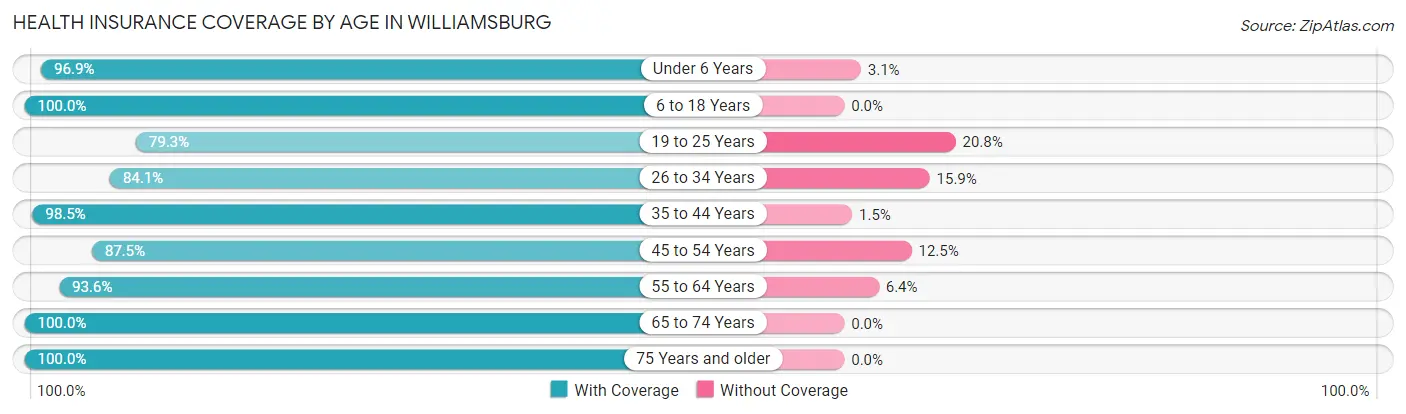
| Age Bracket | With Coverage | Without Coverage |
| Under 6 Years | 157 (96.9%) | 5 (3.1%) |
| 6 to 18 Years | 342 (100.0%) | 0 (0.0%) |
| 19 to 25 Years | 317 (79.2%) | 83 (20.7%) |
| 26 to 34 Years | 296 (84.1%) | 56 (15.9%) |
| 35 to 44 Years | 337 (98.5%) | 5 (1.5%) |
| 45 to 54 Years | 265 (87.5%) | 38 (12.5%) |
| 55 to 64 Years | 320 (93.6%) | 22 (6.4%) |
| 65 to 74 Years | 224 (100.0%) | 0 (0.0%) |
| 75 Years and older | 116 (100.0%) | 0 (0.0%) |
| Total | 2,374 (91.9%) | 209 (8.1%) |
Health Insurance Coverage by Citizenship Status in Williamsburg
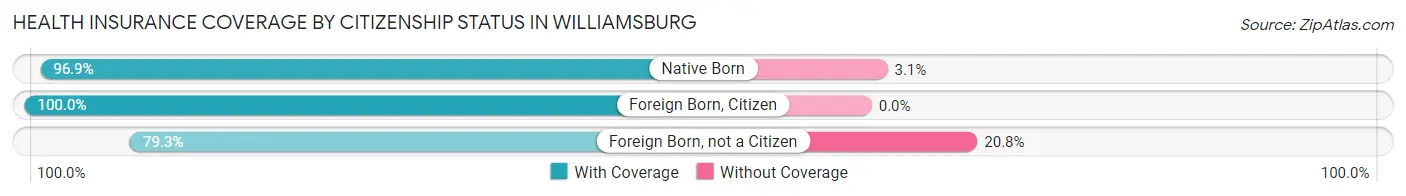
| Citizenship Status | With Coverage | Without Coverage |
| Native Born | 157 (96.9%) | 5 (3.1%) |
| Foreign Born, Citizen | 342 (100.0%) | 0 (0.0%) |
| Foreign Born, not a Citizen | 317 (79.2%) | 83 (20.7%) |
Health Insurance Coverage by Household Income in Williamsburg
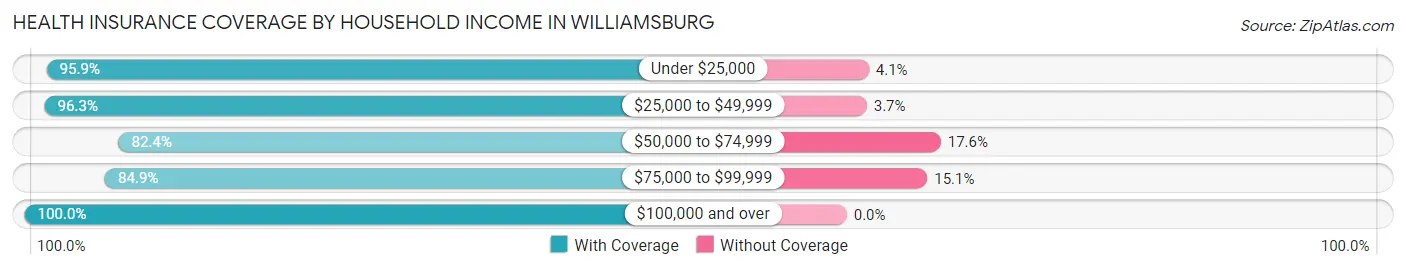
| Household Income | With Coverage | Without Coverage |
| Under $25,000 | 209 (95.9%) | 9 (4.1%) |
| $25,000 to $49,999 | 618 (96.3%) | 24 (3.7%) |
| $50,000 to $74,999 | 482 (82.4%) | 103 (17.6%) |
| $75,000 to $99,999 | 411 (84.9%) | 73 (15.1%) |
| $100,000 and over | 584 (100.0%) | 0 (0.0%) |
Public vs Private Health Insurance Coverage by Age in Williamsburg
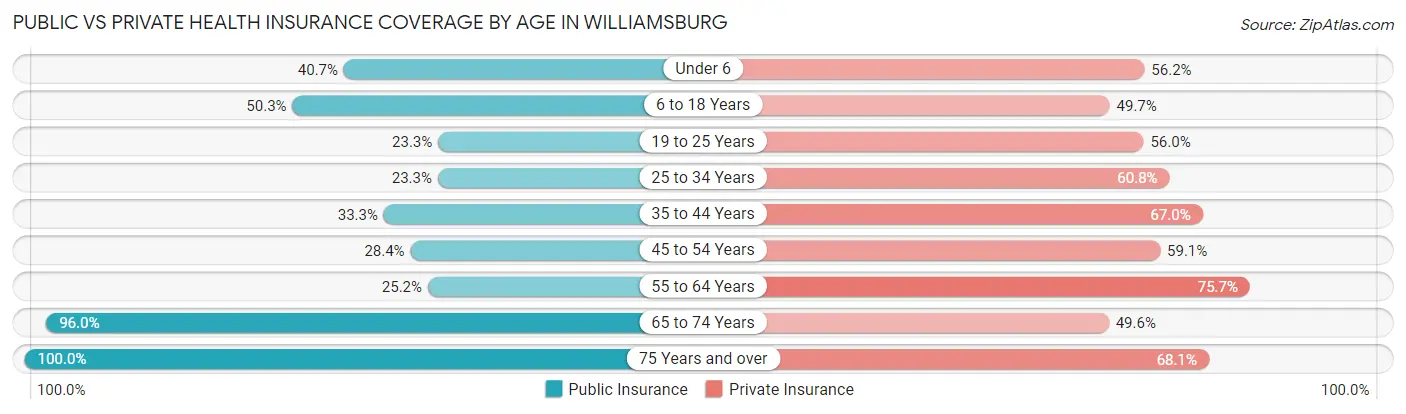
| Age Bracket | Public Insurance | Private Insurance |
| Under 6 | 66 (40.7%) | 91 (56.2%) |
| 6 to 18 Years | 172 (50.3%) | 170 (49.7%) |
| 19 to 25 Years | 93 (23.3%) | 224 (56.0%) |
| 25 to 34 Years | 82 (23.3%) | 214 (60.8%) |
| 35 to 44 Years | 114 (33.3%) | 229 (67.0%) |
| 45 to 54 Years | 86 (28.4%) | 179 (59.1%) |
| 55 to 64 Years | 86 (25.2%) | 259 (75.7%) |
| 65 to 74 Years | 215 (96.0%) | 111 (49.5%) |
| 75 Years and over | 116 (100.0%) | 79 (68.1%) |
| Total | 1,030 (39.9%) | 1,556 (60.2%) |
Disability Status by Sex by Age in Williamsburg
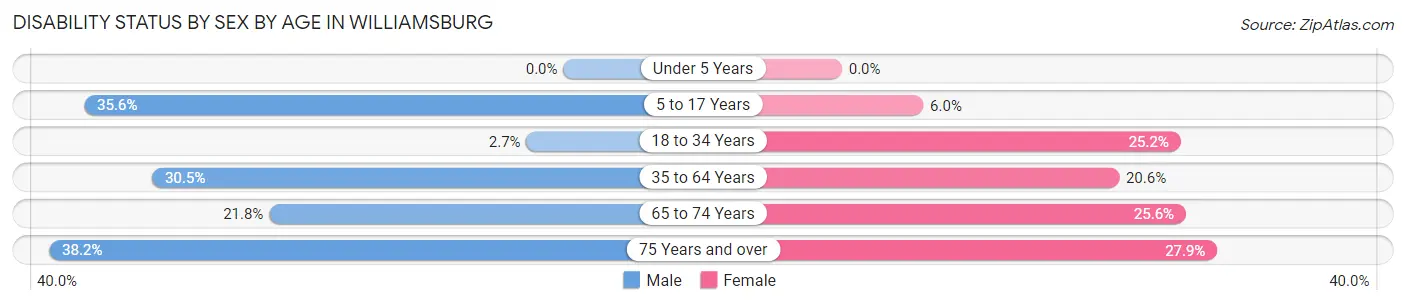
| Age Bracket | Male | Female |
| Under 5 Years | 0 (0.0%) | 0 (0.0%) |
| 5 to 17 Years | 74 (35.6%) | 11 (6.0%) |
| 18 to 34 Years | 12 (2.7%) | 79 (25.2%) |
| 35 to 64 Years | 153 (30.5%) | 100 (20.6%) |
| 65 to 74 Years | 19 (21.8%) | 35 (25.6%) |
| 75 Years and over | 21 (38.2%) | 17 (27.9%) |
Disability Class by Sex by Age in Williamsburg
Disability Class: Hearing Difficulty
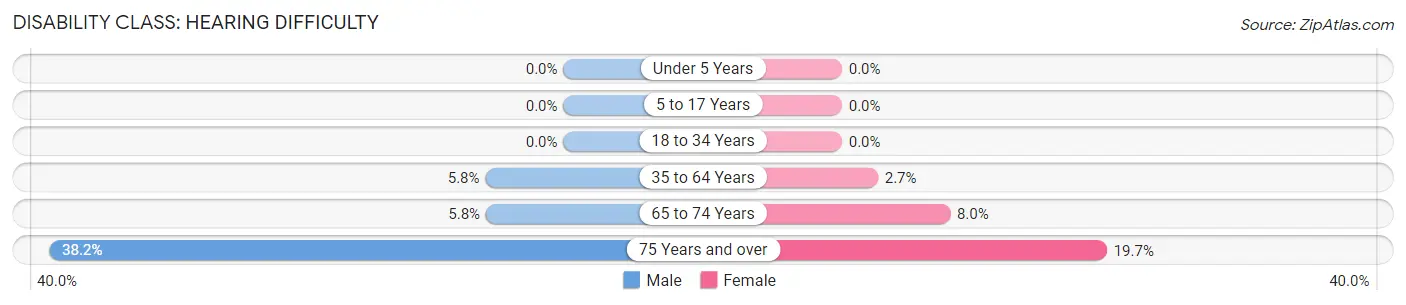
| Age Bracket | Male | Female |
| Under 5 Years | 0 (0.0%) | 0 (0.0%) |
| 5 to 17 Years | 0 (0.0%) | 0 (0.0%) |
| 18 to 34 Years | 0 (0.0%) | 0 (0.0%) |
| 35 to 64 Years | 29 (5.8%) | 13 (2.7%) |
| 65 to 74 Years | 5 (5.8%) | 11 (8.0%) |
| 75 Years and over | 21 (38.2%) | 12 (19.7%) |
Disability Class: Vision Difficulty
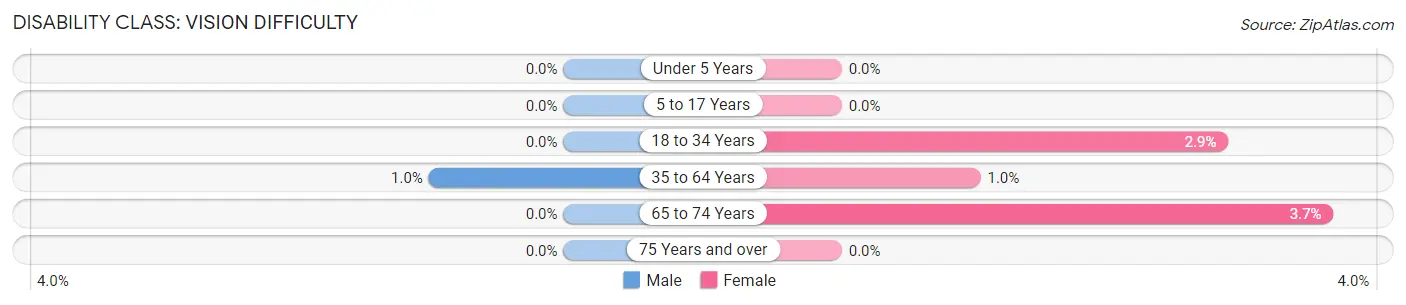
| Age Bracket | Male | Female |
| Under 5 Years | 0 (0.0%) | 0 (0.0%) |
| 5 to 17 Years | 0 (0.0%) | 0 (0.0%) |
| 18 to 34 Years | 0 (0.0%) | 9 (2.9%) |
| 35 to 64 Years | 5 (1.0%) | 5 (1.0%) |
| 65 to 74 Years | 0 (0.0%) | 5 (3.6%) |
| 75 Years and over | 0 (0.0%) | 0 (0.0%) |
Disability Class: Cognitive Difficulty
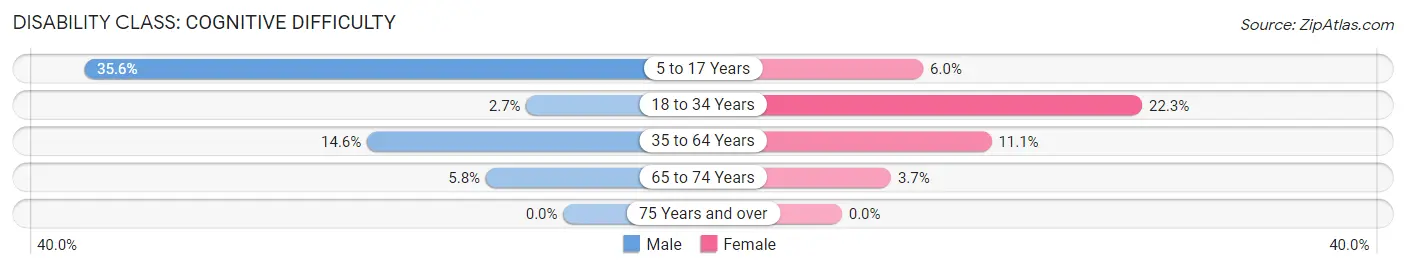
| Age Bracket | Male | Female |
| 5 to 17 Years | 74 (35.6%) | 11 (6.0%) |
| 18 to 34 Years | 12 (2.7%) | 70 (22.3%) |
| 35 to 64 Years | 73 (14.6%) | 54 (11.1%) |
| 65 to 74 Years | 5 (5.8%) | 5 (3.6%) |
| 75 Years and over | 0 (0.0%) | 0 (0.0%) |
Disability Class: Ambulatory Difficulty
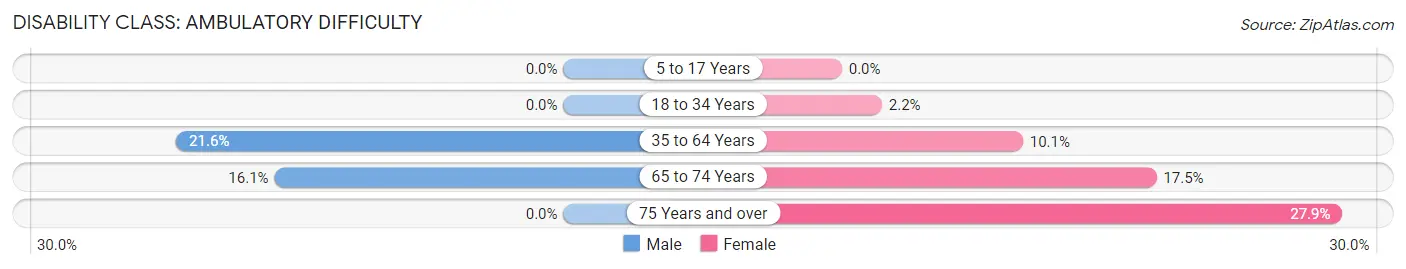
| Age Bracket | Male | Female |
| 5 to 17 Years | 0 (0.0%) | 0 (0.0%) |
| 18 to 34 Years | 0 (0.0%) | 7 (2.2%) |
| 35 to 64 Years | 108 (21.6%) | 49 (10.1%) |
| 65 to 74 Years | 14 (16.1%) | 24 (17.5%) |
| 75 Years and over | 0 (0.0%) | 17 (27.9%) |
Disability Class: Self-Care Difficulty
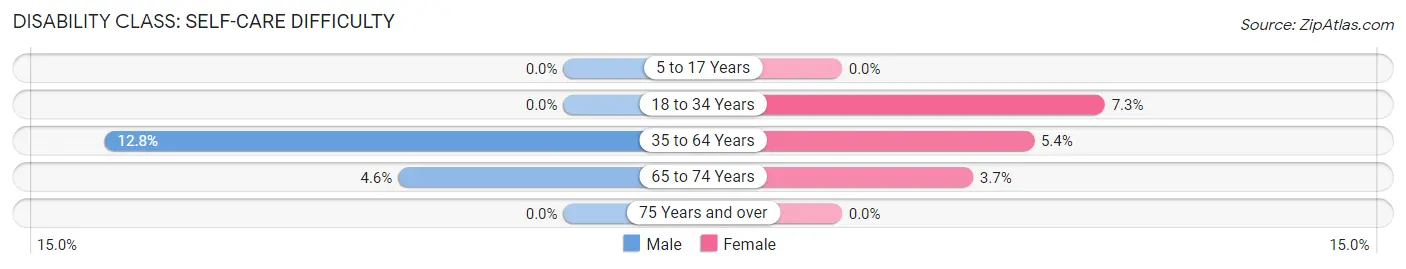
| Age Bracket | Male | Female |
| 5 to 17 Years | 0 (0.0%) | 0 (0.0%) |
| 18 to 34 Years | 0 (0.0%) | 23 (7.3%) |
| 35 to 64 Years | 64 (12.8%) | 26 (5.3%) |
| 65 to 74 Years | 4 (4.6%) | 5 (3.6%) |
| 75 Years and over | 0 (0.0%) | 0 (0.0%) |
Technology Access in Williamsburg
Computing Device Access in Williamsburg
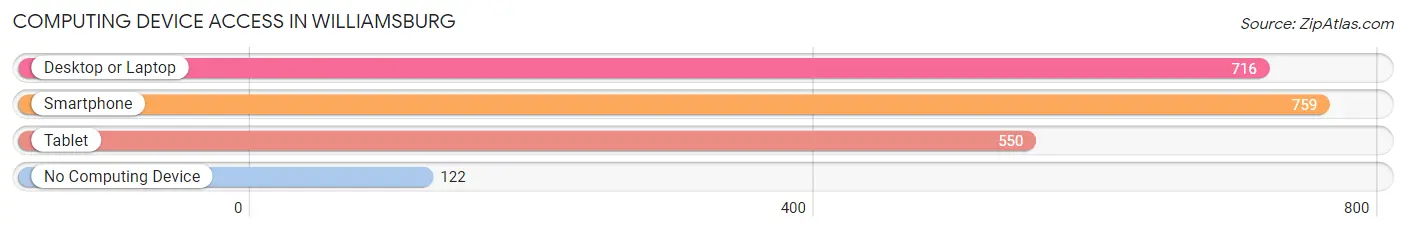
| Device Type | # Households | % Households |
| Desktop or Laptop | 716 | 72.6% |
| Smartphone | 759 | 77.0% |
| Tablet | 550 | 55.8% |
| No Computing Device | 122 | 12.4% |
| Total | 986 | 100.0% |
Internet Access in Williamsburg
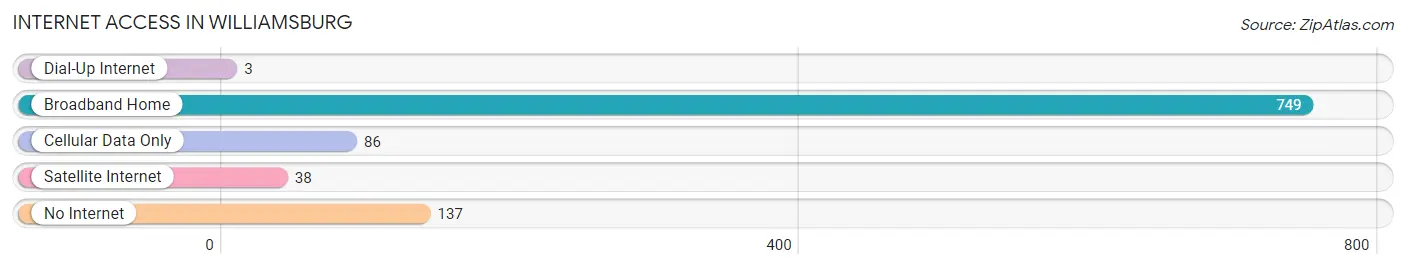
| Internet Type | # Households | % Households |
| Dial-Up Internet | 3 | 0.3% |
| Broadband Home | 749 | 76.0% |
| Cellular Data Only | 86 | 8.7% |
| Satellite Internet | 38 | 3.8% |
| No Internet | 137 | 13.9% |
| Total | 986 | 100.0% |
Williamsburg Summary
Williamsburg, Ohio is a small village located in Clermont County, Ohio. It is situated on the banks of the Little Miami River, approximately 25 miles east of Cincinnati. The village has a population of approximately 1,500 people and covers an area of 1.2 square miles.
History
Williamsburg was founded in 1817 by William Lytle, a Revolutionary War veteran. Lytle purchased the land from the government and named the village after himself. The village was incorporated in 1845 and was the first village in Clermont County to be incorporated.
The village was originally a farming community, but in the late 19th century, it became a popular tourist destination due to its proximity to the Little Miami River. The village was home to several resorts, including the Williamsburg Hotel, which was built in 1876. The hotel was a popular destination for wealthy visitors from Cincinnati and other nearby cities.
In the early 20th century, the village began to decline as the popularity of the resorts faded. The Great Depression also had a negative impact on the village, and many of the businesses closed. The village was able to survive, however, and in the 1950s, it began to experience a resurgence. The village was home to several small businesses, including a grocery store, a hardware store, and a gas station.
Geography
Williamsburg is located in Clermont County, Ohio, approximately 25 miles east of Cincinnati. The village is situated on the banks of the Little Miami River and is surrounded by rolling hills and farmland. The village covers an area of 1.2 square miles and has a population of approximately 1,500 people.
The village is served by two major highways, State Route 32 and State Route 133. The village is also served by the Clermont County Transit System, which provides public transportation to the surrounding area.
Economy
The economy of Williamsburg is largely based on agriculture and tourism. The village is home to several small businesses, including a grocery store, a hardware store, and a gas station. The village is also home to several restaurants, including the popular Williamsburg Inn.
The village is also home to several tourist attractions, including the Little Miami Scenic Trail, which is a popular destination for hikers and cyclists. The village is also home to several wineries, including the Williamsburg Winery, which produces a variety of wines.
Demographics
As of the 2010 census, the population of Williamsburg was 1,500 people. The racial makeup of the village was 97.3% White, 0.7% African American, 0.3% Native American, 0.3% Asian, and 1.3% from other races. The median household income was $45,000, and the median family income was $50,000.
The village is served by the Clermont County School District, which includes two elementary schools, one middle school, and one high school. The village is also home to several churches, including the Williamsburg United Methodist Church and the Williamsburg Baptist Church.
Common Questions
What is Per Capita Income in Williamsburg?
Per Capita income in Williamsburg is $28,863.
What is the Median Family Income in Williamsburg?
Median Family Income in Williamsburg is $68,750.
What is the Median Household income in Williamsburg?
Median Household Income in Williamsburg is $58,500.
What is Income or Wage Gap in Williamsburg?
Income or Wage Gap in Williamsburg is 0.3%.
Women in Williamsburg earn 99.7 cents for every dollar earned by a man.
What is Inequality or Gini Index in Williamsburg?
Inequality or Gini Index in Williamsburg is 0.41.
What is the Total Population of Williamsburg?
Total Population of Williamsburg is 2,583.
What is the Total Male Population of Williamsburg?
Total Male Population of Williamsburg is 1,349.
What is the Total Female Population of Williamsburg?
Total Female Population of Williamsburg is 1,234.
What is the Ratio of Males per 100 Females in Williamsburg?
There are 109.32 Males per 100 Females in Williamsburg.
What is the Ratio of Females per 100 Males in Williamsburg?
There are 91.48 Females per 100 Males in Williamsburg.
What is the Median Population Age in Williamsburg?
Median Population Age in Williamsburg is 35.4 Years.
What is the Average Family Size in Williamsburg
Average Family Size in Williamsburg is 3.2 People.
What is the Average Household Size in Williamsburg
Average Household Size in Williamsburg is 2.5 People.
How Large is the Labor Force in Williamsburg?
There are 1,379 People in the Labor Forcein in Williamsburg.
What is the Percentage of People in the Labor Force in Williamsburg?
63.5% of People are in the Labor Force in Williamsburg.
What is the Unemployment Rate in Williamsburg?
Unemployment Rate in Williamsburg is 3.3%.