Zip Codes with the Highest Percentage of Population with a Degree in Liberal Arts and History in Cuyahoga Falls, OH
RELATED REPORTS & OPTIONS
Liberal Arts and History
Cuyahoga Falls
Compare Zip Codes
Map of Zip Codes with the Highest Percentage of Population with a Degree in Liberal Arts and History in Cuyahoga Falls
4.2%
6.1%
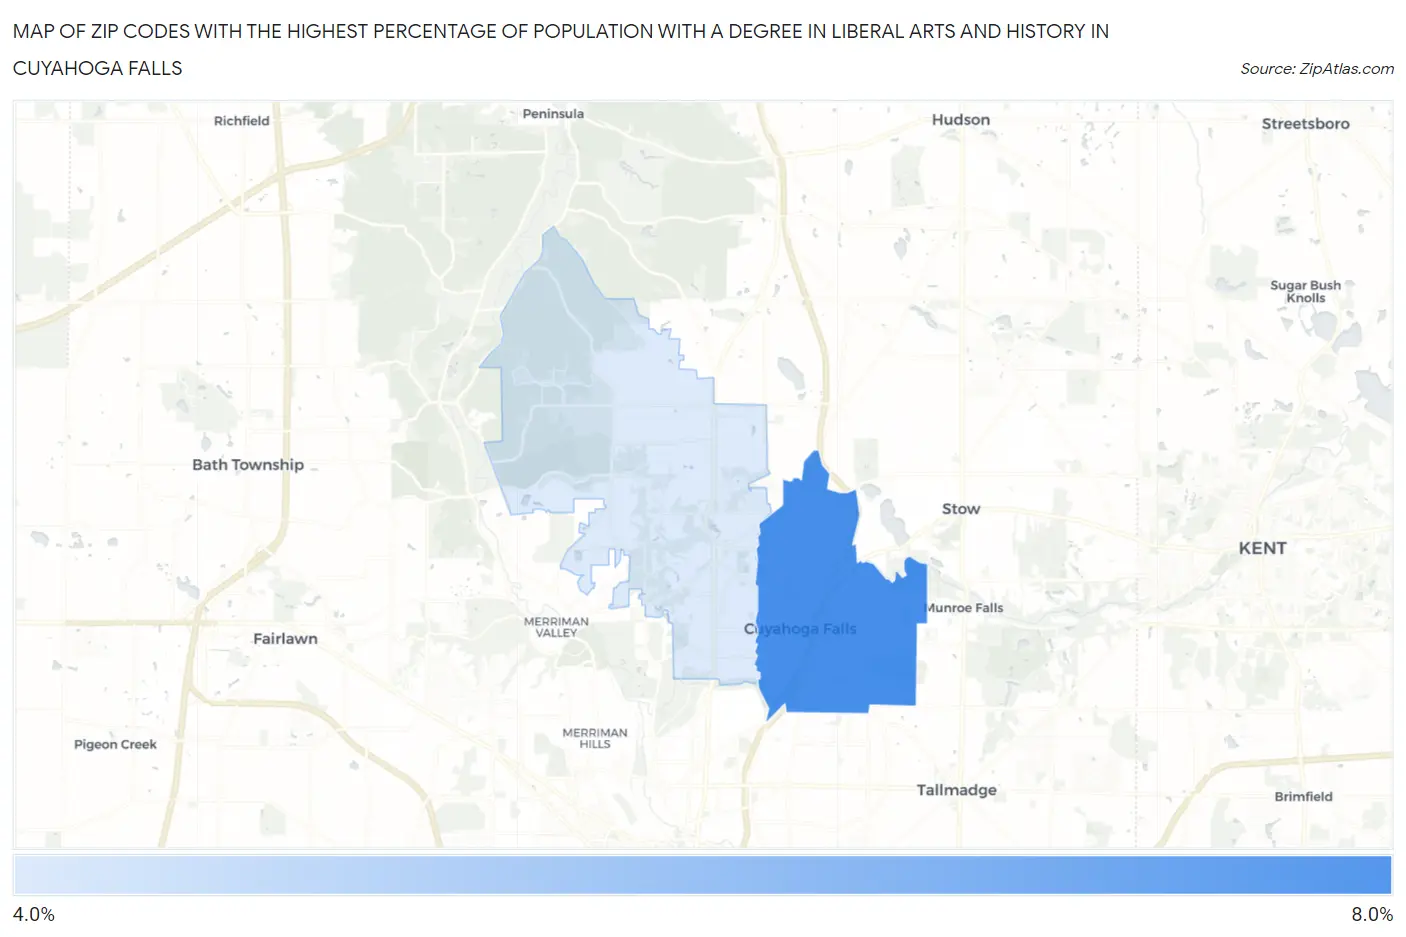
Zip Codes with the Highest Percentage of Population with a Degree in Liberal Arts and History in Cuyahoga Falls, OH
| Zip Code | % Graduates | vs State | vs National | |
| 1. | 44221 | 6.1% | 4.2%(+1.90)#236 | 4.9%(+1.23)#8,262 |
| 2. | 44223 | 4.2% | 4.2%(+0.046)#421 | 4.9%(-0.629)#13,845 |
1
Common Questions
What are the Top Zip Codes with the Highest Percentage of Population with a Degree in Liberal Arts and History in Cuyahoga Falls, OH?
Top Zip Codes with the Highest Percentage of Population with a Degree in Liberal Arts and History in Cuyahoga Falls, OH are:
What zip code has the Highest Percentage of Population with a Degree in Liberal Arts and History in Cuyahoga Falls, OH?
44221 has the Highest Percentage of Population with a Degree in Liberal Arts and History in Cuyahoga Falls, OH with 6.1%.
What is the Percentage of Population with a Degree in Liberal Arts and History in Cuyahoga Falls, OH?
Percentage of Population with a Degree in Liberal Arts and History in Cuyahoga Falls is 5.0%.
What is the Percentage of Population with a Degree in Liberal Arts and History in Ohio?
Percentage of Population with a Degree in Liberal Arts and History in Ohio is 4.2%.
What is the Percentage of Population with a Degree in Liberal Arts and History in the United States?
Percentage of Population with a Degree in Liberal Arts and History in the United States is 4.9%.