Zip Codes with the Highest Percentage of Population with a Degree in Liberal Arts and History in Cleveland, OH

RELATED REPORTS & OPTIONS

Liberal Arts and History
Population
Families and Households
Female Fertility
Female Fertility (Unmarried)
Race (Community Size)
Race (Percentage)
Ancestry (Community Size)
AfghanAfricanAlbanianAlsatianAmericanApacheArabArgentineanArmenianAustralianAustrianBahamianBangladeshiBarbadianBelgianBelizeanBhutaneseBlackfeetBrazilianBritishBritish West IndianBulgarianBurmeseCajunCambodianCanadianCape VerdeanCarpatho RusynCelticCentral AmericanCentral American IndianCherokeeChickasawChileanChippewaChoctawColombianComancheCosta RicanCreekCroatianCubanCzechCzechoslovakianDanishDelawareDominicanDutchDutch West IndianEastern EuropeanEcuadorianEgyptianEnglishEstonianEthiopianEuropeanFilipinoFinnishFrenchFrench American IndianFrench CanadianGermanGhanaianGreekGuamanian / ChamorroGuatemalanGuyaneseHaitianHonduranHungarianIcelanderIndian (Asian)IndonesianIranianIraqiIrishIroquoisIsraeliItalianJamaicanJapaneseJordanianKoreanLaotianLatvianLebaneseLiberianLithuanianLumbeeLuxembourgerMacedonianMalaysianMexicanMexican American IndianMongolianMoroccanNative HawaiianNavajoNicaraguanNigerianNorthern EuropeanNorwegianPakistaniPalestinianPanamanianParaguayanPennsylvania GermanPeruvianPolishPortuguesePuebloPuerto RicanRomanianRussianSalvadoranSamoanScandinavianScotch-IrishScottishSeminoleSerbianSierra LeoneanSiouxSlavicSlovakSloveneSomaliSouth AfricanSouth AmericanSouth American IndianSpaniardSpanishSri LankanSubsaharan AfricanSudaneseSwedishSwissSyrianThaiTrinidadian and TobagonianTurkishU.S. Virgin IslanderUgandanUkrainianUruguayanVenezuelanVietnameseWelshWest IndianYaquiYugoslavianZimbabwean
Ancestry (Percentage)
AfghanAfricanAlbanianAlsatianAmericanApacheArabArgentineanArmenianAustralianAustrianBahamianBangladeshiBarbadianBelgianBelizeanBhutaneseBlackfeetBrazilianBritishBritish West IndianBulgarianBurmeseCajunCambodianCanadianCape VerdeanCarpatho RusynCelticCentral AmericanCentral American IndianCherokeeChickasawChileanChippewaChoctawColombianComancheCosta RicanCreekCroatianCubanCzechCzechoslovakianDanishDelawareDominicanDutchDutch West IndianEastern EuropeanEcuadorianEgyptianEnglishEstonianEthiopianEuropeanFilipinoFinnishFrenchFrench American IndianFrench CanadianGermanGhanaianGreekGuamanian / ChamorroGuatemalanGuyaneseHaitianHonduranHungarianIcelanderIndian (Asian)IndonesianIranianIraqiIrishIroquoisIsraeliItalianJamaicanJapaneseJordanianKoreanLaotianLatvianLebaneseLiberianLithuanianLumbeeLuxembourgerMacedonianMalaysianMexicanMexican American IndianMongolianMoroccanNative HawaiianNavajoNicaraguanNigerianNorthern EuropeanNorwegianPakistaniPalestinianPanamanianParaguayanPennsylvania GermanPeruvianPolishPortuguesePuebloPuerto RicanRomanianRussianSalvadoranSamoanScandinavianScotch-IrishScottishSeminoleSerbianSierra LeoneanSiouxSlavicSlovakSloveneSomaliSouth AfricanSouth AmericanSouth American IndianSpaniardSpanishSri LankanSubsaharan AfricanSudaneseSwedishSwissSyrianThaiTrinidadian and TobagonianTurkishU.S. Virgin IslanderUgandanUkrainianUruguayanVenezuelanVietnameseWelshWest IndianYaquiYugoslavianZimbabwean
Immigrant Origin (Total)
AfghanistanAfricaAlbaniaArgentinaAsiaAustraliaAustriaBangladeshBarbadosBelarusBelgiumBelizeBosnia and HerzegovinaBrazilBulgariaBurma / MyanmarCambodiaCanadaCaribbeanCentral AmericaChileChinaColombiaCongoCosta RicaCroatiaCubaCzechoslovakiaDominican RepublicEastern AfricaEastern AsiaEastern EuropeEcuadorEgyptEl SalvadorEnglandEthiopiaEuropeFranceGermanyGhanaGreeceGuatemalaGuyanaHaitiHondurasHong KongHungaryIndiaIndonesiaIranIraqIrelandIsraelItalyJamaicaJapanJordanKazakhstanKenyaKoreaKuwaitLaosLatin AmericaLatviaLebanonLiberiaLithuaniaMalaysiaMexicoMiddle AfricaMoldovaMoroccoNepalNetherlandsNicaraguaNigeriaNorthern AfricaNorthern EuropeOceaniaPakistanPanamaPeruPhilippinesPolandRomaniaRussiaSaudi ArabiaScotlandSerbiaSierra LeoneSingaporeSomaliaSouth AfricaSouth AmericaSouth Central AsiaSouth Eastern AsiaSouthern EuropeSpainSri LankaSudanSwedenSyriaTaiwanThailandTrinidad and TobagoTurkeyUgandaUkraineUruguayUzbekistanVenezuelaVietnamWest IndiesWestern AfricaWestern AsiaWestern EuropeZaireZimbabwe
Immigrant Origin (Percentage)
AfghanistanAfricaAlbaniaArgentinaAsiaAustraliaAustriaBangladeshBarbadosBelarusBelgiumBelizeBosnia and HerzegovinaBrazilBulgariaBurma / MyanmarCambodiaCanadaCaribbeanCentral AmericaChileChinaColombiaCongoCosta RicaCroatiaCubaCzechoslovakiaDominican RepublicEastern AfricaEastern AsiaEastern EuropeEcuadorEgyptEl SalvadorEnglandEthiopiaEuropeFranceGermanyGhanaGreeceGuatemalaGuyanaHaitiHondurasHong KongHungaryIndiaIndonesiaIranIraqIrelandIsraelItalyJamaicaJapanJordanKazakhstanKenyaKoreaKuwaitLaosLatin AmericaLatviaLebanonLiberiaLithuaniaMalaysiaMexicoMiddle AfricaMoldovaMoroccoNepalNetherlandsNicaraguaNigeriaNorthern AfricaNorthern EuropeOceaniaPakistanPanamaPeruPhilippinesPolandRomaniaRussiaSaudi ArabiaScotlandSerbiaSierra LeoneSingaporeSomaliaSouth AfricaSouth AmericaSouth Central AsiaSouth Eastern AsiaSouthern EuropeSpainSri LankaSudanSwedenSyriaTaiwanThailandTrinidad and TobagoTurkeyUgandaUkraineUruguayUzbekistanVenezuelaVietnamWest IndiesWestern AfricaWestern AsiaWestern EuropeZaireZimbabwe
Income
Income (Families)
Income (Households)
Poverty
Poverty (Families)
Unemployment
Employment Occupations
Employment Industries
Employer Class
Commute Time
Commute Means
School Enrollment
Education by Degree Field
Occupancy
Finances
Physical Characteristics
Cleveland
Compare Zip Codes
Comparison Subject

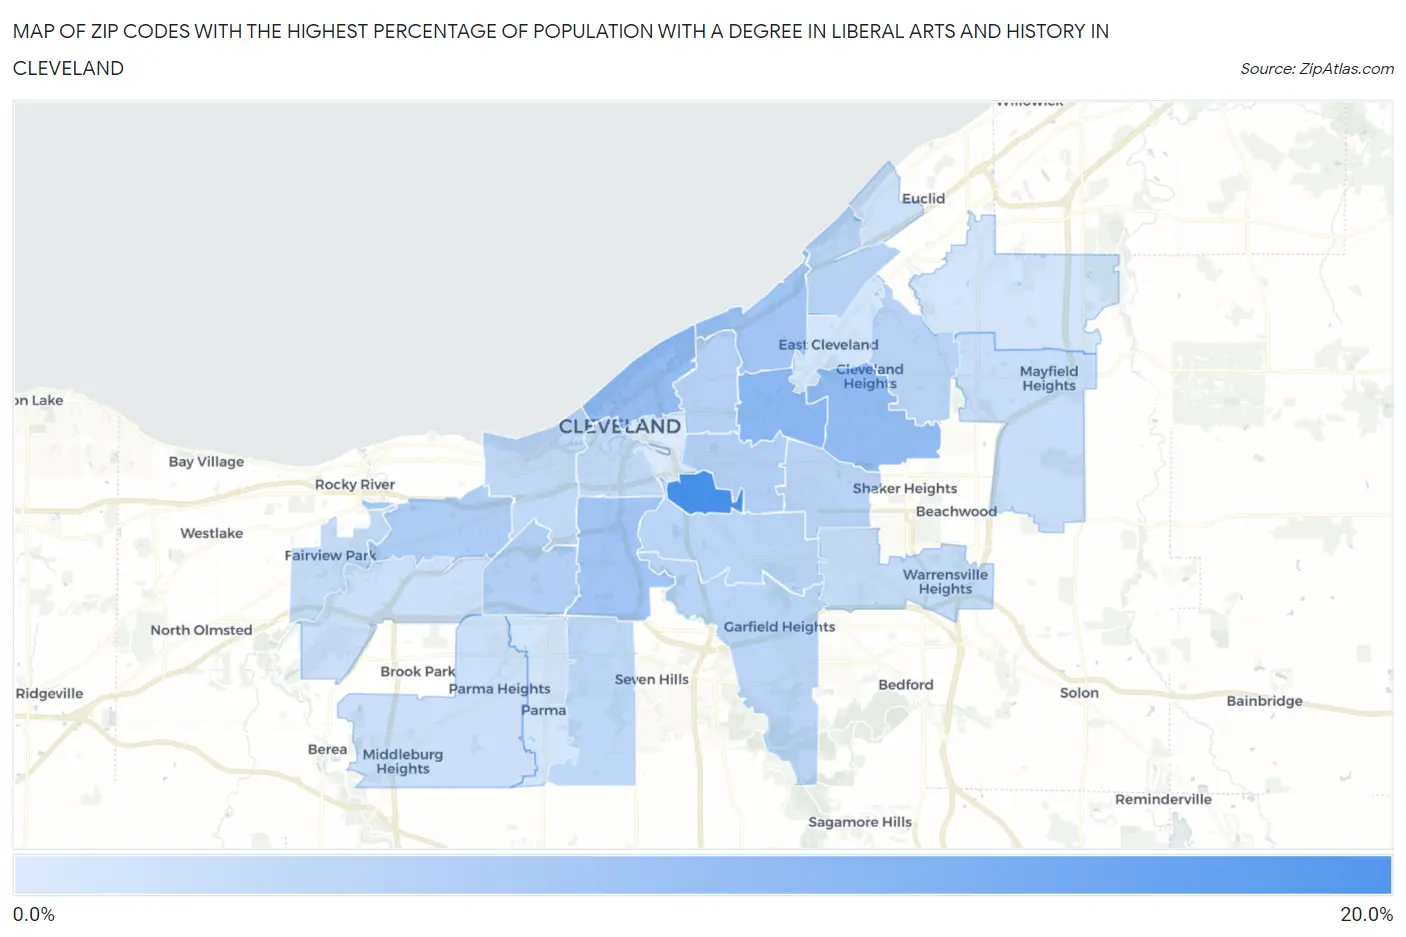
Map of Zip Codes with the Highest Percentage of Population with a Degree in Liberal Arts and History in Cleveland

0.0%
20.0%
Zip Codes with the Highest Percentage of Population with a Degree in Liberal Arts and History in Cleveland Map

Zip Codes with the Highest Percentage of Population with a Degree in Liberal Arts and History in Cleveland, OH

Zip Code % Graduates vs State vs National
1.4412716.9%4.2%(+12.7)#384.9%(+12.1)#1,137
2.441069.8%4.2%(+5.65)#894.9%(+4.97)#3,206
3.441189.3%4.2%(+5.06)#1004.9%(+4.38)#3,643
4.441149.0%4.2%(+4.77)#1114.9%(+4.10)#3,890
5.441097.6%4.2%(+3.42)#1514.9%(+2.74)#5,421
6.441087.5%4.2%(+3.33)#1564.9%(+2.66)#5,545
7.441116.6%4.2%(+2.35)#2034.9%(+1.68)#7,245
8.441046.1%4.2%(+1.90)#2374.9%(+1.23)#8,267
9.441446.1%4.2%(+1.86)#2414.9%(+1.19)#8,351
10.441035.8%4.2%(+1.58)#2614.9%(+0.910)#9,091
11.441105.5%4.2%(+1.34)#2914.9%(+0.670)#9,746
12.441205.4%4.2%(+1.16)#3114.9%(+0.489)#10,237
13.441215.3%4.2%(+1.13)#3154.9%(+0.456)#10,354
14.441055.2%4.2%(+1.00)#3274.9%(+0.329)#10,724
15.441255.2%4.2%(+0.979)#3314.9%(+0.305)#10,791
16.441344.8%4.2%(+0.574)#3624.9%(-0.100)#12,058
17.441024.6%4.2%(+0.357)#3954.9%(-0.317)#12,783
18.441134.5%4.2%(+0.257)#4054.9%(-0.417)#13,105
19.441264.3%4.2%(+0.089)#4184.9%(-0.586)#13,681
20.441284.0%4.2%(-0.228)#4574.9%(-0.903)#14,909
21.441243.8%4.2%(-0.375)#4744.9%(-1.05)#15,434
22.441303.5%4.2%(-0.744)#5354.9%(-1.42)#16,770
23.441353.4%4.2%(-0.840)#5504.9%(-1.51)#17,113
24.441193.2%4.2%(-1.00)#5754.9%(-1.68)#17,665
25.441432.8%4.2%(-1.43)#6334.9%(-2.10)#19,094
26.441292.7%4.2%(-1.50)#6484.9%(-2.17)#19,337
27.441122.7%4.2%(-1.53)#6524.9%(-2.20)#19,427
28.441151.9%4.2%(-2.35)#7574.9%(-3.02)#21,715

Common Questions

What are the Top 10 Zip Codes with the Highest Percentage of Population with a Degree in Liberal Arts and History in Cleveland, OH?
Top 10 Zip Codes with the Highest Percentage of Population with a Degree in Liberal Arts and History in Cleveland, OH are:
#1
16.9%
#2
9.8%
#3
9.3%
#4
9.0%
#5
7.6%
#6
7.5%
#7
6.6%
#8
6.1%
#9
6.1%
#10
5.8%
What zip code has the Highest Percentage of Population with a Degree in Liberal Arts and History in Cleveland, OH?
44127 has the Highest Percentage of Population with a Degree in Liberal Arts and History in Cleveland, OH with 16.9%.
What is the Percentage of Population with a Degree in Liberal Arts and History in Cleveland, OH?
Percentage of Population with a Degree in Liberal Arts and History in Cleveland is 5.6%.
What is the Percentage of Population with a Degree in Liberal Arts and History in Ohio?
Percentage of Population with a Degree in Liberal Arts and History in Ohio is 4.2%.
What is the Percentage of Population with a Degree in Liberal Arts and History in the United States?
Percentage of Population with a Degree in Liberal Arts and History in the United States is 4.9%.