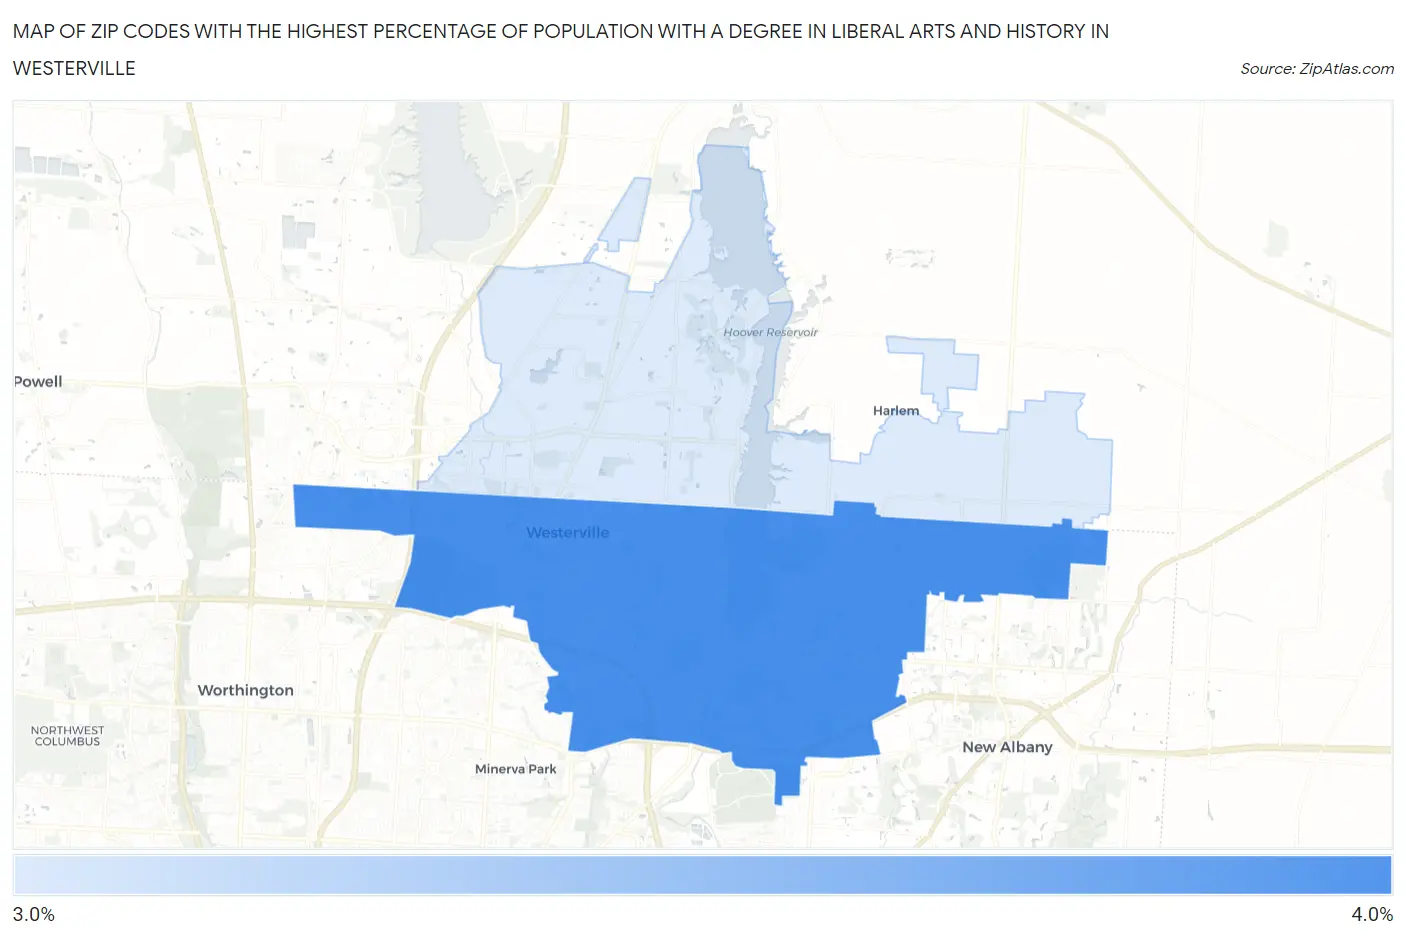
Zip Codes with the Highest Percentage of Population with a Degree in Liberal Arts and History in Westerville, OH
RELATED REPORTS & OPTIONS
Liberal Arts and History
Westerville
Compare Zip Codes
Map of Zip Codes with the Highest Percentage of Population with a Degree in Liberal Arts and History in Westerville
3.7%
3.8%
Zip Codes with the Highest Percentage of Population with a Degree in Liberal Arts and History in Westerville, OH
| Zip Code | % Graduates | vs State | vs National | |
| 1. | 43081 | 3.8% | 4.2%(-0.430)#482 | 4.9%(-1.10)#15,647 |
| 2. | 43082 | 3.7% | 4.2%(-0.466)#485 | 4.9%(-1.14)#15,770 |
1
Common Questions
What are the Top Zip Codes with the Highest Percentage of Population with a Degree in Liberal Arts and History in Westerville, OH?
Top Zip Codes with the Highest Percentage of Population with a Degree in Liberal Arts and History in Westerville, OH are:
What zip code has the Highest Percentage of Population with a Degree in Liberal Arts and History in Westerville, OH?
43081 has the Highest Percentage of Population with a Degree in Liberal Arts and History in Westerville, OH with 3.8%.
What is the Percentage of Population with a Degree in Liberal Arts and History in Westerville, OH?
Percentage of Population with a Degree in Liberal Arts and History in Westerville is 4.7%.
What is the Percentage of Population with a Degree in Liberal Arts and History in Ohio?
Percentage of Population with a Degree in Liberal Arts and History in Ohio is 4.2%.
What is the Percentage of Population with a Degree in Liberal Arts and History in the United States?
Percentage of Population with a Degree in Liberal Arts and History in the United States is 4.9%.