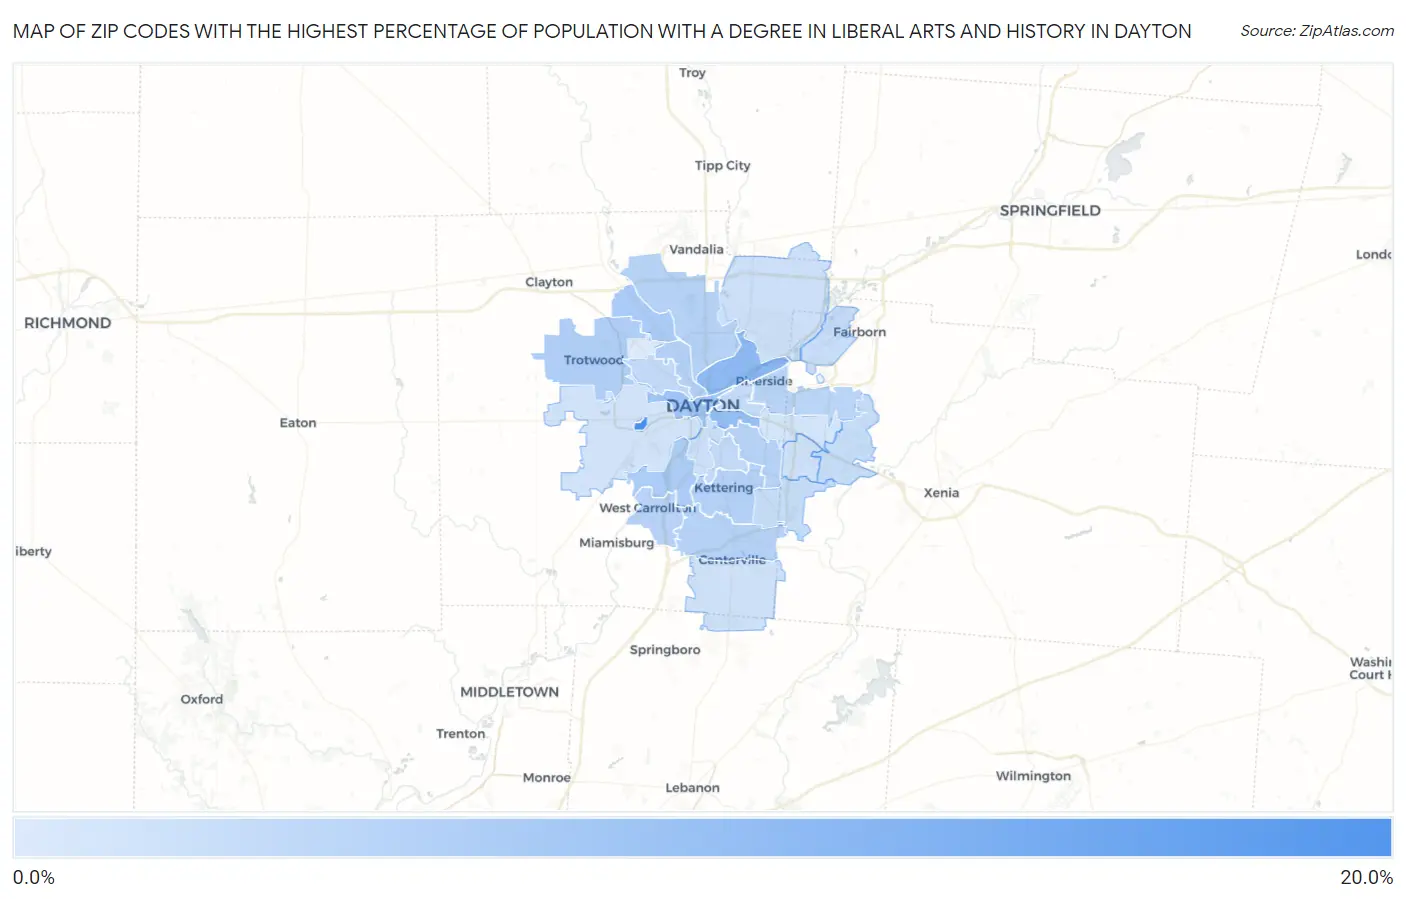
Zip Codes with the Highest Percentage of Population with a Degree in Liberal Arts and History in Dayton, OH
RELATED REPORTS & OPTIONS
Liberal Arts and History
Dayton
Compare Zip Codes
Map of Zip Codes with the Highest Percentage of Population with a Degree in Liberal Arts and History in Dayton
0.52%
20.0%

Zip Codes with the Highest Percentage of Population with a Degree in Liberal Arts and History in Dayton, OH
| Zip Code | % Graduates | vs State | vs National | |
| 1. | 45428 | 20.0% | 4.2%(+15.8)#31 | 4.9%(+15.1)#863 |
| 2. | 45404 | 10.2% | 4.2%(+5.96)#82 | 4.9%(+5.29)#3,022 |
| 3. | 45410 | 9.5% | 4.2%(+5.30)#96 | 4.9%(+4.62)#3,459 |
| 4. | 45402 | 7.8% | 4.2%(+3.62)#144 | 4.9%(+2.94)#5,149 |
| 5. | 45415 | 6.7% | 4.2%(+2.52)#191 | 4.9%(+1.85)#6,900 |
| 6. | 45439 | 6.3% | 4.2%(+2.11)#218 | 4.9%(+1.44)#7,767 |
| 7. | 45426 | 6.1% | 4.2%(+1.93)#232 | 4.9%(+1.26)#8,180 |
| 8. | 45429 | 5.7% | 4.2%(+1.47)#272 | 4.9%(+0.799)#9,377 |
| 9. | 45405 | 5.6% | 4.2%(+1.44)#279 | 4.9%(+0.761)#9,481 |
| 10. | 45459 | 5.4% | 4.2%(+1.22)#305 | 4.9%(+0.543)#10,094 |
| 11. | 45420 | 5.4% | 4.2%(+1.19)#308 | 4.9%(+0.518)#10,160 |
| 12. | 45414 | 5.3% | 4.2%(+1.06)#322 | 4.9%(+0.390)#10,565 |
| 13. | 45449 | 5.0% | 4.2%(+0.796)#345 | 4.9%(+0.122)#11,376 |
| 14. | 45431 | 4.6% | 4.2%(+0.409)#385 | 4.9%(-0.266)#12,626 |
| 15. | 45419 | 3.9% | 4.2%(-0.270)#461 | 4.9%(-0.944)#15,063 |
| 16. | 45406 | 3.9% | 4.2%(-0.316)#469 | 4.9%(-0.991)#15,230 |
| 17. | 45403 | 3.6% | 4.2%(-0.641)#514 | 4.9%(-1.32)#16,388 |
| 18. | 45434 | 3.2% | 4.2%(-0.960)#569 | 4.9%(-1.63)#17,534 |
| 19. | 45440 | 3.2% | 4.2%(-1.02)#581 | 4.9%(-1.69)#17,732 |
| 20. | 45433 | 2.9% | 4.2%(-1.29)#619 | 4.9%(-1.97)#18,686 |
| 21. | 45424 | 2.5% | 4.2%(-1.74)#685 | 4.9%(-2.42)#20,128 |
| 22. | 45409 | 2.4% | 4.2%(-1.75)#689 | 4.9%(-2.42)#20,150 |
| 23. | 45430 | 2.2% | 4.2%(-2.04)#726 | 4.9%(-2.71)#20,948 |
| 24. | 45458 | 2.1% | 4.2%(-2.13)#736 | 4.9%(-2.80)#21,187 |
| 25. | 45417 | 2.0% | 4.2%(-2.17)#743 | 4.9%(-2.85)#21,315 |
| 26. | 45432 | 1.7% | 4.2%(-2.50)#774 | 4.9%(-3.17)#22,076 |
| 27. | 45416 | 0.52% | 4.2%(-3.68)#867 | 4.9%(-4.35)#24,000 |
1
Common Questions
What are the Top 10 Zip Codes with the Highest Percentage of Population with a Degree in Liberal Arts and History in Dayton, OH?
Top 10 Zip Codes with the Highest Percentage of Population with a Degree in Liberal Arts and History in Dayton, OH are:
What zip code has the Highest Percentage of Population with a Degree in Liberal Arts and History in Dayton, OH?
45428 has the Highest Percentage of Population with a Degree in Liberal Arts and History in Dayton, OH with 20.0%.
What is the Percentage of Population with a Degree in Liberal Arts and History in Dayton, OH?
Percentage of Population with a Degree in Liberal Arts and History in Dayton is 5.0%.
What is the Percentage of Population with a Degree in Liberal Arts and History in Ohio?
Percentage of Population with a Degree in Liberal Arts and History in Ohio is 4.2%.
What is the Percentage of Population with a Degree in Liberal Arts and History in the United States?
Percentage of Population with a Degree in Liberal Arts and History in the United States is 4.9%.