Zip Codes with the Highest Percentage of Population with a Degree in Liberal Arts and History in Ohio
RELATED REPORTS & OPTIONS
Liberal Arts and History
Ohio
Compare Zip Codes
Map of Zip Codes with the Highest Percentage of Population with a Degree in Liberal Arts and History in Ohio
0.0%
100.0%
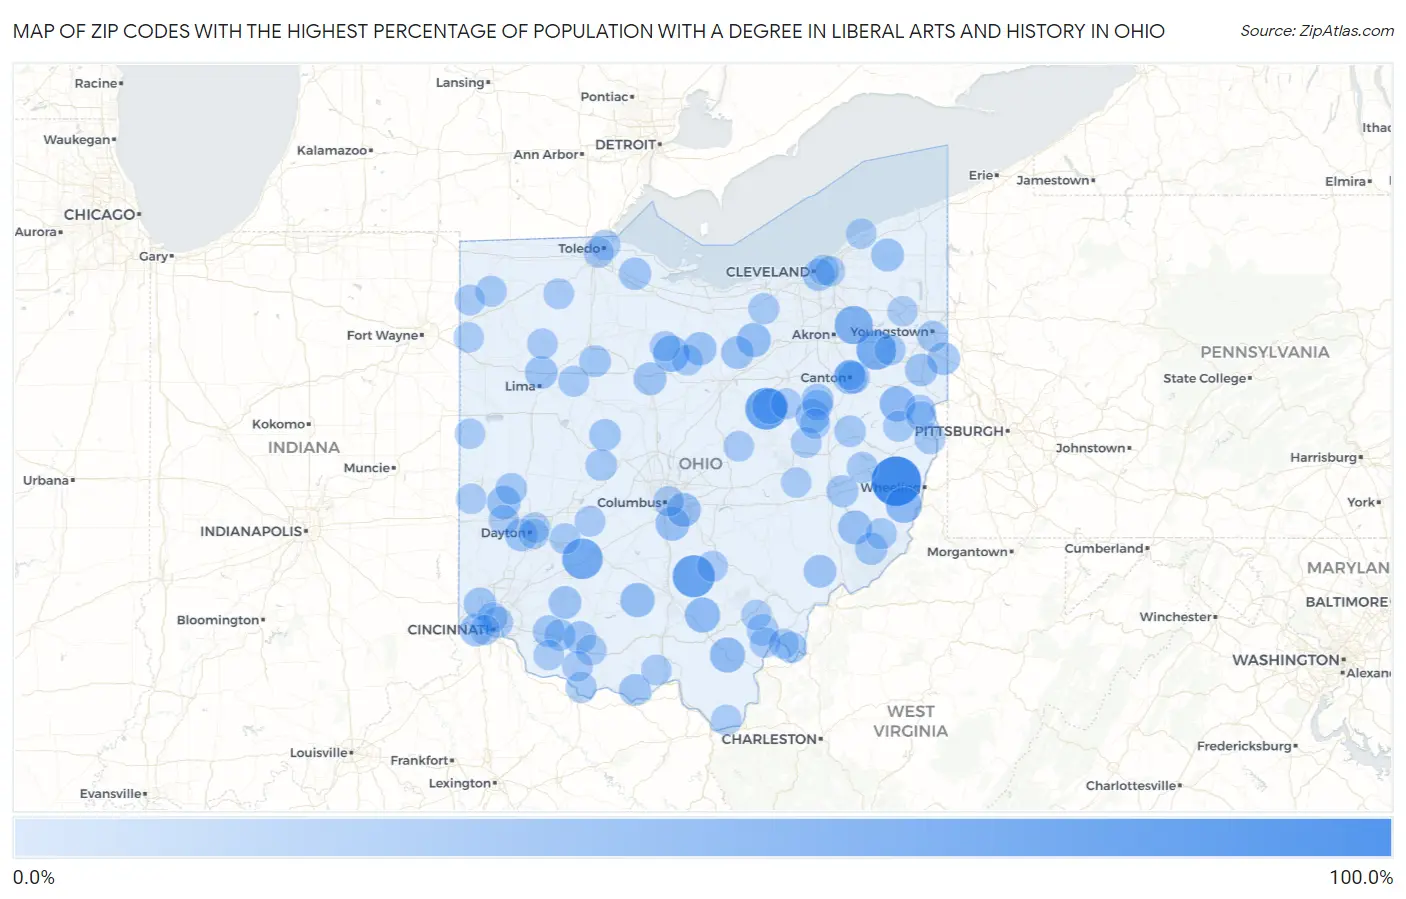
Zip Codes with the Highest Percentage of Population with a Degree in Liberal Arts and History in Ohio
| Zip Code | % Graduates | vs State | vs National | |
| 1. | 43972 | 100.0% | 4.2% (+95.8)#1 | 4.9% (+95.1)#38 |
| 2. | 43101 | 64.7% | 4.2% (+60.5)#2 | 4.9% (+59.8)#87 |
| 3. | 44661 | 62.9% | 4.2% (+58.7)#3 | 4.9% (+58.0)#92 |
| 4. | 45307 | 56.8% | 4.2% (+52.6)#4 | 4.9% (+51.9)#114 |
| 5. | 44640 | 52.0% | 4.2% (+47.8)#5 | 4.9% (+47.1)#133 |
| 6. | 44243 | 45.5% | 4.2% (+41.3)#6 | 4.9% (+40.6)#196 |
| 7. | 44825 | 36.4% | 4.2% (+32.2)#7 | 4.9% (+31.5)#289 |
| 8. | 43933 | 34.9% | 4.2% (+30.7)#8 | 4.9% (+30.0)#318 |
| 9. | 44611 | 34.1% | 4.2% (+29.9)#9 | 4.9% (+29.2)#331 |
| 10. | 44651 | 33.3% | 4.2% (+29.1)#10 | 4.9% (+28.5)#340 |
| 11. | 45685 | 31.5% | 4.2% (+27.3)#11 | 4.9% (+26.6)#392 |
| 12. | 45672 | 31.4% | 4.2% (+27.2)#12 | 4.9% (+26.5)#394 |
| 13. | 45681 | 27.7% | 4.2% (+23.5)#13 | 4.9% (+22.8)#476 |
| 14. | 44880 | 27.0% | 4.2% (+22.8)#14 | 4.9% (+22.2)#497 |
| 15. | 43217 | 26.0% | 4.2% (+21.8)#15 | 4.9% (+21.1)#538 |
| 16. | 43109 | 26.0% | 4.2% (+21.8)#16 | 4.9% (+21.1)#539 |
| 17. | 43788 | 26.0% | 4.2% (+21.8)#17 | 4.9% (+21.1)#540 |
| 18. | 44687 | 25.4% | 4.2% (+21.2)#18 | 4.9% (+20.5)#560 |
| 19. | 44702 | 24.2% | 4.2% (+20.0)#19 | 4.9% (+19.4)#620 |
| 20. | 45361 | 24.1% | 4.2% (+19.9)#20 | 4.9% (+19.3)#624 |
| 21. | 44865 | 22.8% | 4.2% (+18.6)#21 | 4.9% (+18.0)#688 |
| 22. | 44064 | 21.2% | 4.2% (+17.0)#22 | 4.9% (+16.3)#787 |
| 23. | 45051 | 21.2% | 4.2% (+17.0)#23 | 4.9% (+16.3)#788 |
| 24. | 44849 | 21.0% | 4.2% (+16.8)#24 | 4.9% (+16.1)#798 |
| 25. | 44874 | 20.8% | 4.2% (+16.6)#25 | 4.9% (+15.9)#810 |
| 26. | 45148 | 20.5% | 4.2% (+16.3)#26 | 4.9% (+15.6)#825 |
| 27. | 44454 | 20.3% | 4.2% (+16.1)#27 | 4.9% (+15.4)#840 |
| 28. | 45820 | 20.2% | 4.2% (+16.0)#28 | 4.9% (+15.4)#843 |
| 29. | 45786 | 20.0% | 4.2% (+15.8)#29 | 4.9% (+15.1)#850 |
| 30. | 45155 | 20.0% | 4.2% (+15.8)#30 | 4.9% (+15.1)#858 |
| 31. | 45428 | 20.0% | 4.2% (+15.8)#31 | 4.9% (+15.1)#863 |
| 32. | 44431 | 19.4% | 4.2% (+15.2)#32 | 4.9% (+14.5)#909 |
| 33. | 45252 | 19.0% | 4.2% (+14.8)#33 | 4.9% (+14.2)#932 |
| 34. | 45734 | 18.8% | 4.2% (+14.6)#34 | 4.9% (+13.9)#956 |
| 35. | 43416 | 18.5% | 4.2% (+14.3)#35 | 4.9% (+13.7)#971 |
| 36. | 44689 | 18.2% | 4.2% (+14.0)#36 | 4.9% (+13.3)#1,008 |
| 37. | 43768 | 17.1% | 4.2% (+12.9)#37 | 4.9% (+12.3)#1,119 |
| 38. | 44127 | 16.9% | 4.2% (+12.7)#38 | 4.9% (+12.1)#1,137 |
| 39. | 44704 | 16.5% | 4.2% (+12.3)#39 | 4.9% (+11.7)#1,187 |
| 40. | 45176 | 16.2% | 4.2% (+12.0)#40 | 4.9% (+11.3)#1,234 |
| 41. | 43358 | 15.9% | 4.2% (+11.8)#41 | 4.9% (+11.1)#1,269 |
| 42. | 45684 | 15.7% | 4.2% (+11.5)#42 | 4.9% (+10.8)#1,307 |
| 43. | 45814 | 15.6% | 4.2% (+11.4)#43 | 4.9% (+10.7)#1,313 |
| 44. | 43060 | 15.5% | 4.2% (+11.3)#44 | 4.9% (+10.6)#1,333 |
| 45. | 45359 | 15.2% | 4.2% (+11.0)#45 | 4.9% (+10.4)#1,378 |
| 46. | 45775 | 14.9% | 4.2% (+10.7)#46 | 4.9% (+10.0)#1,442 |
| 47. | 44653 | 14.9% | 4.2% (+10.7)#47 | 4.9% (+10.0)#1,443 |
| 48. | 45154 | 14.4% | 4.2% (+10.3)#48 | 4.9% (+9.58)#1,530 |
| 49. | 43973 | 13.6% | 4.2% (+9.42)#49 | 4.9% (+8.74)#1,736 |
| 50. | 45771 | 13.6% | 4.2% (+9.41)#50 | 4.9% (+8.74)#1,738 |
| 51. | 45207 | 13.3% | 4.2% (+9.08)#51 | 4.9% (+8.40)#1,831 |
| 52. | 43903 | 13.2% | 4.2% (+8.96)#52 | 4.9% (+8.29)#1,856 |
| 53. | 44050 | 13.1% | 4.2% (+8.94)#53 | 4.9% (+8.26)#1,865 |
| 54. | 43793 | 13.1% | 4.2% (+8.88)#54 | 4.9% (+8.21)#1,885 |
| 55. | 45101 | 12.8% | 4.2% (+8.62)#55 | 4.9% (+7.95)#1,954 |
| 56. | 44887 | 12.7% | 4.2% (+8.49)#56 | 4.9% (+7.81)#1,990 |
| 57. | 43952 | 12.6% | 4.2% (+8.43)#57 | 4.9% (+7.75)#2,007 |
| 58. | 43549 | 12.5% | 4.2% (+8.34)#58 | 4.9% (+7.67)#2,029 |
| 59. | 44449 | 12.5% | 4.2% (+8.26)#59 | 4.9% (+7.59)#2,064 |
| 60. | 44507 | 12.4% | 4.2% (+8.18)#60 | 4.9% (+7.50)#2,088 |
| 61. | 45810 | 12.0% | 4.2% (+7.84)#61 | 4.9% (+7.17)#2,195 |
| 62. | 45384 | 12.0% | 4.2% (+7.84)#62 | 4.9% (+7.16)#2,197 |
| 63. | 44633 | 11.9% | 4.2% (+7.66)#63 | 4.9% (+6.98)#2,248 |
| 64. | 43149 | 11.8% | 4.2% (+7.62)#64 | 4.9% (+6.94)#2,261 |
| 65. | 44624 | 11.8% | 4.2% (+7.60)#65 | 4.9% (+6.93)#2,262 |
| 66. | 45697 | 11.4% | 4.2% (+7.21)#66 | 4.9% (+6.53)#2,393 |
| 67. | 45368 | 11.3% | 4.2% (+7.07)#67 | 4.9% (+6.39)#2,450 |
| 68. | 43526 | 11.3% | 4.2% (+7.05)#68 | 4.9% (+6.38)#2,452 |
| 69. | 43824 | 11.2% | 4.2% (+7.02)#69 | 4.9% (+6.35)#2,465 |
| 70. | 43534 | 11.0% | 4.2% (+6.83)#70 | 4.9% (+6.15)#2,549 |
| 71. | 43022 | 10.9% | 4.2% (+6.72)#71 | 4.9% (+6.05)#2,599 |
| 72. | 43930 | 10.9% | 4.2% (+6.67)#72 | 4.9% (+6.00)#2,613 |
| 73. | 45760 | 10.8% | 4.2% (+6.61)#73 | 4.9% (+5.94)#2,640 |
| 74. | 45168 | 10.7% | 4.2% (+6.54)#74 | 4.9% (+5.87)#2,668 |
| 75. | 45848 | 10.7% | 4.2% (+6.52)#75 | 4.9% (+5.84)#2,694 |
| 76. | 43203 | 10.5% | 4.2% (+6.30)#76 | 4.9% (+5.63)#2,817 |
| 77. | 45619 | 10.5% | 4.2% (+6.26)#77 | 4.9% (+5.59)#2,835 |
| 78. | 43608 | 10.4% | 4.2% (+6.15)#78 | 4.9% (+5.48)#2,890 |
| 79. | 45652 | 10.2% | 4.2% (+6.05)#79 | 4.9% (+5.38)#2,970 |
| 80. | 43609 | 10.2% | 4.2% (+6.01)#80 | 4.9% (+5.34)#2,992 |
| 81. | 44045 | 10.2% | 4.2% (+5.99)#81 | 4.9% (+5.31)#3,006 |
| 82. | 45404 | 10.2% | 4.2% (+5.96)#82 | 4.9% (+5.29)#3,022 |
| 83. | 45232 | 10.1% | 4.2% (+5.95)#83 | 4.9% (+5.28)#3,028 |
| 84. | 44681 | 10.1% | 4.2% (+5.91)#84 | 4.9% (+5.23)#3,058 |
| 85. | 45346 | 10.0% | 4.2% (+5.84)#85 | 4.9% (+5.17)#3,085 |
| 86. | 45106 | 10.0% | 4.2% (+5.82)#86 | 4.9% (+5.15)#3,093 |
| 87. | 44818 | 9.9% | 4.2% (+5.73)#87 | 4.9% (+5.05)#3,148 |
| 88. | 45710 | 9.9% | 4.2% (+5.67)#88 | 4.9% (+5.00)#3,183 |
| 89. | 44106 | 9.8% | 4.2% (+5.65)#89 | 4.9% (+4.97)#3,206 |
| 90. | 44703 | 9.8% | 4.2% (+5.64)#90 | 4.9% (+4.96)#3,211 |
| 91. | 45779 | 9.7% | 4.2% (+5.52)#91 | 4.9% (+4.85)#3,289 |
| 92. | 44430 | 9.7% | 4.2% (+5.50)#92 | 4.9% (+4.82)#3,307 |
| 93. | 45880 | 9.6% | 4.2% (+5.41)#93 | 4.9% (+4.74)#3,368 |
| 94. | 43802 | 9.6% | 4.2% (+5.39)#94 | 4.9% (+4.72)#3,379 |
| 95. | 43932 | 9.5% | 4.2% (+5.33)#95 | 4.9% (+4.65)#3,429 |
| 96. | 45410 | 9.5% | 4.2% (+5.30)#96 | 4.9% (+4.62)#3,459 |
| 97. | 45846 | 9.4% | 4.2% (+5.18)#97 | 4.9% (+4.50)#3,539 |
| 98. | 45204 | 9.3% | 4.2% (+5.14)#98 | 4.9% (+4.46)#3,573 |
| 99. | 45309 | 9.3% | 4.2% (+5.08)#99 | 4.9% (+4.41)#3,619 |
| 100. | 44118 | 9.3% | 4.2% (+5.06)#100 | 4.9% (+4.38)#3,643 |
Common Questions
What are the Top 10 Zip Codes with the Highest Percentage of Population with a Degree in Liberal Arts and History in Ohio?
Top 10 Zip Codes with the Highest Percentage of Population with a Degree in Liberal Arts and History in Ohio are:
What zip code has the Highest Percentage of Population with a Degree in Liberal Arts and History in Ohio?
43972 has the Highest Percentage of Population with a Degree in Liberal Arts and History in Ohio with 100.0%.
What is the Percentage of Population with a Degree in Liberal Arts and History in the State of Ohio?
Percentage of Population with a Degree in Liberal Arts and History in Ohio is 4.2%.
What is the Percentage of Population with a Degree in Liberal Arts and History in the United States?
Percentage of Population with a Degree in Liberal Arts and History in the United States is 4.9%.