Zip Codes with the Highest Percentage of Population with a Degree in Liberal Arts and History in Hamilton, OH
RELATED REPORTS & OPTIONS
Liberal Arts and History
Hamilton
Compare Zip Codes
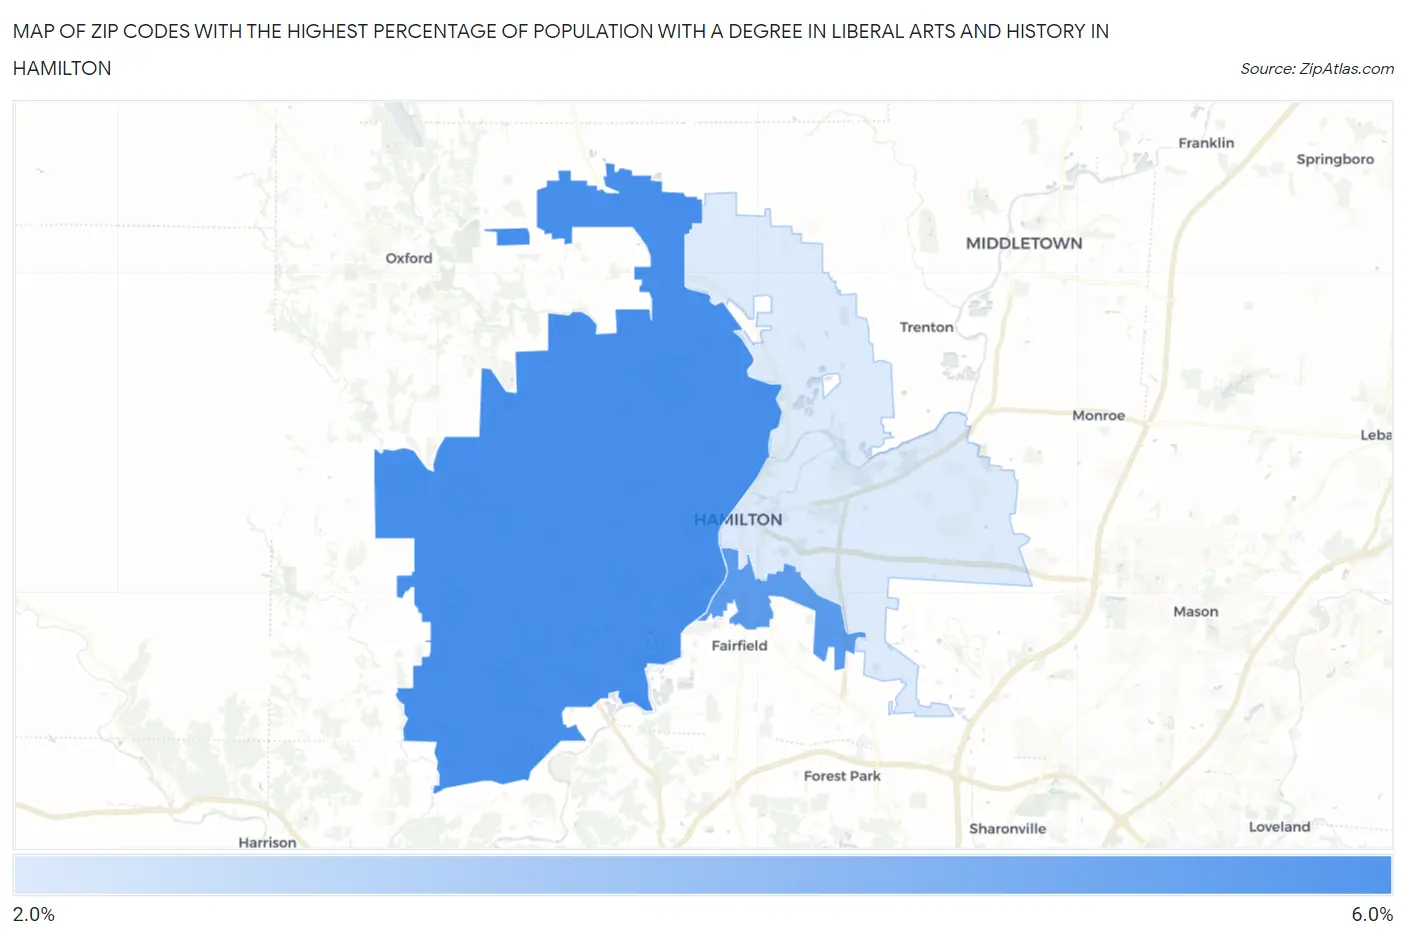
Map of Zip Codes with the Highest Percentage of Population with a Degree in Liberal Arts and History in Hamilton
2.4%
5.8%
Zip Codes with the Highest Percentage of Population with a Degree in Liberal Arts and History in Hamilton, OH
| Zip Code | % Graduates | vs State | vs National | |
| 1. | 45013 | 5.8% | 4.2%(+1.57)#264 | 4.9%(+0.895)#9,125 |
| 2. | 45015 | 5.3% | 4.2%(+1.10)#318 | 4.9%(+0.428)#10,443 |
| 3. | 45011 | 2.4% | 4.2%(-1.81)#693 | 4.9%(-2.48)#20,296 |
1
Common Questions
What are the Top Zip Codes with the Highest Percentage of Population with a Degree in Liberal Arts and History in Hamilton, OH?
Top Zip Codes with the Highest Percentage of Population with a Degree in Liberal Arts and History in Hamilton, OH are:
What zip code has the Highest Percentage of Population with a Degree in Liberal Arts and History in Hamilton, OH?
45013 has the Highest Percentage of Population with a Degree in Liberal Arts and History in Hamilton, OH with 5.8%.
What is the Percentage of Population with a Degree in Liberal Arts and History in Hamilton, OH?
Percentage of Population with a Degree in Liberal Arts and History in Hamilton is 4.5%.
What is the Percentage of Population with a Degree in Liberal Arts and History in Ohio?
Percentage of Population with a Degree in Liberal Arts and History in Ohio is 4.2%.
What is the Percentage of Population with a Degree in Liberal Arts and History in the United States?
Percentage of Population with a Degree in Liberal Arts and History in the United States is 4.9%.