Zip Codes with the Highest Percentage of Population with a Degree in Liberal Arts and History in Strongsville, OH
RELATED REPORTS & OPTIONS
Liberal Arts and History
Strongsville
Compare Zip Codes
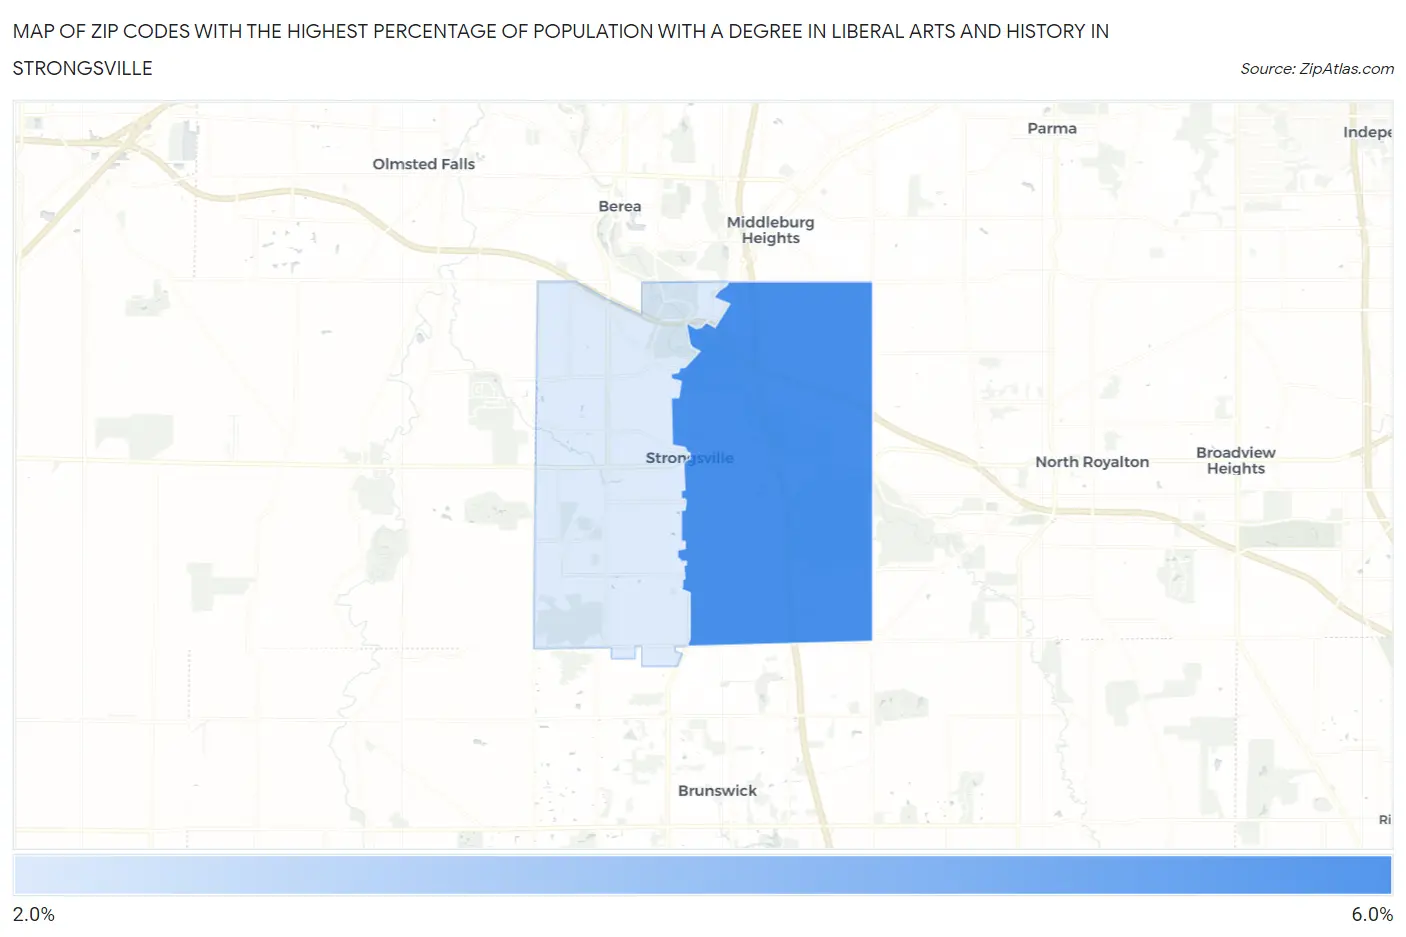
Map of Zip Codes with the Highest Percentage of Population with a Degree in Liberal Arts and History in Strongsville
2.3%
5.6%
Zip Codes with the Highest Percentage of Population with a Degree in Liberal Arts and History in Strongsville, OH
| Zip Code | % Graduates | vs State | vs National | |
| 1. | 44136 | 5.6% | 4.2%(+1.45)#276 | 4.9%(+0.776)#9,437 |
| 2. | 44149 | 2.3% | 4.2%(-1.91)#704 | 4.9%(-2.58)#20,564 |
1
Common Questions
What are the Top Zip Codes with the Highest Percentage of Population with a Degree in Liberal Arts and History in Strongsville, OH?
Top Zip Codes with the Highest Percentage of Population with a Degree in Liberal Arts and History in Strongsville, OH are:
What zip code has the Highest Percentage of Population with a Degree in Liberal Arts and History in Strongsville, OH?
44136 has the Highest Percentage of Population with a Degree in Liberal Arts and History in Strongsville, OH with 5.6%.
What is the Percentage of Population with a Degree in Liberal Arts and History in Strongsville, OH?
Percentage of Population with a Degree in Liberal Arts and History in Strongsville is 4.1%.
What is the Percentage of Population with a Degree in Liberal Arts and History in Ohio?
Percentage of Population with a Degree in Liberal Arts and History in Ohio is 4.2%.
What is the Percentage of Population with a Degree in Liberal Arts and History in the United States?
Percentage of Population with a Degree in Liberal Arts and History in the United States is 4.9%.