Walnut Creek, OH Map & Demographics
Walnut Creek Map
Walnut Creek Overview
$28,584
PER CAPITA INCOME
$91,042
AVG FAMILY INCOME
$86,696
AVG HOUSEHOLD INCOME
55.8%
WAGE / INCOME GAP [ % ]
44.2¢/ $1
WAGE / INCOME GAP [ $ ]
0.40
INEQUALITY / GINI INDEX
1,302
TOTAL POPULATION
713
MALE POPULATION
589
FEMALE POPULATION
121.05
MALES / 100 FEMALES
82.61
FEMALES / 100 MALES
39.5
MEDIAN AGE
3.9
AVG FAMILY SIZE
3.3
AVG HOUSEHOLD SIZE
615
LABOR FORCE [ PEOPLE ]
57.6%
PERCENT IN LABOR FORCE
22.6%
UNEMPLOYMENT RATE
Walnut Creek Zip Codes
Walnut Creek Area Codes
Income in Walnut Creek
Income Overview in Walnut Creek
Per Capita Income in Walnut Creek is $28,584, while median incomes of families and households are $91,042 and $86,696 respectively.
| Characteristic | Number | Measure |
| Per Capita Income | 1,302 | $28,584 |
| Median Family Income | 256 | $91,042 |
| Mean Family Income | 256 | $86,736 |
| Median Household Income | 319 | $86,696 |
| Mean Household Income | 319 | $98,997 |
| Income Deficit | 256 | $0 |
| Wage / Income Gap (%) | 1,302 | 55.78% |
| Wage / Income Gap ($) | 1,302 | 44.22¢ per $1 |
| Gini / Inequality Index | 1,302 | 0.40 |
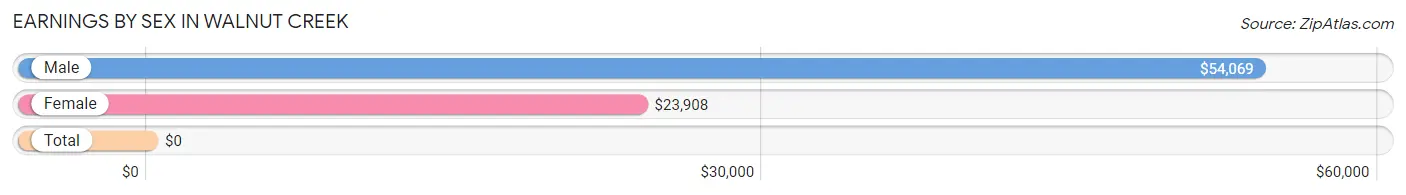
Earnings by Sex in Walnut Creek
| Sex | Number | Average Earnings |
| Male | 397 (60.6%) | $54,069 |
| Female | 258 (39.4%) | $23,908 |
| Total | 655 (100.0%) | $0 |
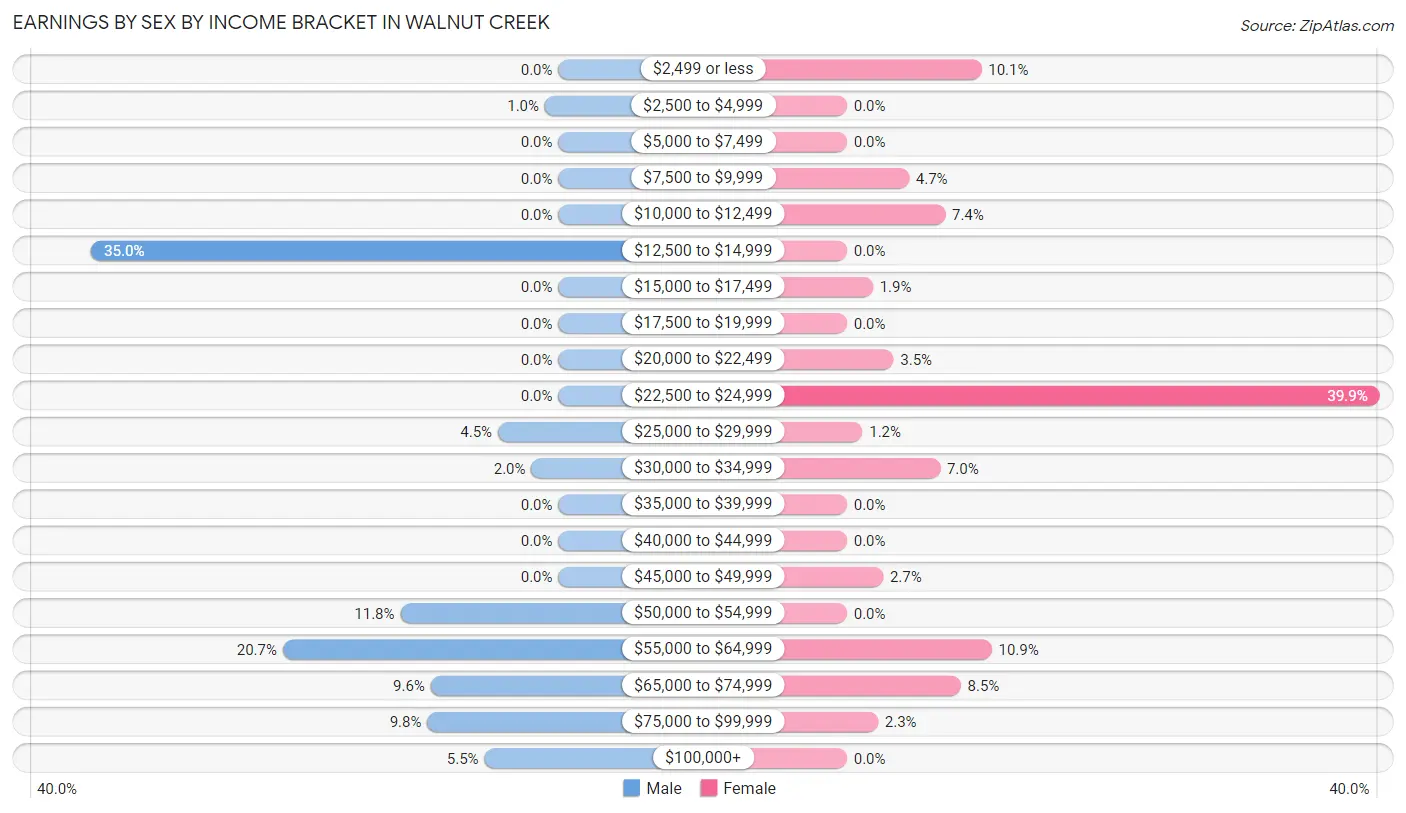
Earnings by Sex by Income Bracket in Walnut Creek
The most common earnings brackets in Walnut Creek are $12,500 to $14,999 for men (139 | 35.0%) and $22,500 to $24,999 for women (103 | 39.9%).
| Income | Male | Female |
| $2,499 or less | 0 (0.0%) | 26 (10.1%) |
| $2,500 to $4,999 | 4 (1.0%) | 0 (0.0%) |
| $5,000 to $7,499 | 0 (0.0%) | 0 (0.0%) |
| $7,500 to $9,999 | 0 (0.0%) | 12 (4.6%) |
| $10,000 to $12,499 | 0 (0.0%) | 19 (7.4%) |
| $12,500 to $14,999 | 139 (35.0%) | 0 (0.0%) |
| $15,000 to $17,499 | 0 (0.0%) | 5 (1.9%) |
| $17,500 to $19,999 | 0 (0.0%) | 0 (0.0%) |
| $20,000 to $22,499 | 0 (0.0%) | 9 (3.5%) |
| $22,500 to $24,999 | 0 (0.0%) | 103 (39.9%) |
| $25,000 to $29,999 | 18 (4.5%) | 3 (1.2%) |
| $30,000 to $34,999 | 8 (2.0%) | 18 (7.0%) |
| $35,000 to $39,999 | 0 (0.0%) | 0 (0.0%) |
| $40,000 to $44,999 | 0 (0.0%) | 0 (0.0%) |
| $45,000 to $49,999 | 0 (0.0%) | 7 (2.7%) |
| $50,000 to $54,999 | 47 (11.8%) | 0 (0.0%) |
| $55,000 to $64,999 | 82 (20.6%) | 28 (10.8%) |
| $65,000 to $74,999 | 38 (9.6%) | 22 (8.5%) |
| $75,000 to $99,999 | 39 (9.8%) | 6 (2.3%) |
| $100,000+ | 22 (5.5%) | 0 (0.0%) |
| Total | 397 (100.0%) | 258 (100.0%) |
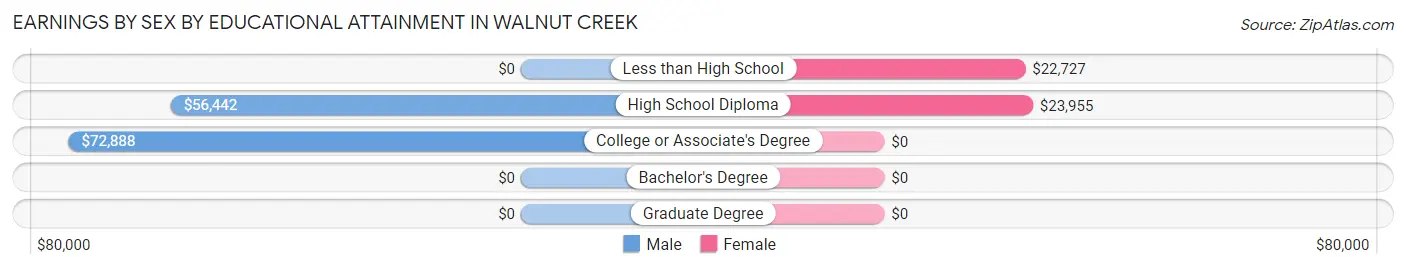
Earnings by Sex by Educational Attainment in Walnut Creek
Average earnings in Walnut Creek are $54,761 for men and $24,224 for women, a difference of 55.8%. Men with an educational attainment of college or associate's degree enjoy the highest average annual earnings of $72,888, while those with high school diploma education earn the least with $56,442. Women with an educational attainment of high school diploma earn the most with the average annual earnings of $23,955, while those with less than high school education have the smallest earnings of $22,727.
| Educational Attainment | Male Income | Female Income |
| Less than High School | - | - |
| High School Diploma | $56,442 | $23,955 |
| College or Associate's Degree | $72,888 | $0 |
| Bachelor's Degree | - | - |
| Graduate Degree | - | - |
| Total | $54,761 | $24,224 |
Family Income in Walnut Creek
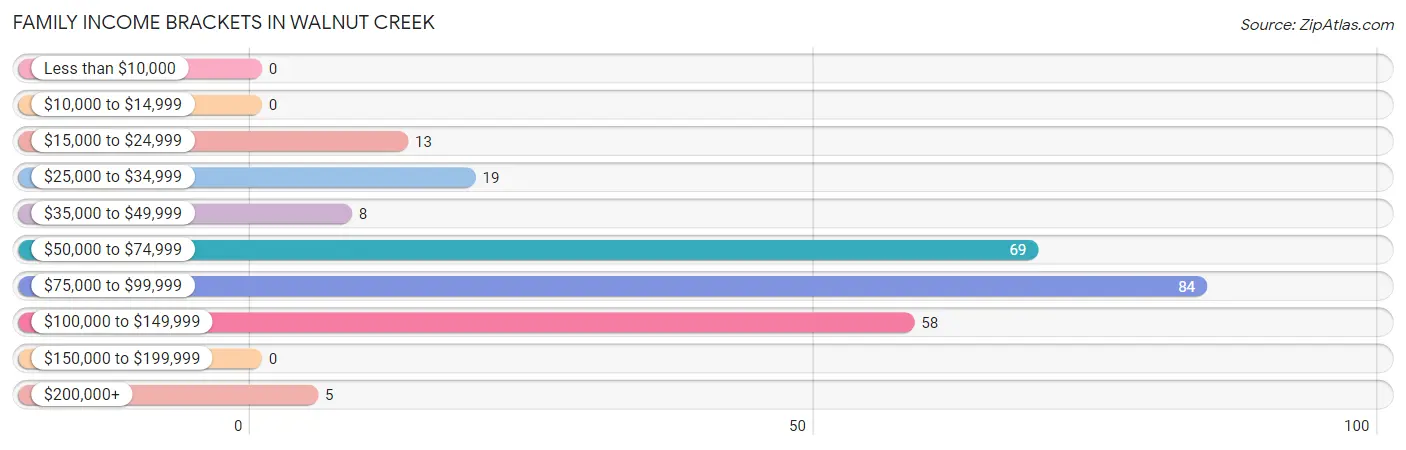
Family Income Brackets in Walnut Creek
According to the Walnut Creek family income data, there are 84 families falling into the $75,000 to $99,999 income range, which is the most common income bracket and makes up 32.8% of all families.
| Income Bracket | # Families | % Families |
| Less than $10,000 | 0 | 0.0% |
| $10,000 to $14,999 | 0 | 0.0% |
| $15,000 to $24,999 | 13 | 5.1% |
| $25,000 to $34,999 | 19 | 7.4% |
| $35,000 to $49,999 | 8 | 3.1% |
| $50,000 to $74,999 | 69 | 27.0% |
| $75,000 to $99,999 | 84 | 32.8% |
| $100,000 to $149,999 | 58 | 22.7% |
| $150,000 to $199,999 | 0 | 0.0% |
| $200,000+ | 5 | 2.0% |
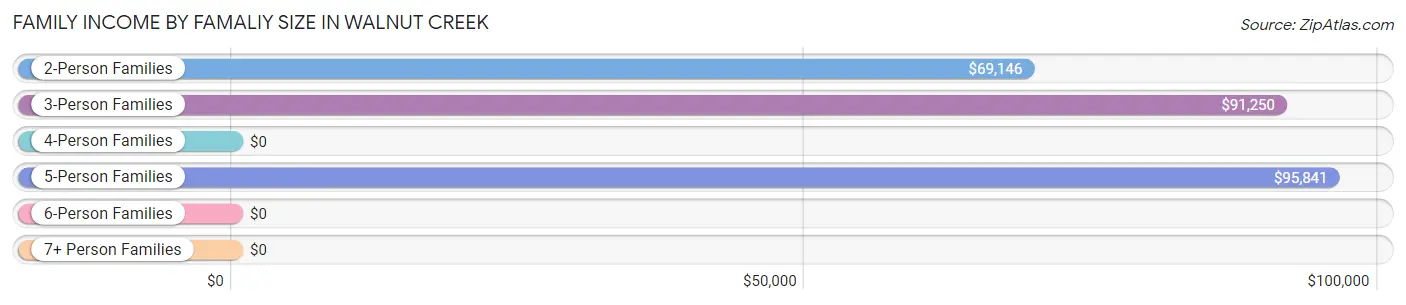
Family Income by Famaliy Size in Walnut Creek
5-person families (79 | 30.9%) account for the highest median family income in Walnut Creek with $95,841 per family, while 2-person families (120 | 46.9%) have the highest median income of $34,573 per family member.
| Income Bracket | # Families | Median Income |
| 2-Person Families | 120 (46.9%) | $69,146 |
| 3-Person Families | 26 (10.2%) | $91,250 |
| 4-Person Families | 0 (0.0%) | $0 |
| 5-Person Families | 79 (30.9%) | $95,841 |
| 6-Person Families | 22 (8.6%) | $0 |
| 7+ Person Families | 9 (3.5%) | $0 |
| Total | 256 (100.0%) | $91,042 |
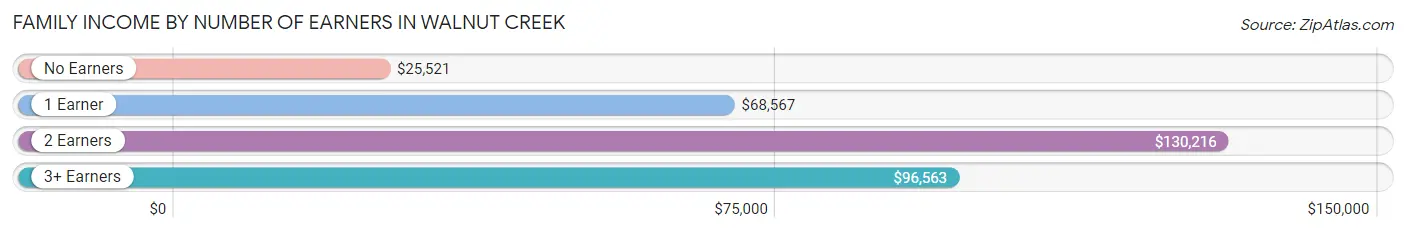
Family Income by Number of Earners in Walnut Creek
The median family income in Walnut Creek is $91,042, with families comprising 2 earners (67) having the highest median family income of $130,216, while families with no earners (31) have the lowest median family income of $25,521, accounting for 26.2% and 12.1% of families, respectively.
| Number of Earners | # Families | Median Income |
| No Earners | 31 (12.1%) | $25,521 |
| 1 Earner | 65 (25.4%) | $68,567 |
| 2 Earners | 67 (26.2%) | $130,216 |
| 3+ Earners | 93 (36.3%) | $96,563 |
| Total | 256 (100.0%) | $91,042 |
Household Income in Walnut Creek
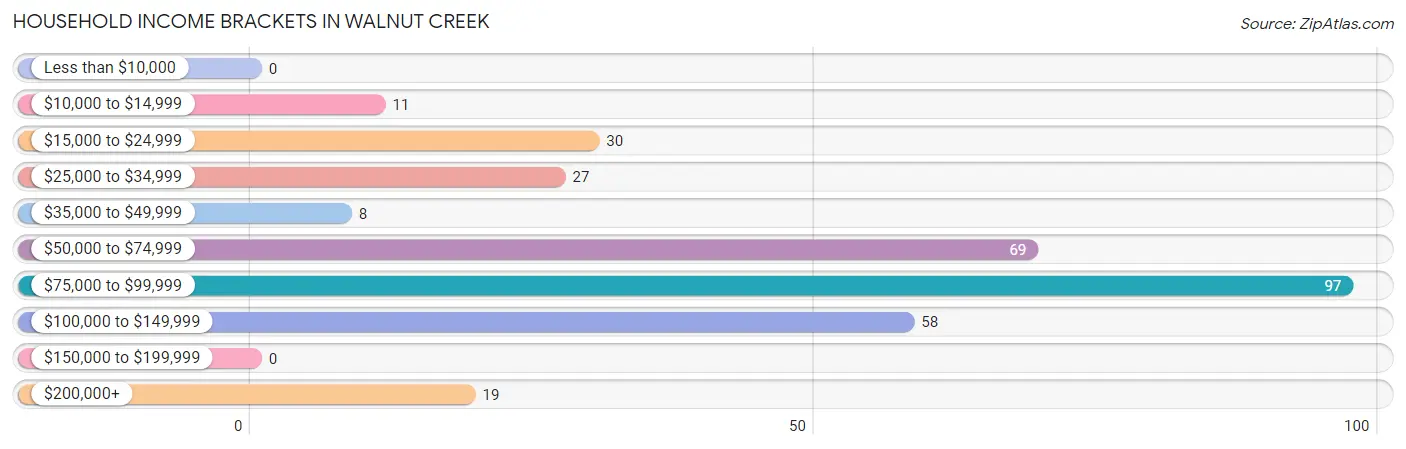
Household Income Brackets in Walnut Creek
With 97 households falling in the category, the $75,000 to $99,999 income range is the most frequent in Walnut Creek, accounting for 30.4% of all households.
| Income Bracket | # Households | % Households |
| Less than $10,000 | 0 | 0.0% |
| $10,000 to $14,999 | 11 | 3.4% |
| $15,000 to $24,999 | 30 | 9.4% |
| $25,000 to $34,999 | 27 | 8.5% |
| $35,000 to $49,999 | 8 | 2.5% |
| $50,000 to $74,999 | 69 | 21.6% |
| $75,000 to $99,999 | 97 | 30.4% |
| $100,000 to $149,999 | 58 | 18.2% |
| $150,000 to $199,999 | 0 | 0.0% |
| $200,000+ | 19 | 6.0% |
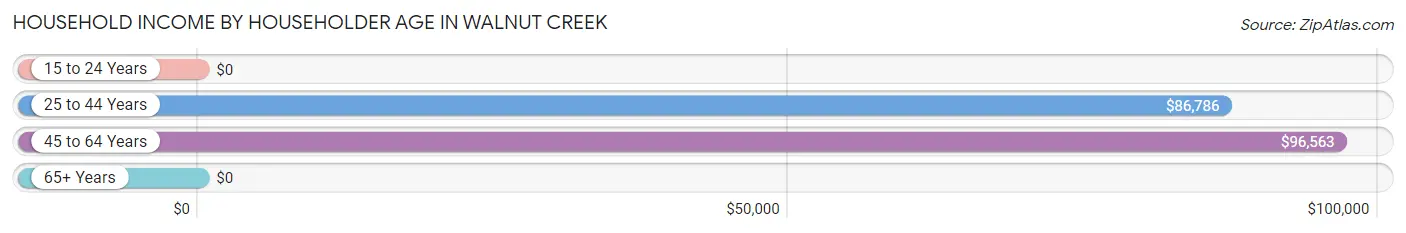
Household Income by Householder Age in Walnut Creek
The median household income in Walnut Creek is $86,696, with the highest median household income of $96,563 found in the 45 to 64 years age bracket for the primary householder. A total of 125 households (39.2%) fall into this category. Meanwhile, the 15 to 24 years age bracket for the primary householder has the lowest median household income of $0, with 8 households (2.5%) in this group.
| Income Bracket | # Households | Median Income |
| 15 to 24 Years | 8 (2.5%) | $0 |
| 25 to 44 Years | 76 (23.8%) | $86,786 |
| 45 to 64 Years | 125 (39.2%) | $96,563 |
| 65+ Years | 110 (34.5%) | $0 |
| Total | 319 (100.0%) | $86,696 |
Poverty in Walnut Creek
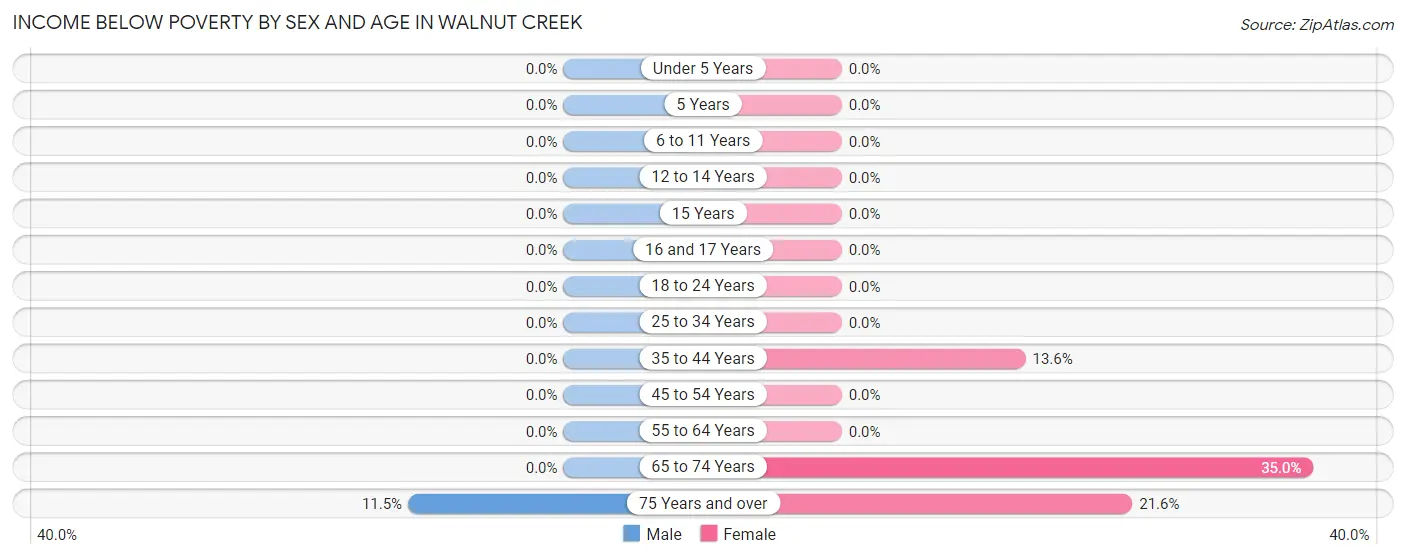
Income Below Poverty by Sex and Age in Walnut Creek
With 1.1% poverty level for males and 5.3% for females among the residents of Walnut Creek, 75 year old and over males and 65 to 74 year old females are the most vulnerable to poverty, with 6 males (11.5%) and 7 females (35.0%) in their respective age groups living below the poverty level.
| Age Bracket | Male | Female |
| Under 5 Years | 0 (0.0%) | 0 (0.0%) |
| 5 Years | 0 (0.0%) | 0 (0.0%) |
| 6 to 11 Years | 0 (0.0%) | 0 (0.0%) |
| 12 to 14 Years | 0 (0.0%) | 0 (0.0%) |
| 15 Years | 0 (0.0%) | 0 (0.0%) |
| 16 and 17 Years | 0 (0.0%) | 0 (0.0%) |
| 18 to 24 Years | 0 (0.0%) | 0 (0.0%) |
| 25 to 34 Years | 0 (0.0%) | 0 (0.0%) |
| 35 to 44 Years | 0 (0.0%) | 9 (13.6%) |
| 45 to 54 Years | 0 (0.0%) | 0 (0.0%) |
| 55 to 64 Years | 0 (0.0%) | 0 (0.0%) |
| 65 to 74 Years | 0 (0.0%) | 7 (35.0%) |
| 75 Years and over | 6 (11.5%) | 11 (21.6%) |
| Total | 6 (1.1%) | 27 (5.3%) |
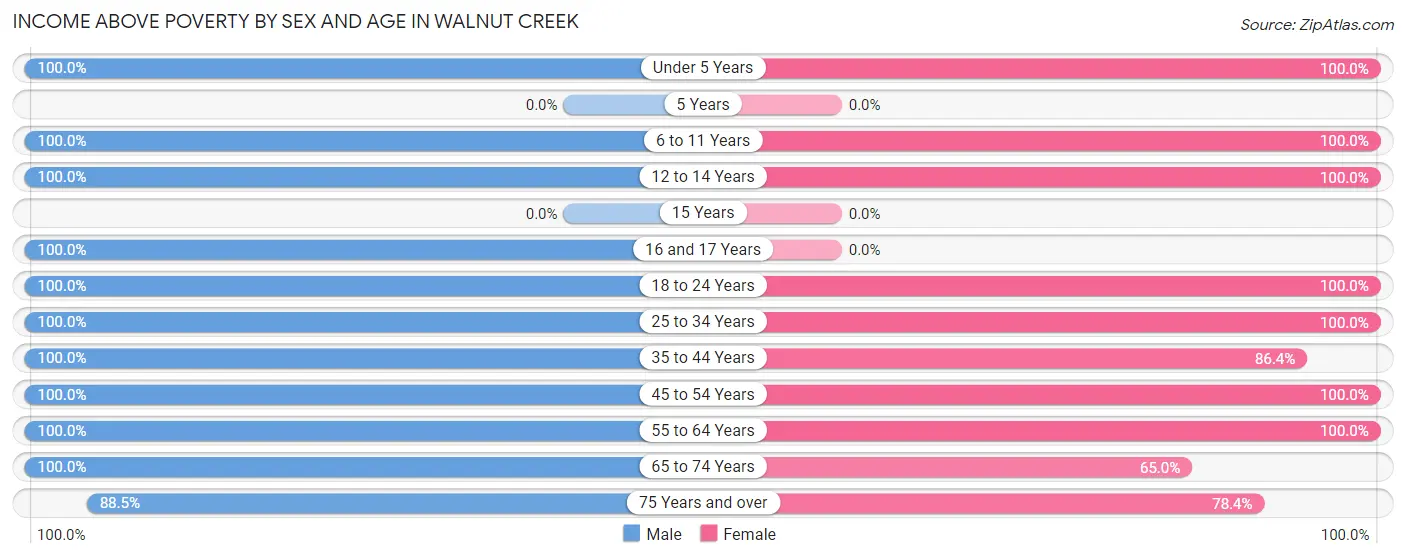
Income Above Poverty by Sex and Age in Walnut Creek
According to the poverty statistics in Walnut Creek, males aged under 5 years and females aged under 5 years are the age groups that are most secure financially, with 100.0% of males and 100.0% of females in these age groups living above the poverty line.
| Age Bracket | Male | Female |
| Under 5 Years | 7 (100.0%) | 67 (100.0%) |
| 5 Years | 0 (0.0%) | 0 (0.0%) |
| 6 to 11 Years | 68 (100.0%) | 49 (100.0%) |
| 12 to 14 Years | 7 (100.0%) | 37 (100.0%) |
| 15 Years | 0 (0.0%) | 0 (0.0%) |
| 16 and 17 Years | 14 (100.0%) | 0 (0.0%) |
| 18 to 24 Years | 52 (100.0%) | 37 (100.0%) |
| 25 to 34 Years | 150 (100.0%) | 92 (100.0%) |
| 35 to 44 Years | 66 (100.0%) | 57 (86.4%) |
| 45 to 54 Years | 20 (100.0%) | 37 (100.0%) |
| 55 to 64 Years | 88 (100.0%) | 52 (100.0%) |
| 65 to 74 Years | 26 (100.0%) | 13 (65.0%) |
| 75 Years and over | 46 (88.5%) | 40 (78.4%) |
| Total | 544 (98.9%) | 481 (94.7%) |
Income Below Poverty Among Married-Couple Families in Walnut Creek
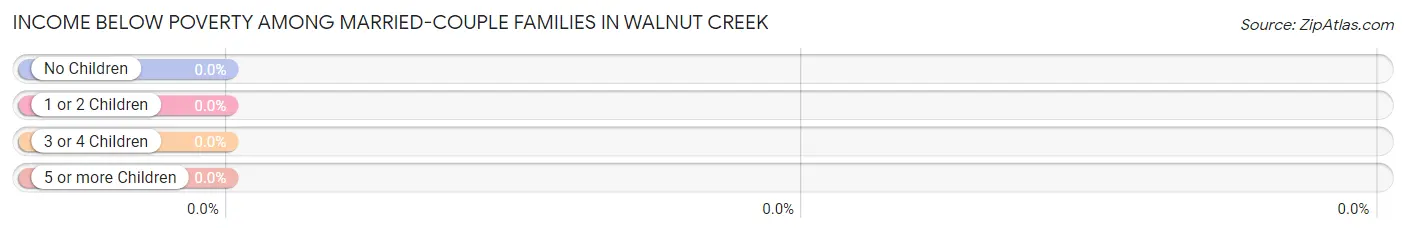
| Children | Above Poverty | Below Poverty |
| No Children | 98 (100.0%) | 0 (0.0%) |
| 1 or 2 Children | 48 (100.0%) | 0 (0.0%) |
| 3 or 4 Children | 8 (100.0%) | 0 (0.0%) |
| 5 or more Children | 9 (100.0%) | 0 (0.0%) |
| Total | 163 (100.0%) | 0 (0.0%) |
Income Below Poverty Among Single-Parent Households in Walnut Creek
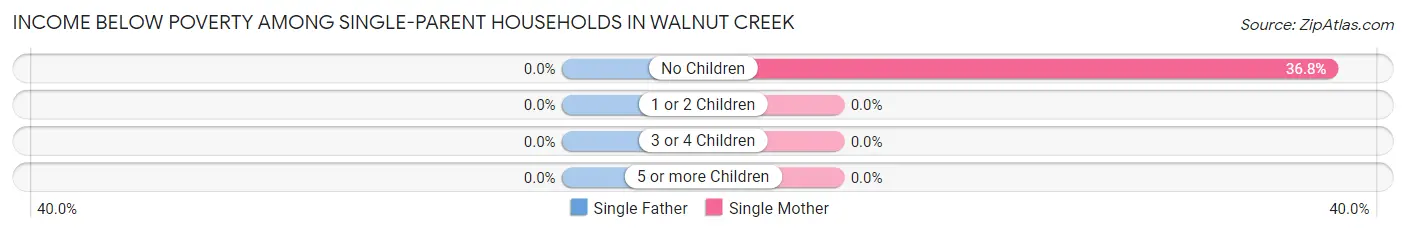
| Children | Single Father | Single Mother |
| No Children | 0 (0.0%) | 7 (36.8%) |
| 1 or 2 Children | 0 (0.0%) | 0 (0.0%) |
| 3 or 4 Children | 0 (0.0%) | 0 (0.0%) |
| 5 or more Children | 0 (0.0%) | 0 (0.0%) |
| Total | 0 (0.0%) | 7 (17.1%) |
Income Below Poverty Among Married-Couple vs Single-Parent Households in Walnut Creek
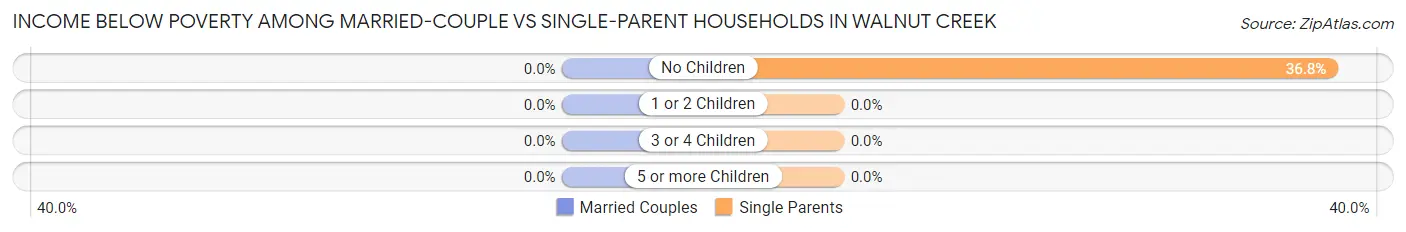
| Children | Married-Couple Families | Single-Parent Households |
| No Children | 0 (0.0%) | 7 (36.8%) |
| 1 or 2 Children | 0 (0.0%) | 0 (0.0%) |
| 3 or 4 Children | 0 (0.0%) | 0 (0.0%) |
| 5 or more Children | 0 (0.0%) | 0 (0.0%) |
| Total | 0 (0.0%) | 7 (7.5%) |
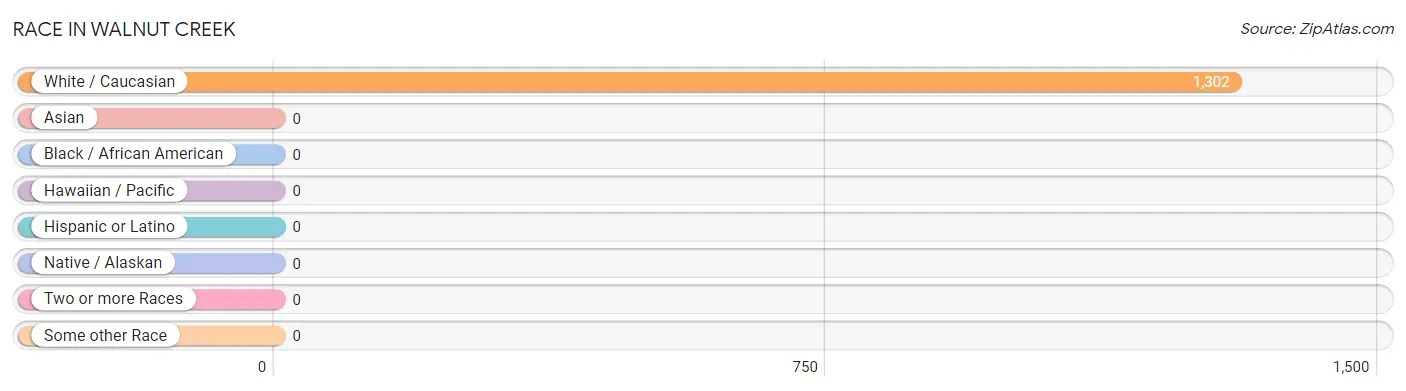
Race in Walnut Creek
The most populous races in Walnut Creek are , and White / Caucasian (1,302 | 100.0%).
| Race | # Population | % Population |
| Asian | 0 | 0.0% |
| Black / African American | 0 | 0.0% |
| Hawaiian / Pacific | 0 | 0.0% |
| Hispanic or Latino | 0 | 0.0% |
| Native / Alaskan | 0 | 0.0% |
| White / Caucasian | 1,302 | 100.0% |
| Two or more Races | 0 | 0.0% |
| Some other Race | 0 | 0.0% |
| Total | 1,302 | 100.0% |
Ancestry in Walnut Creek
The most populous ancestries reported in Walnut Creek are German (694 | 53.3%), Swiss (442 | 34.0%), English (64 | 4.9%), American (41 | 3.2%), and Scottish (35 | 2.7%), together accounting for 98.0% of all Walnut Creek residents.
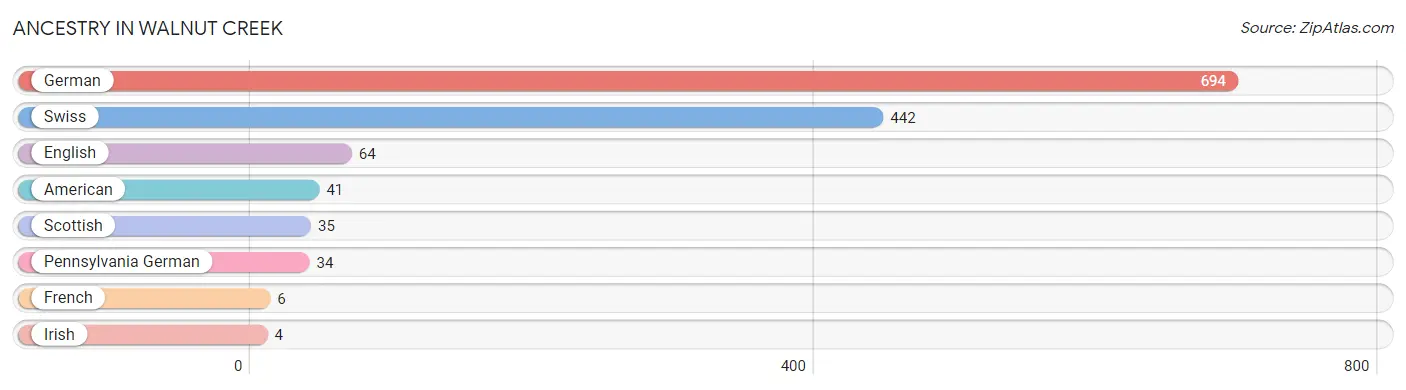
| Ancestry | # Population | % Population |
| American | 41 | 3.2% |
| English | 64 | 4.9% |
| French | 6 | 0.5% |
| German | 694 | 53.3% |
| Irish | 4 | 0.3% |
| Pennsylvania German | 34 | 2.6% |
| Scottish | 35 | 2.7% |
| Swiss | 442 | 34.0% | View All 8 Rows |
Immigrants in Walnut Creek

| Immigration Origin | # Population | % Population | View All 0 Rows |
Sex and Age in Walnut Creek
Sex and Age in Walnut Creek
The most populous age groups in Walnut Creek are 25 to 29 Years (150 | 21.0%) for men and 25 to 29 Years (89 | 15.1%) for women.
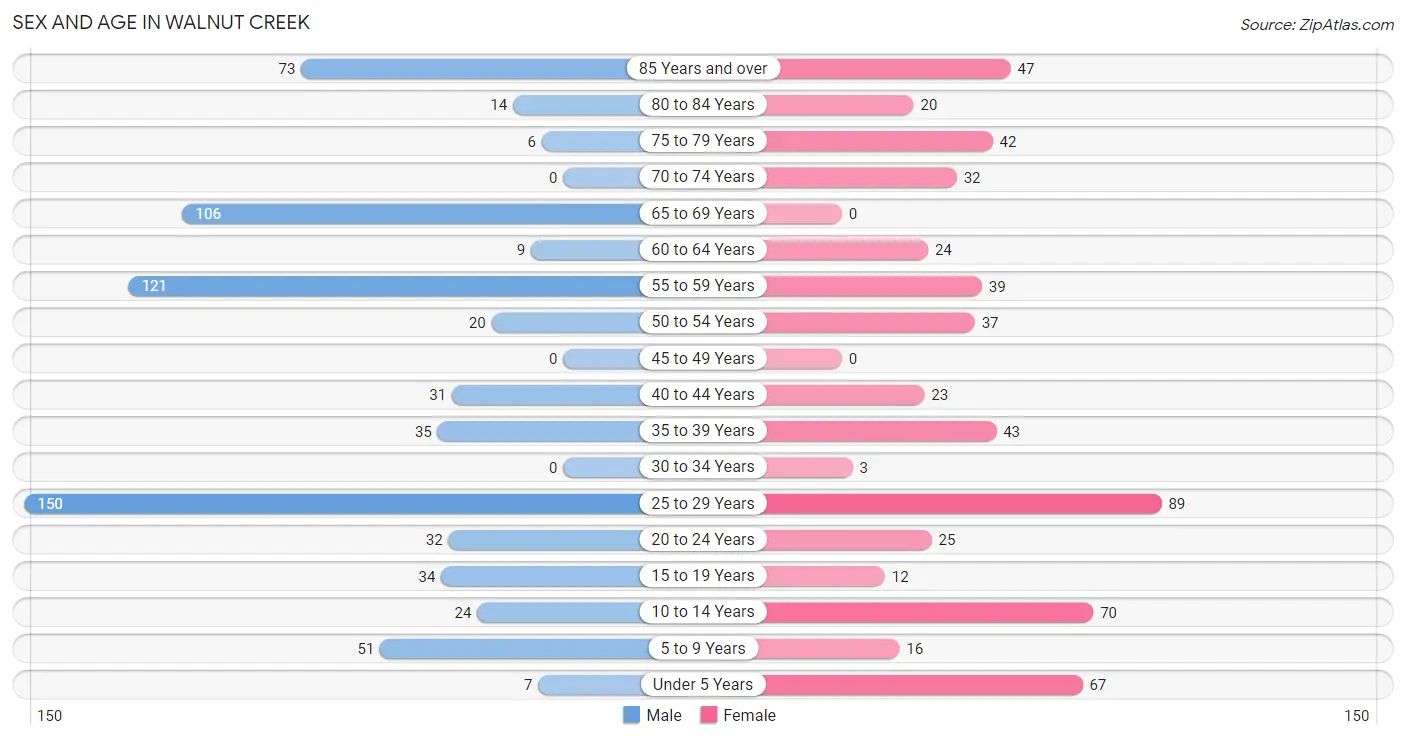
| Age Bracket | Male | Female |
| Under 5 Years | 7 (1.0%) | 67 (11.4%) |
| 5 to 9 Years | 51 (7.1%) | 16 (2.7%) |
| 10 to 14 Years | 24 (3.4%) | 70 (11.9%) |
| 15 to 19 Years | 34 (4.8%) | 12 (2.0%) |
| 20 to 24 Years | 32 (4.5%) | 25 (4.2%) |
| 25 to 29 Years | 150 (21.0%) | 89 (15.1%) |
| 30 to 34 Years | 0 (0.0%) | 3 (0.5%) |
| 35 to 39 Years | 35 (4.9%) | 43 (7.3%) |
| 40 to 44 Years | 31 (4.3%) | 23 (3.9%) |
| 45 to 49 Years | 0 (0.0%) | 0 (0.0%) |
| 50 to 54 Years | 20 (2.8%) | 37 (6.3%) |
| 55 to 59 Years | 121 (17.0%) | 39 (6.6%) |
| 60 to 64 Years | 9 (1.3%) | 24 (4.1%) |
| 65 to 69 Years | 106 (14.9%) | 0 (0.0%) |
| 70 to 74 Years | 0 (0.0%) | 32 (5.4%) |
| 75 to 79 Years | 6 (0.8%) | 42 (7.1%) |
| 80 to 84 Years | 14 (2.0%) | 20 (3.4%) |
| 85 Years and over | 73 (10.2%) | 47 (8.0%) |
| Total | 713 (100.0%) | 589 (100.0%) |
Families and Households in Walnut Creek
Median Family Size in Walnut Creek
The median family size in Walnut Creek is 3.86 persons per family, with single male/father families (52 | 20.3%) accounting for the largest median family size of 6.79 persons per family. On the other hand, single female/mother families (41 | 16.0%) represent the smallest median family size with 2.59 persons per family.
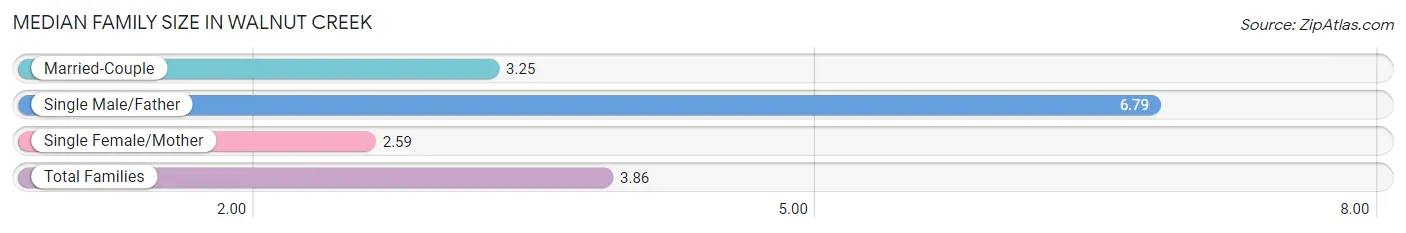
| Family Type | # Families | Family Size |
| Married-Couple | 163 (63.7%) | 3.25 |
| Single Male/Father | 52 (20.3%) | 6.79 |
| Single Female/Mother | 41 (16.0%) | 2.59 |
| Total Families | 256 (100.0%) | 3.86 |
Median Household Size in Walnut Creek
The median household size in Walnut Creek is 3.32 persons per household, with single male/father households (52 | 16.3%) accounting for the largest median household size of 6.79 persons per household. non-family households (63 | 19.8%) represent the smallest median household size with 1.10 persons per household.
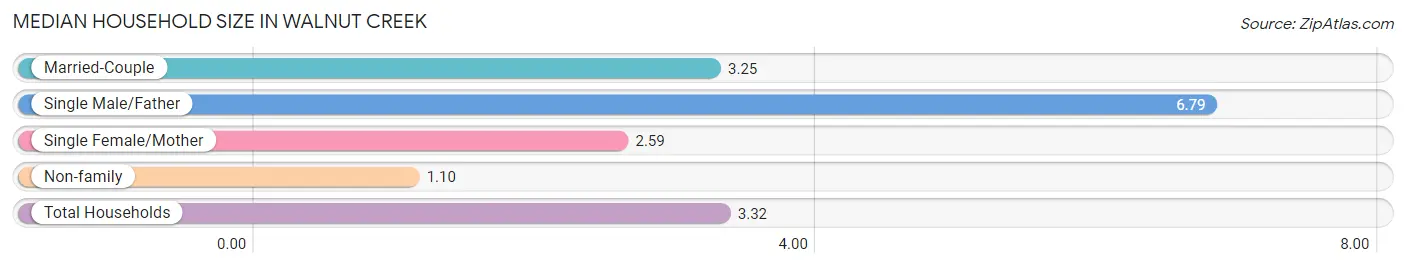
| Household Type | # Households | Household Size |
| Married-Couple | 163 (51.1%) | 3.25 |
| Single Male/Father | 52 (16.3%) | 6.79 |
| Single Female/Mother | 41 (12.9%) | 2.59 |
| Non-family | 63 (19.8%) | 1.10 |
| Total Households | 319 (100.0%) | 3.32 |
Household Size by Marriage Status in Walnut Creek
Out of a total of 319 households in Walnut Creek, 256 (80.2%) are family households, while 63 (19.8%) are nonfamily households. The most numerous type of family households are 2-person households, comprising 120, and the most common type of nonfamily households are 1-person households, comprising 56.
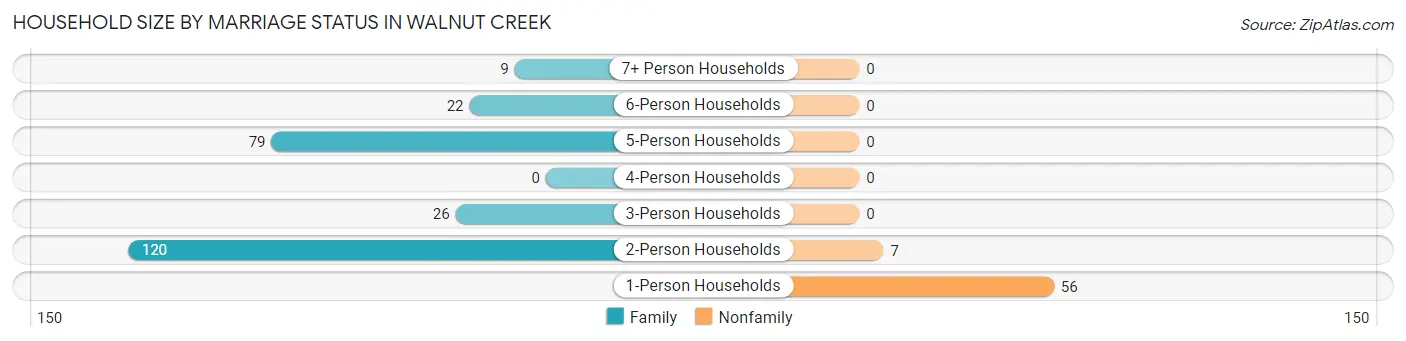
| Household Size | Family Households | Nonfamily Households |
| 1-Person Households | - | 56 (17.5%) |
| 2-Person Households | 120 (37.6%) | 7 (2.2%) |
| 3-Person Households | 26 (8.2%) | 0 (0.0%) |
| 4-Person Households | 0 (0.0%) | 0 (0.0%) |
| 5-Person Households | 79 (24.8%) | 0 (0.0%) |
| 6-Person Households | 22 (6.9%) | 0 (0.0%) |
| 7+ Person Households | 9 (2.8%) | 0 (0.0%) |
| Total | 256 (80.2%) | 63 (19.8%) |
Female Fertility in Walnut Creek
Fertility by Age in Walnut Creek
Average fertility rate in Walnut Creek is 46.0 births per 1,000 women. Women in the age bracket of 35 to 50 years have the highest fertility rate with 136.0 births per 1,000 women. Women in the age bracket of 35 to 50 years acount for 100.0% of all women with births.
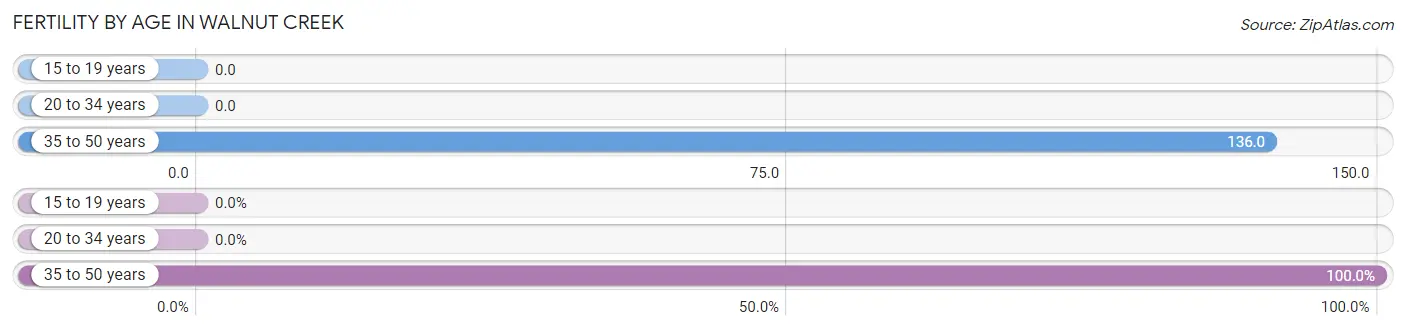
| Age Bracket | Women with Births | Births / 1,000 Women |
| 15 to 19 years | 0 (0.0%) | 0.0 |
| 20 to 34 years | 0 (0.0%) | 0.0 |
| 35 to 50 years | 9 (100.0%) | 136.0 |
| Total | 9 (100.0%) | 46.0 |
Fertility by Age by Marriage Status in Walnut Creek
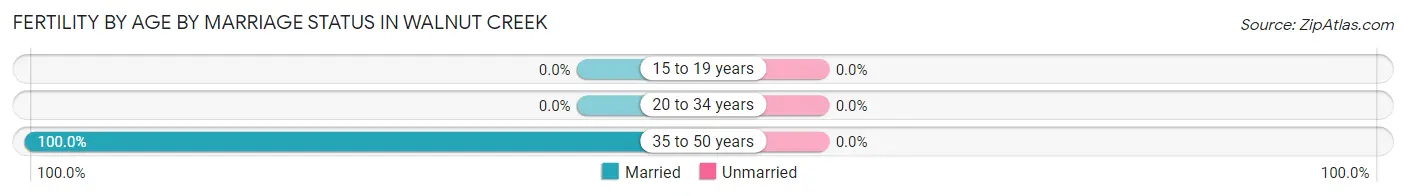
| Age Bracket | Married | Unmarried |
| 15 to 19 years | 0 (0.0%) | 0 (0.0%) |
| 20 to 34 years | 0 (0.0%) | 0 (0.0%) |
| 35 to 50 years | 9 (100.0%) | 0 (0.0%) |
| Total | 9 (100.0%) | 0 (0.0%) |
Fertility by Education in Walnut Creek
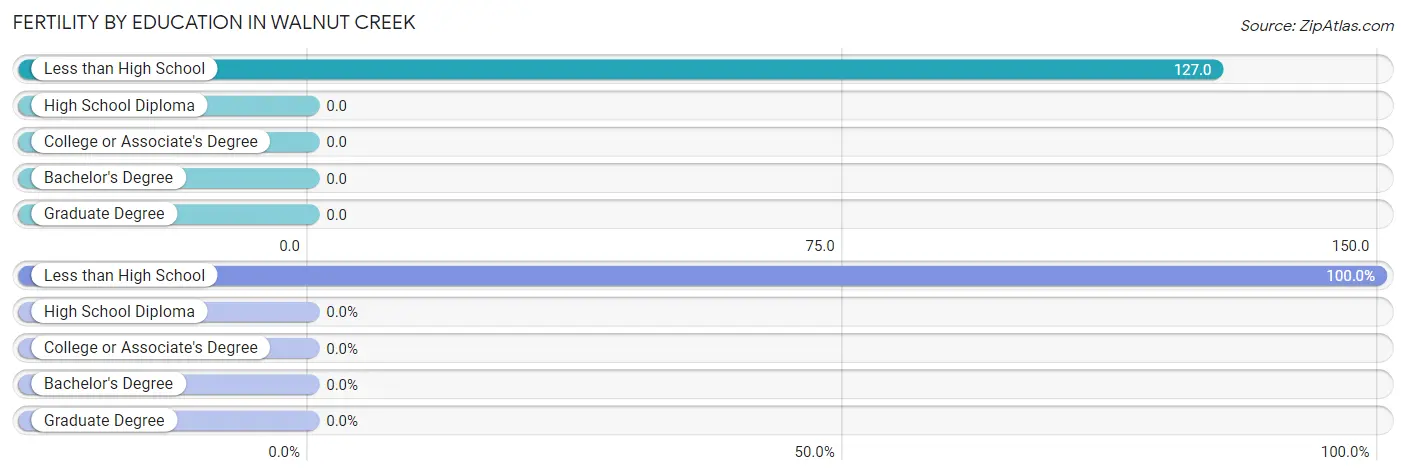
| Educational Attainment | Women with Births | Births / 1,000 Women |
| Less than High School | 9 (100.0%) | 127.0 |
| High School Diploma | 0 (0.0%) | 0.0 |
| College or Associate's Degree | 0 (0.0%) | 0.0 |
| Bachelor's Degree | 0 (0.0%) | 0.0 |
| Graduate Degree | 0 (0.0%) | 0.0 |
| Total | 9 (100.0%) | 46.0 |
Fertility by Education by Marriage Status in Walnut Creek
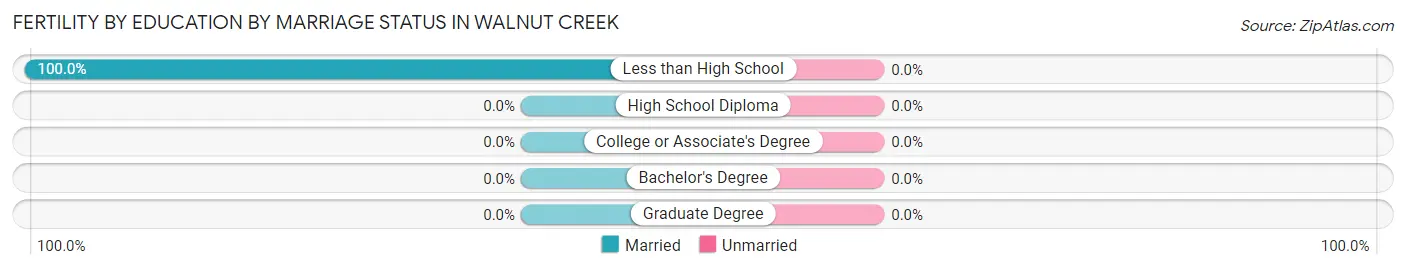
| Educational Attainment | Married | Unmarried |
| Less than High School | 9 (100.0%) | 0 (0.0%) |
| High School Diploma | 0 (0.0%) | 0 (0.0%) |
| College or Associate's Degree | 0 (0.0%) | 0 (0.0%) |
| Bachelor's Degree | 0 (0.0%) | 0 (0.0%) |
| Graduate Degree | 0 (0.0%) | 0 (0.0%) |
| Total | 9 (100.0%) | 0 (0.0%) |
Employment Characteristics in Walnut Creek
Employment by Class of Employer in Walnut Creek
Among the 476 employed individuals in Walnut Creek, private company employees (313 | 65.8%), self-employed (incorporated) (59 | 12.4%), and local government employees (50 | 10.5%) make up the most common classes of employment.
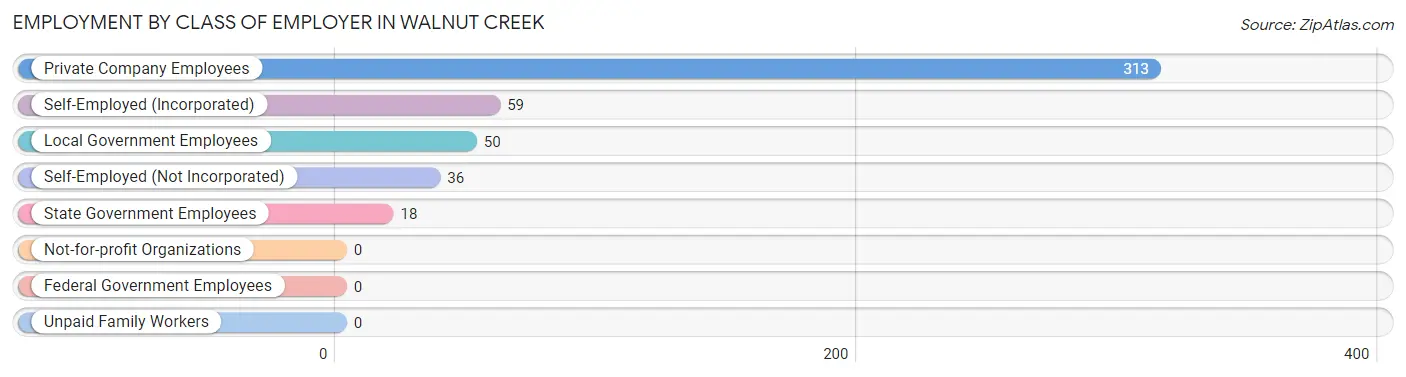
| Employer Class | # Employees | % Employees |
| Private Company Employees | 313 | 65.8% |
| Self-Employed (Incorporated) | 59 | 12.4% |
| Self-Employed (Not Incorporated) | 36 | 7.6% |
| Not-for-profit Organizations | 0 | 0.0% |
| Local Government Employees | 50 | 10.5% |
| State Government Employees | 18 | 3.8% |
| Federal Government Employees | 0 | 0.0% |
| Unpaid Family Workers | 0 | 0.0% |
| Total | 476 | 100.0% |
Employment Status by Age in Walnut Creek
According to the labor force statistics for Walnut Creek, out of the total population over 16 years of age (1,067), 57.6% or 615 individuals are in the labor force, with 22.6% or 139 of them unemployed. The age group with the highest labor force participation rate is 30 to 34 years, with 100.0% or 3 individuals in the labor force. Within the labor force, the 25 to 29 years age range has the highest percentage of unemployed individuals, with 59.9% or 139 of them being unemployed.
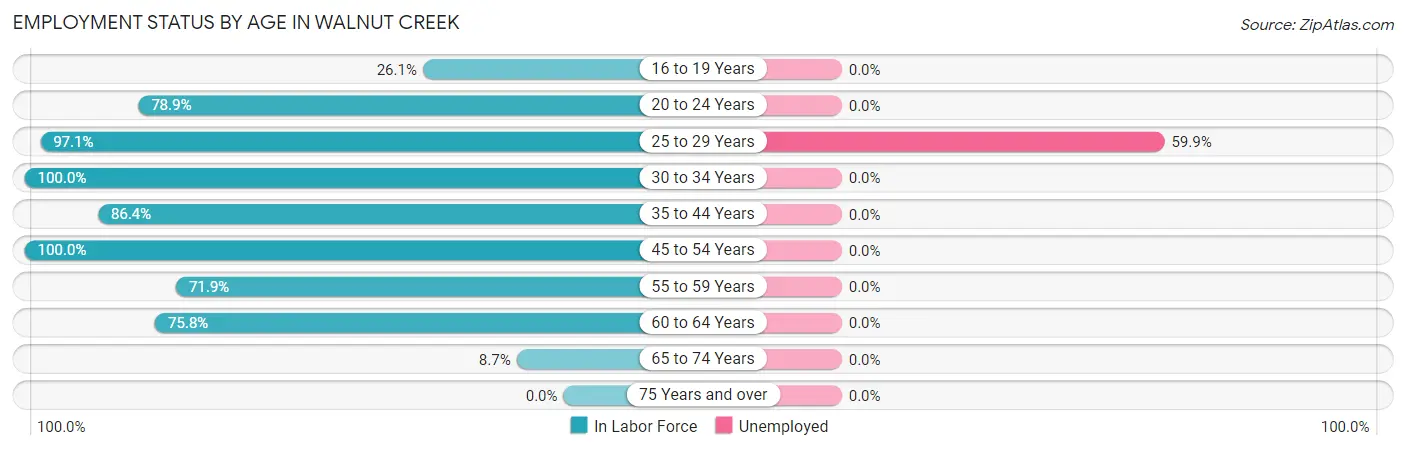
| Age Bracket | In Labor Force | Unemployed |
| 16 to 19 Years | 12 (26.1%) | 0 (0.0%) |
| 20 to 24 Years | 45 (78.9%) | 0 (0.0%) |
| 25 to 29 Years | 232 (97.1%) | 139 (59.9%) |
| 30 to 34 Years | 3 (100.0%) | 0 (0.0%) |
| 35 to 44 Years | 114 (86.4%) | 0 (0.0%) |
| 45 to 54 Years | 57 (100.0%) | 0 (0.0%) |
| 55 to 59 Years | 115 (71.9%) | 0 (0.0%) |
| 60 to 64 Years | 25 (75.8%) | 0 (0.0%) |
| 65 to 74 Years | 12 (8.7%) | 0 (0.0%) |
| 75 Years and over | 0 (0.0%) | 0 (0.0%) |
| Total | 615 (57.6%) | 139 (22.6%) |
Employment Status by Educational Attainment in Walnut Creek
According to labor force statistics for Walnut Creek, 87.5% of individuals (546) out of the total population between 25 and 64 years of age (624) are in the labor force, with 25.5% or 139 of them being unemployed. The group with the highest labor force participation rate are those with the educational attainment of bachelor's degree or higher, with 100.0% or 57 individuals in the labor force. Within the labor force, individuals with less than high school education have the highest percentage of unemployment, with 58.9% or 139 of them being unemployed.
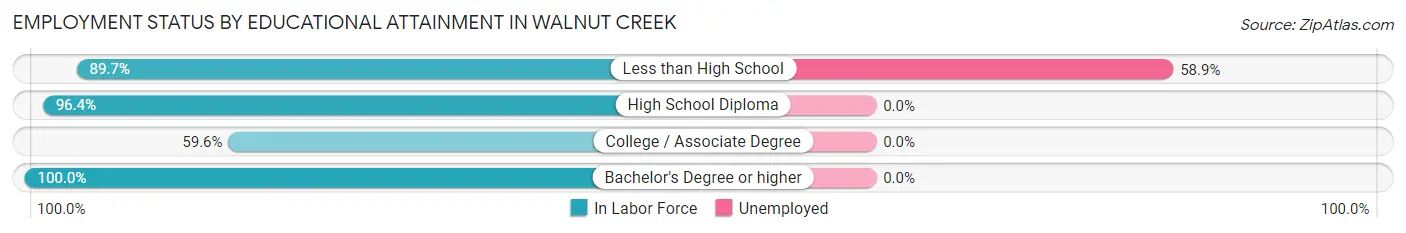
| Educational Attainment | In Labor Force | Unemployed |
| Less than High School | 236 (89.7%) | 155 (58.9%) |
| High School Diploma | 188 (96.4%) | 0 (0.0%) |
| College / Associate Degree | 65 (59.6%) | 0 (0.0%) |
| Bachelor's Degree or higher | 57 (100.0%) | 0 (0.0%) |
| Total | 546 (87.5%) | 159 (25.5%) |
Employment Occupations by Sex in Walnut Creek
Management, Business, Science and Arts Occupations
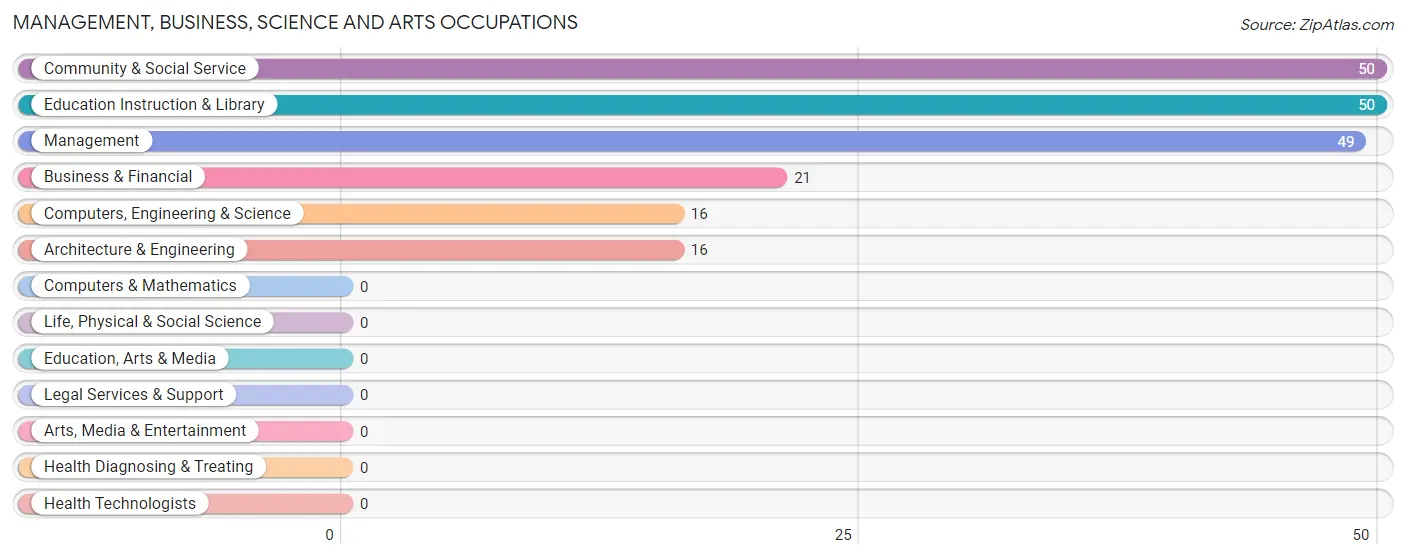
The most common Management, Business, Science and Arts occupations in Walnut Creek are Community & Social Service (50 | 10.5%), Education Instruction & Library (50 | 10.5%), Management (49 | 10.3%), Business & Financial (21 | 4.4%), and Computers, Engineering & Science (16 | 3.4%).
Management, Business, Science and Arts Occupations by Sex
Within the Management, Business, Science and Arts occupations in Walnut Creek, the most male-oriented occupations are Management (100.0%), Computers, Engineering & Science (100.0%), and Architecture & Engineering (100.0%), while the most female-oriented occupations are Community & Social Service (100.0%), Education Instruction & Library (100.0%), and Business & Financial (28.6%).
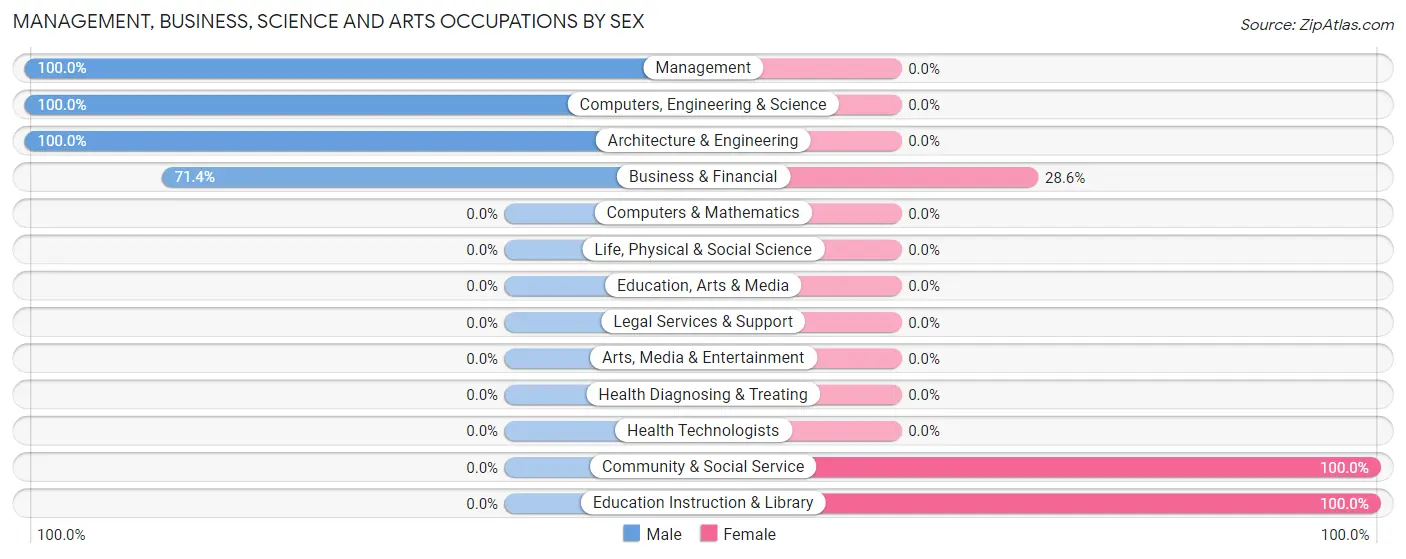
| Occupation | Male | Female |
| Management | 49 (100.0%) | 0 (0.0%) |
| Business & Financial | 15 (71.4%) | 6 (28.6%) |
| Computers, Engineering & Science | 16 (100.0%) | 0 (0.0%) |
| Computers & Mathematics | 0 (0.0%) | 0 (0.0%) |
| Architecture & Engineering | 16 (100.0%) | 0 (0.0%) |
| Life, Physical & Social Science | 0 (0.0%) | 0 (0.0%) |
| Community & Social Service | 0 (0.0%) | 50 (100.0%) |
| Education, Arts & Media | 0 (0.0%) | 0 (0.0%) |
| Legal Services & Support | 0 (0.0%) | 0 (0.0%) |
| Education Instruction & Library | 0 (0.0%) | 50 (100.0%) |
| Arts, Media & Entertainment | 0 (0.0%) | 0 (0.0%) |
| Health Diagnosing & Treating | 0 (0.0%) | 0 (0.0%) |
| Health Technologists | 0 (0.0%) | 0 (0.0%) |
| Total (Category) | 80 (58.8%) | 56 (41.2%) |
| Total (Overall) | 218 (45.8%) | 258 (54.2%) |
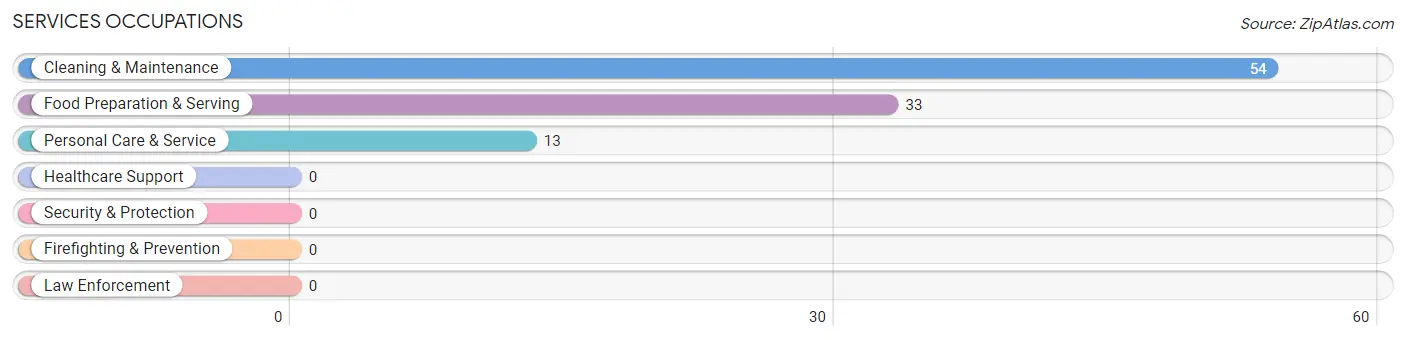
Services Occupations
The most common Services occupations in Walnut Creek are Cleaning & Maintenance (54 | 11.3%), Food Preparation & Serving (33 | 6.9%), and Personal Care & Service (13 | 2.7%).
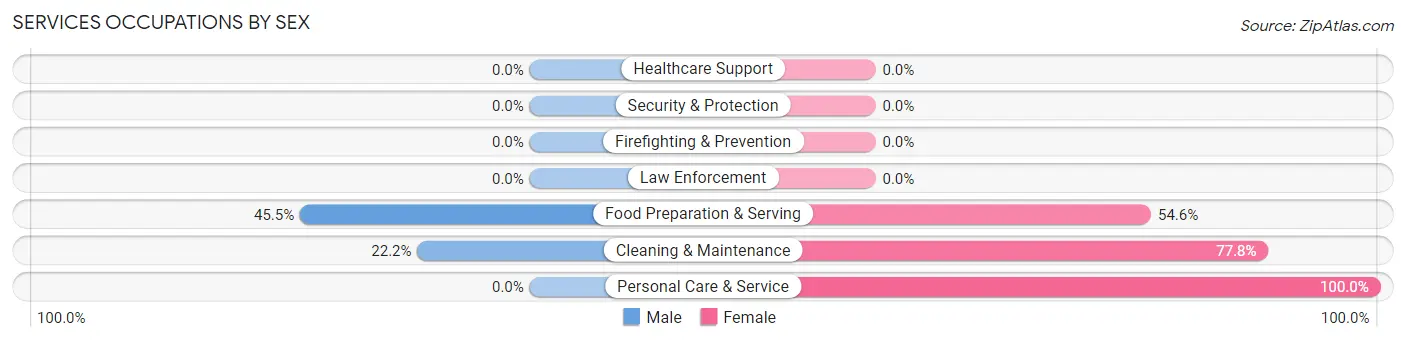
Services Occupations by Sex
Within the Services occupations in Walnut Creek, the most male-oriented occupations are Food Preparation & Serving (45.5%), and Cleaning & Maintenance (22.2%), while the most female-oriented occupations are Personal Care & Service (100.0%), Cleaning & Maintenance (77.8%), and Food Preparation & Serving (54.5%).
| Occupation | Male | Female |
| Healthcare Support | 0 (0.0%) | 0 (0.0%) |
| Security & Protection | 0 (0.0%) | 0 (0.0%) |
| Firefighting & Prevention | 0 (0.0%) | 0 (0.0%) |
| Law Enforcement | 0 (0.0%) | 0 (0.0%) |
| Food Preparation & Serving | 15 (45.5%) | 18 (54.5%) |
| Cleaning & Maintenance | 12 (22.2%) | 42 (77.8%) |
| Personal Care & Service | 0 (0.0%) | 13 (100.0%) |
| Total (Category) | 27 (27.0%) | 73 (73.0%) |
| Total (Overall) | 218 (45.8%) | 258 (54.2%) |
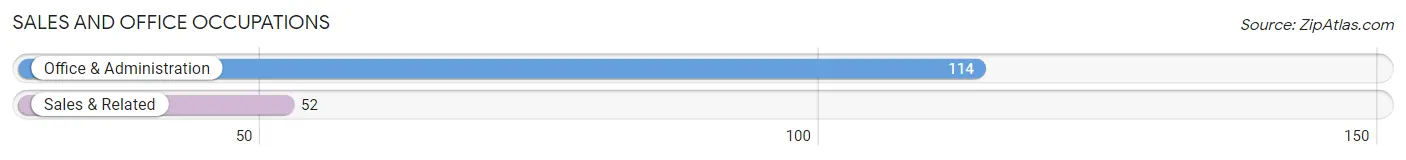
Sales and Office Occupations
The most common Sales and Office occupations in Walnut Creek are Office & Administration (114 | 23.9%), and Sales & Related (52 | 10.9%).
Sales and Office Occupations by Sex

| Occupation | Male | Female |
| Sales & Related | 52 (100.0%) | 0 (0.0%) |
| Office & Administration | 0 (0.0%) | 114 (100.0%) |
| Total (Category) | 52 (31.3%) | 114 (68.7%) |
| Total (Overall) | 218 (45.8%) | 258 (54.2%) |
Natural Resources, Construction and Maintenance Occupations
The most common Natural Resources, Construction and Maintenance occupations in Walnut Creek are , and Construction & Extraction (11 | 2.3%).
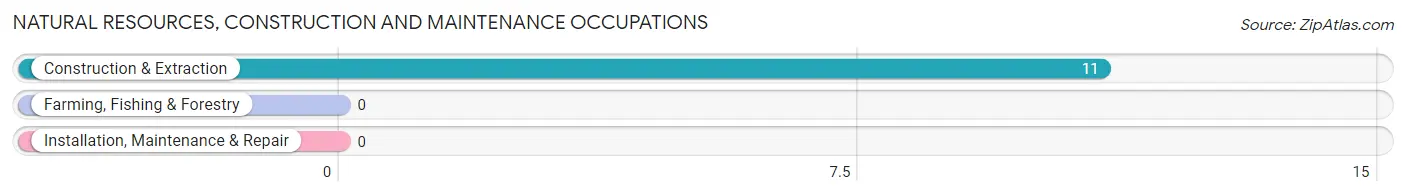
Natural Resources, Construction and Maintenance Occupations by Sex
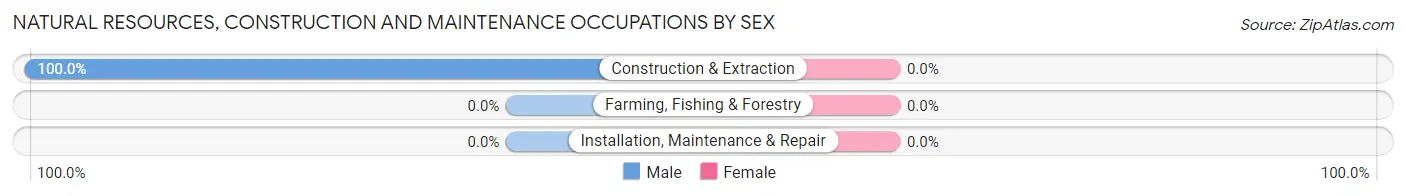
| Occupation | Male | Female |
| Farming, Fishing & Forestry | 0 (0.0%) | 0 (0.0%) |
| Construction & Extraction | 11 (100.0%) | 0 (0.0%) |
| Installation, Maintenance & Repair | 0 (0.0%) | 0 (0.0%) |
| Total (Category) | 11 (100.0%) | 0 (0.0%) |
| Total (Overall) | 218 (45.8%) | 258 (54.2%) |
Production, Transportation and Moving Occupations
The most common Production, Transportation and Moving occupations in Walnut Creek are , and Production (63 | 13.2%).
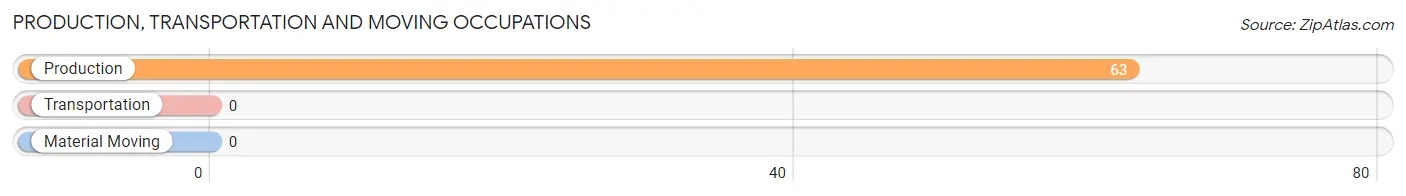
Production, Transportation and Moving Occupations by Sex
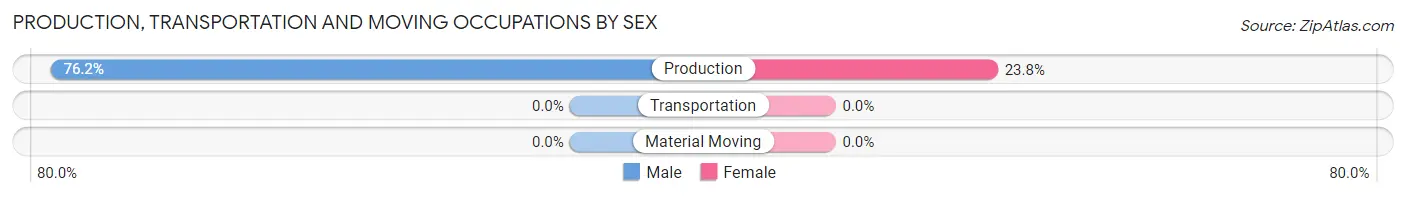
| Occupation | Male | Female |
| Production | 48 (76.2%) | 15 (23.8%) |
| Transportation | 0 (0.0%) | 0 (0.0%) |
| Material Moving | 0 (0.0%) | 0 (0.0%) |
| Total (Category) | 48 (76.2%) | 15 (23.8%) |
| Total (Overall) | 218 (45.8%) | 258 (54.2%) |
Employment Industries by Sex in Walnut Creek
Employment Industries in Walnut Creek
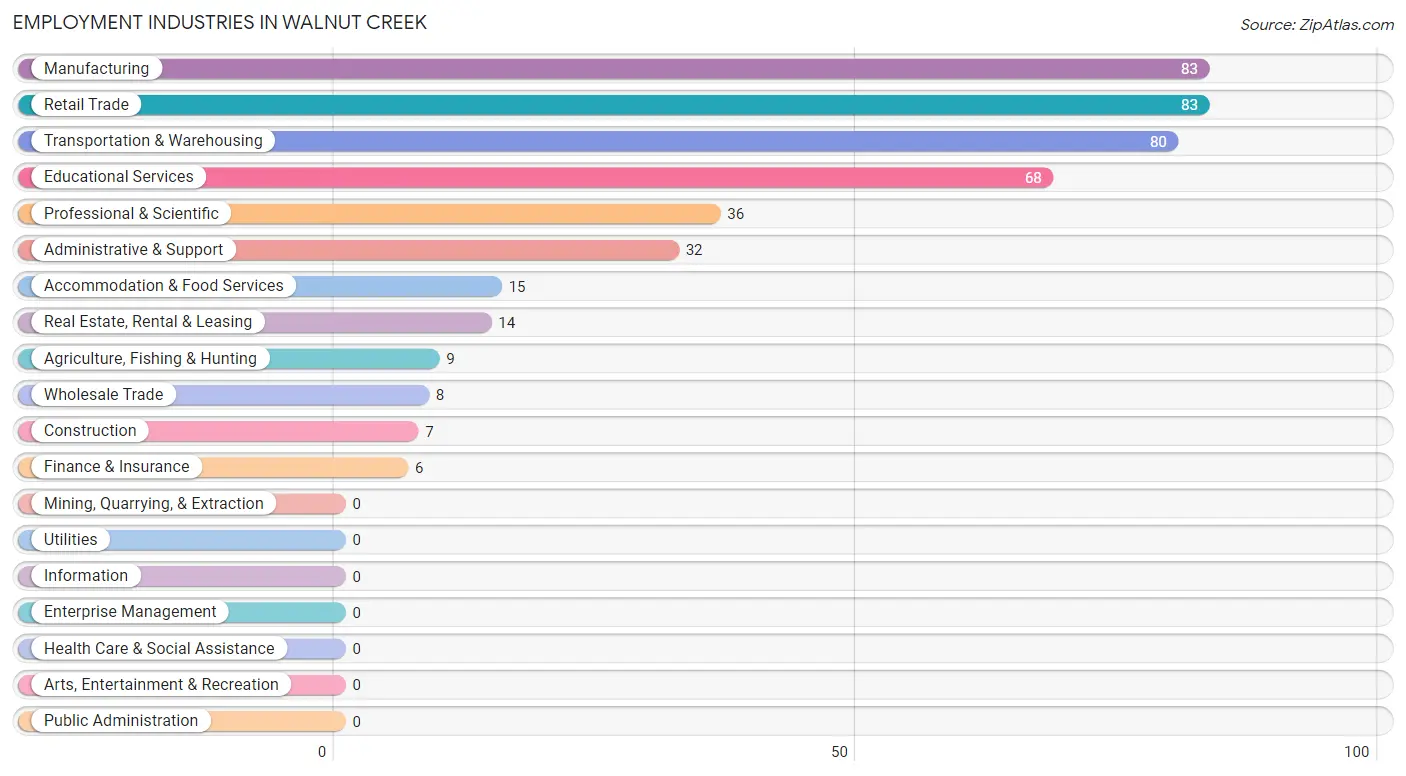
The major employment industries in Walnut Creek include Manufacturing (83 | 17.4%), Retail Trade (83 | 17.4%), Transportation & Warehousing (80 | 16.8%), Educational Services (68 | 14.3%), and Professional & Scientific (36 | 7.6%).
Employment Industries by Sex in Walnut Creek
The Walnut Creek industries that see more men than women are Agriculture, Fishing & Hunting (100.0%), Wholesale Trade (100.0%), and Professional & Scientific (100.0%), whereas the industries that tend to have a higher number of women are Construction (100.0%), Finance & Insurance (100.0%), and Real Estate, Rental & Leasing (100.0%).
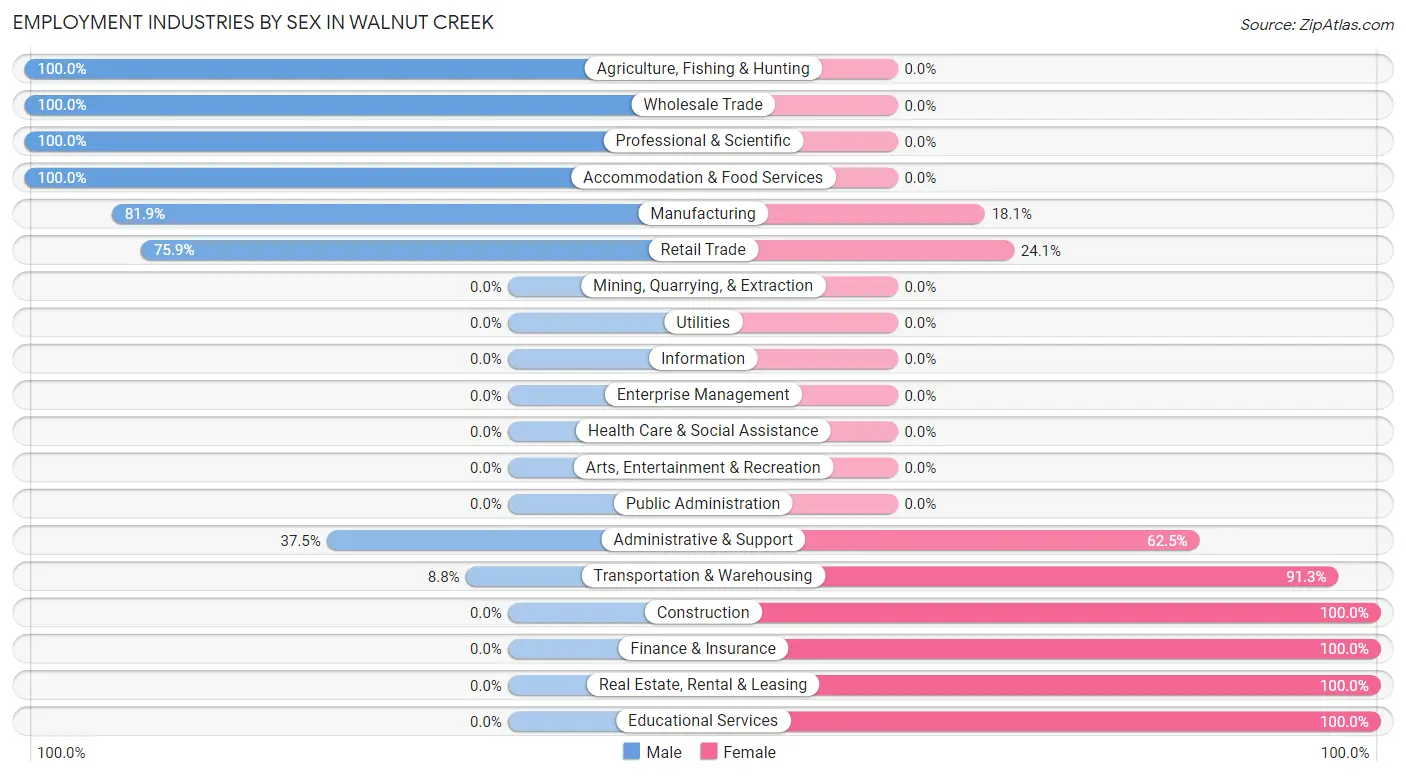
| Industry | Male | Female |
| Agriculture, Fishing & Hunting | 9 (100.0%) | 0 (0.0%) |
| Mining, Quarrying, & Extraction | 0 (0.0%) | 0 (0.0%) |
| Construction | 0 (0.0%) | 7 (100.0%) |
| Manufacturing | 68 (81.9%) | 15 (18.1%) |
| Wholesale Trade | 8 (100.0%) | 0 (0.0%) |
| Retail Trade | 63 (75.9%) | 20 (24.1%) |
| Transportation & Warehousing | 7 (8.7%) | 73 (91.2%) |
| Utilities | 0 (0.0%) | 0 (0.0%) |
| Information | 0 (0.0%) | 0 (0.0%) |
| Finance & Insurance | 0 (0.0%) | 6 (100.0%) |
| Real Estate, Rental & Leasing | 0 (0.0%) | 14 (100.0%) |
| Professional & Scientific | 36 (100.0%) | 0 (0.0%) |
| Enterprise Management | 0 (0.0%) | 0 (0.0%) |
| Administrative & Support | 12 (37.5%) | 20 (62.5%) |
| Educational Services | 0 (0.0%) | 68 (100.0%) |
| Health Care & Social Assistance | 0 (0.0%) | 0 (0.0%) |
| Arts, Entertainment & Recreation | 0 (0.0%) | 0 (0.0%) |
| Accommodation & Food Services | 15 (100.0%) | 0 (0.0%) |
| Public Administration | 0 (0.0%) | 0 (0.0%) |
| Total | 218 (45.8%) | 258 (54.2%) |
Education in Walnut Creek
School Enrollment in Walnut Creek
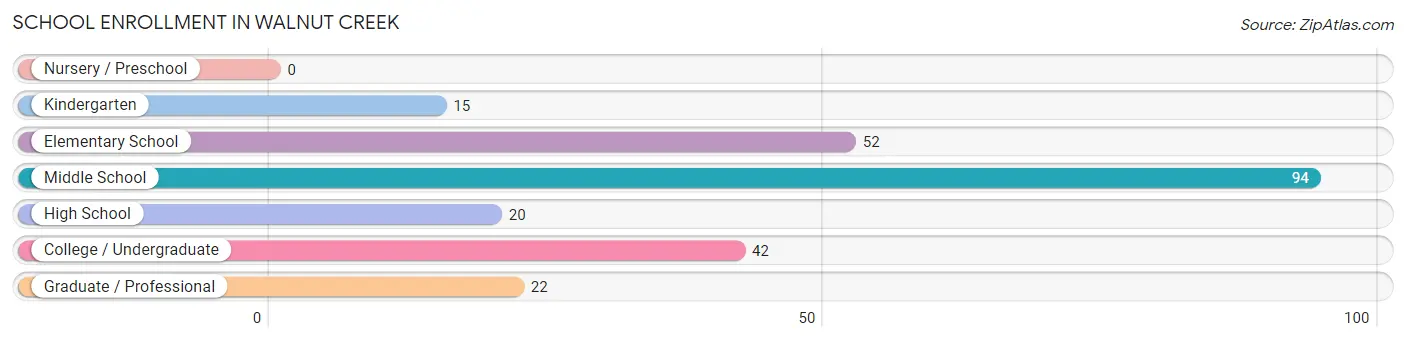
The most common levels of schooling among the 245 students in Walnut Creek are middle school (94 | 38.4%), elementary school (52 | 21.2%), and college / undergraduate (42 | 17.1%).
| School Level | # Students | % Students |
| Nursery / Preschool | 0 | 0.0% |
| Kindergarten | 15 | 6.1% |
| Elementary School | 52 | 21.2% |
| Middle School | 94 | 38.4% |
| High School | 20 | 8.2% |
| College / Undergraduate | 42 | 17.1% |
| Graduate / Professional | 22 | 9.0% |
| Total | 245 | 100.0% |
School Enrollment by Age by Funding Source in Walnut Creek
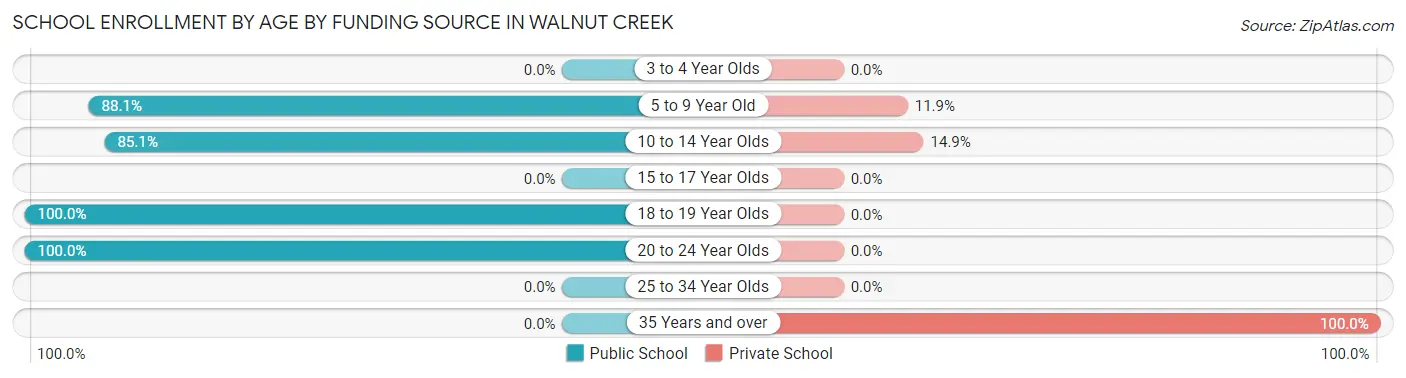
Out of a total of 245 students who are enrolled in schools in Walnut Creek, 80 (32.7%) attend a private institution, while the remaining 165 (67.3%) are enrolled in public schools. The age group of 35 years and over has the highest likelihood of being enrolled in private schools, with 58 (100.0% in the age bracket) enrolled. Conversely, the age group of 18 to 19 year olds has the lowest likelihood of being enrolled in a private school, with 20 (100.0% in the age bracket) attending a public institution.
| Age Bracket | Public School | Private School |
| 3 to 4 Year Olds | 0 (0.0%) | 0 (0.0%) |
| 5 to 9 Year Old | 59 (88.1%) | 8 (11.9%) |
| 10 to 14 Year Olds | 80 (85.1%) | 14 (14.9%) |
| 15 to 17 Year Olds | 0 (0.0%) | 0 (0.0%) |
| 18 to 19 Year Olds | 20 (100.0%) | 0 (0.0%) |
| 20 to 24 Year Olds | 6 (100.0%) | 0 (0.0%) |
| 25 to 34 Year Olds | 0 (0.0%) | 0 (0.0%) |
| 35 Years and over | 0 (0.0%) | 58 (100.0%) |
| Total | 165 (67.3%) | 80 (32.7%) |
Educational Attainment by Field of Study in Walnut Creek
Education (53 | 43.1%), communications (33 | 26.8%), liberal arts & history (17 | 13.8%), business (10 | 8.1%), and computers & mathematics (6 | 4.9%) are the most common fields of study among 123 individuals in Walnut Creek who have obtained a bachelor's degree or higher.
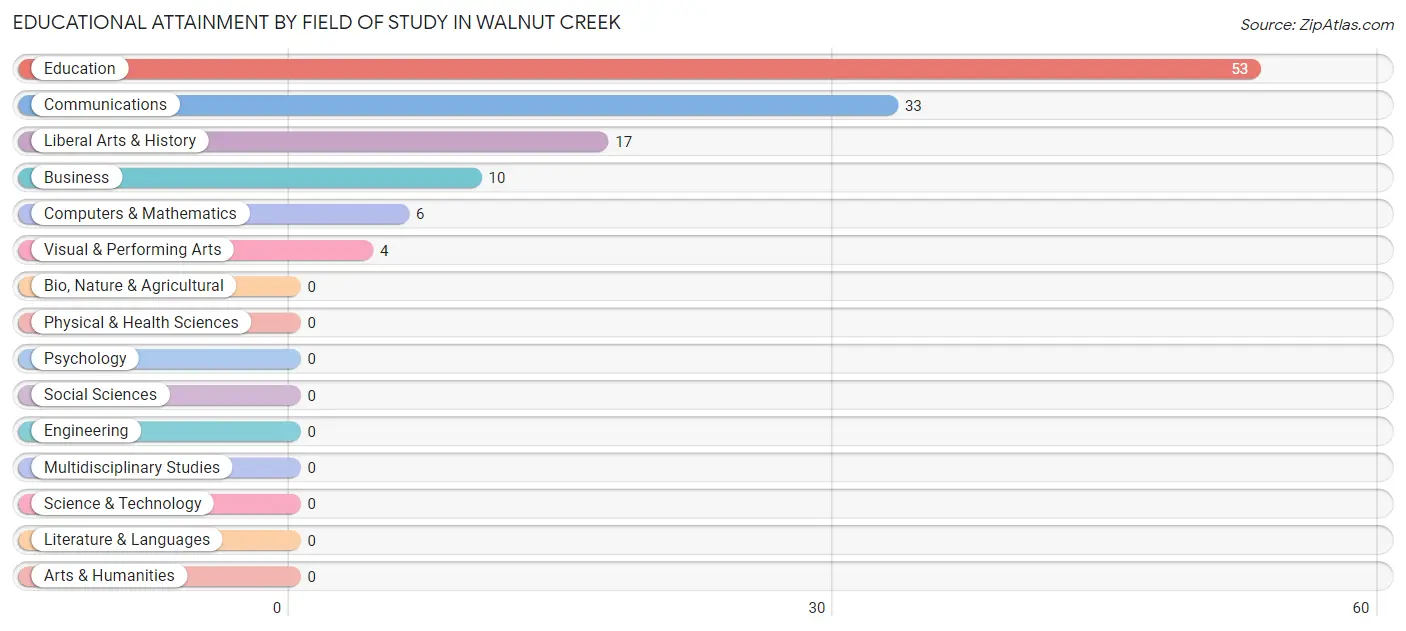
| Field of Study | # Graduates | % Graduates |
| Computers & Mathematics | 6 | 4.9% |
| Bio, Nature & Agricultural | 0 | 0.0% |
| Physical & Health Sciences | 0 | 0.0% |
| Psychology | 0 | 0.0% |
| Social Sciences | 0 | 0.0% |
| Engineering | 0 | 0.0% |
| Multidisciplinary Studies | 0 | 0.0% |
| Science & Technology | 0 | 0.0% |
| Business | 10 | 8.1% |
| Education | 53 | 43.1% |
| Literature & Languages | 0 | 0.0% |
| Liberal Arts & History | 17 | 13.8% |
| Visual & Performing Arts | 4 | 3.3% |
| Communications | 33 | 26.8% |
| Arts & Humanities | 0 | 0.0% |
| Total | 123 | 100.0% |
Transportation & Commute in Walnut Creek
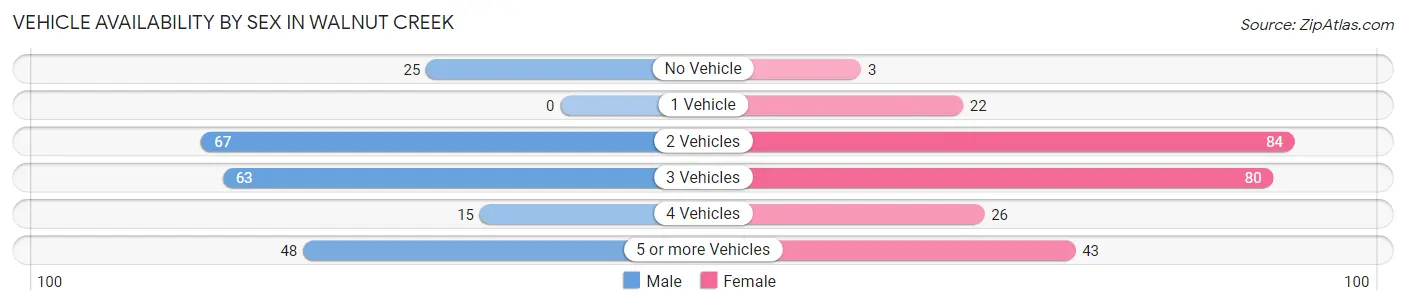
Vehicle Availability by Sex in Walnut Creek
The most prevalent vehicle ownership categories in Walnut Creek are males with 2 vehicles (67, accounting for 30.7%) and females with 2 vehicles (84, making up 26.0%).
| Vehicles Available | Male | Female |
| No Vehicle | 25 (11.5%) | 3 (1.2%) |
| 1 Vehicle | 0 (0.0%) | 22 (8.5%) |
| 2 Vehicles | 67 (30.7%) | 84 (32.6%) |
| 3 Vehicles | 63 (28.9%) | 80 (31.0%) |
| 4 Vehicles | 15 (6.9%) | 26 (10.1%) |
| 5 or more Vehicles | 48 (22.0%) | 43 (16.7%) |
| Total | 218 (100.0%) | 258 (100.0%) |
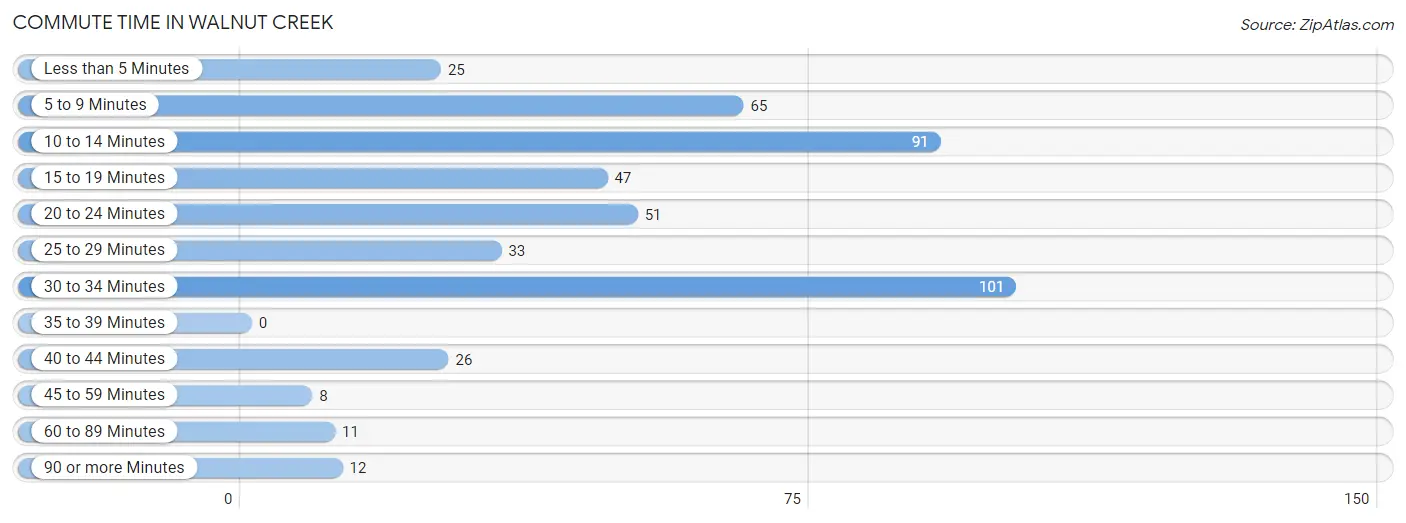
Commute Time in Walnut Creek
The most frequently occuring commute durations in Walnut Creek are 30 to 34 minutes (101 commuters, 21.5%), 10 to 14 minutes (91 commuters, 19.4%), and 5 to 9 minutes (65 commuters, 13.8%).
| Commute Time | # Commuters | % Commuters |
| Less than 5 Minutes | 25 | 5.3% |
| 5 to 9 Minutes | 65 | 13.8% |
| 10 to 14 Minutes | 91 | 19.4% |
| 15 to 19 Minutes | 47 | 10.0% |
| 20 to 24 Minutes | 51 | 10.8% |
| 25 to 29 Minutes | 33 | 7.0% |
| 30 to 34 Minutes | 101 | 21.5% |
| 35 to 39 Minutes | 0 | 0.0% |
| 40 to 44 Minutes | 26 | 5.5% |
| 45 to 59 Minutes | 8 | 1.7% |
| 60 to 89 Minutes | 11 | 2.3% |
| 90 or more Minutes | 12 | 2.5% |
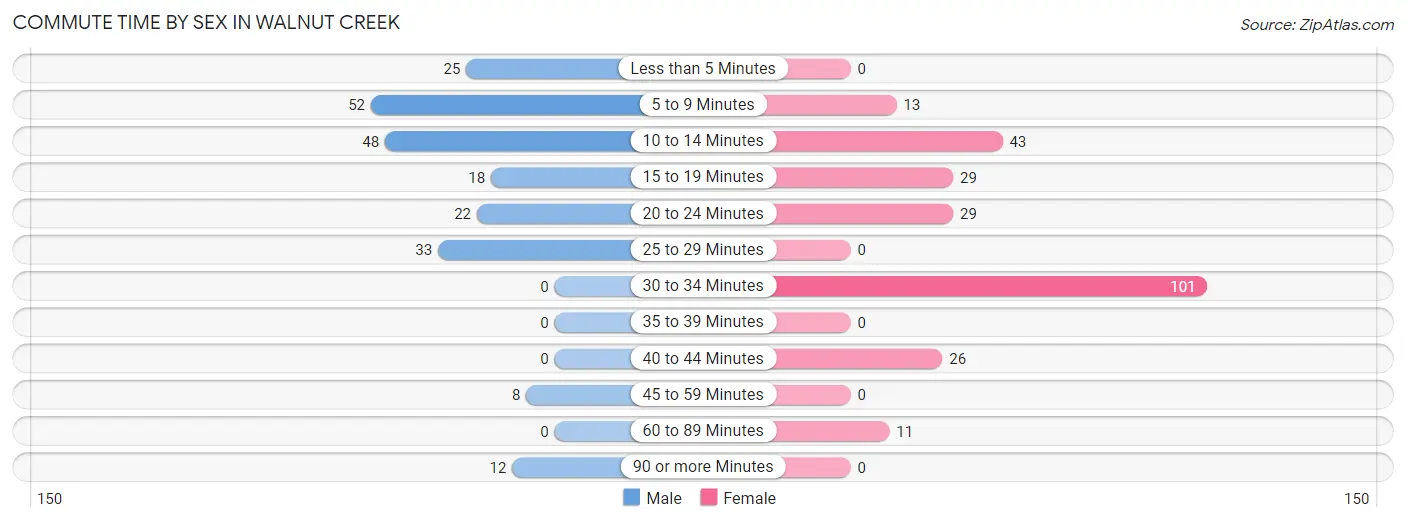
Commute Time by Sex in Walnut Creek
The most common commute times in Walnut Creek are 5 to 9 minutes (52 commuters, 23.8%) for males and 30 to 34 minutes (101 commuters, 40.1%) for females.
| Commute Time | Male | Female |
| Less than 5 Minutes | 25 (11.5%) | 0 (0.0%) |
| 5 to 9 Minutes | 52 (23.8%) | 13 (5.2%) |
| 10 to 14 Minutes | 48 (22.0%) | 43 (17.1%) |
| 15 to 19 Minutes | 18 (8.3%) | 29 (11.5%) |
| 20 to 24 Minutes | 22 (10.1%) | 29 (11.5%) |
| 25 to 29 Minutes | 33 (15.1%) | 0 (0.0%) |
| 30 to 34 Minutes | 0 (0.0%) | 101 (40.1%) |
| 35 to 39 Minutes | 0 (0.0%) | 0 (0.0%) |
| 40 to 44 Minutes | 0 (0.0%) | 26 (10.3%) |
| 45 to 59 Minutes | 8 (3.7%) | 0 (0.0%) |
| 60 to 89 Minutes | 0 (0.0%) | 11 (4.4%) |
| 90 or more Minutes | 12 (5.5%) | 0 (0.0%) |
Time of Departure to Work by Sex in Walnut Creek
The most frequent times of departure to work in Walnut Creek are 12:00 AM to 4:59 AM (103, 47.2%) for males and 6:00 AM to 6:29 AM (76, 30.2%) for females.
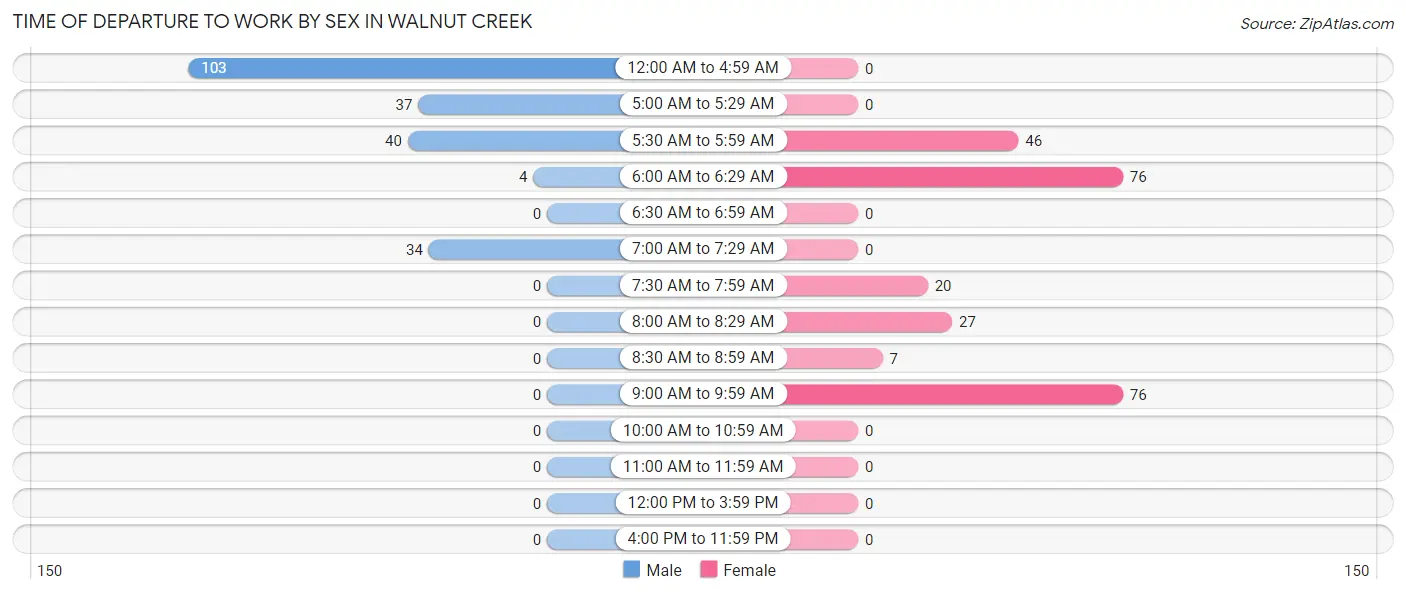
| Time of Departure | Male | Female |
| 12:00 AM to 4:59 AM | 103 (47.2%) | 0 (0.0%) |
| 5:00 AM to 5:29 AM | 37 (17.0%) | 0 (0.0%) |
| 5:30 AM to 5:59 AM | 40 (18.3%) | 46 (18.2%) |
| 6:00 AM to 6:29 AM | 4 (1.8%) | 76 (30.2%) |
| 6:30 AM to 6:59 AM | 0 (0.0%) | 0 (0.0%) |
| 7:00 AM to 7:29 AM | 34 (15.6%) | 0 (0.0%) |
| 7:30 AM to 7:59 AM | 0 (0.0%) | 20 (7.9%) |
| 8:00 AM to 8:29 AM | 0 (0.0%) | 27 (10.7%) |
| 8:30 AM to 8:59 AM | 0 (0.0%) | 7 (2.8%) |
| 9:00 AM to 9:59 AM | 0 (0.0%) | 76 (30.2%) |
| 10:00 AM to 10:59 AM | 0 (0.0%) | 0 (0.0%) |
| 11:00 AM to 11:59 AM | 0 (0.0%) | 0 (0.0%) |
| 12:00 PM to 3:59 PM | 0 (0.0%) | 0 (0.0%) |
| 4:00 PM to 11:59 PM | 0 (0.0%) | 0 (0.0%) |
| Total | 218 (100.0%) | 252 (100.0%) |
Housing Occupancy in Walnut Creek
Occupancy by Ownership in Walnut Creek
Of the total 319 dwellings in Walnut Creek, owner-occupied units account for 210 (65.8%), while renter-occupied units make up 109 (34.2%).
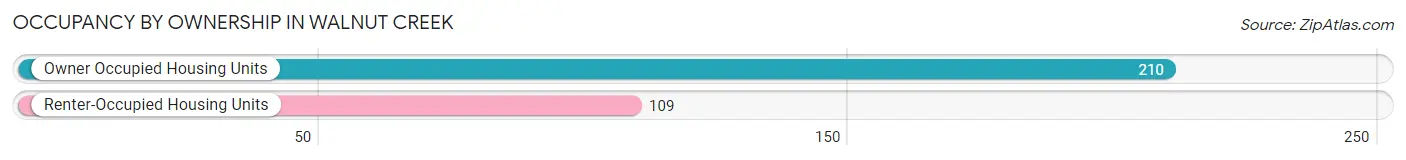
| Occupancy | # Housing Units | % Housing Units |
| Owner Occupied Housing Units | 210 | 65.8% |
| Renter-Occupied Housing Units | 109 | 34.2% |
| Total Occupied Housing Units | 319 | 100.0% |
Occupancy by Household Size in Walnut Creek
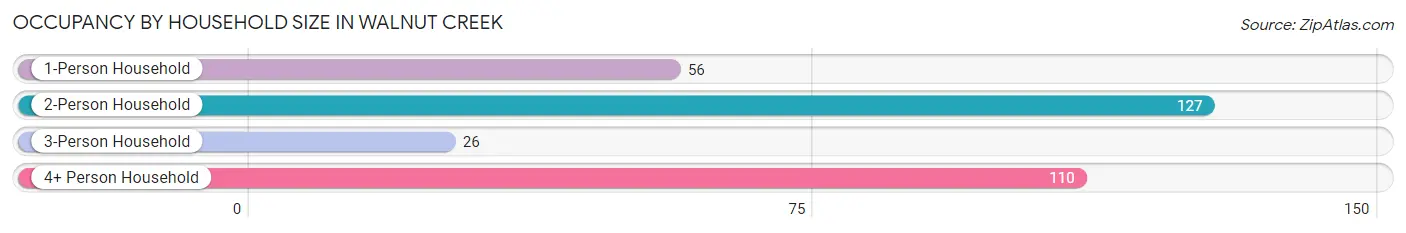
| Household Size | # Housing Units | % Housing Units |
| 1-Person Household | 56 | 17.5% |
| 2-Person Household | 127 | 39.8% |
| 3-Person Household | 26 | 8.2% |
| 4+ Person Household | 110 | 34.5% |
| Total Housing Units | 319 | 100.0% |
Occupancy by Ownership by Household Size in Walnut Creek
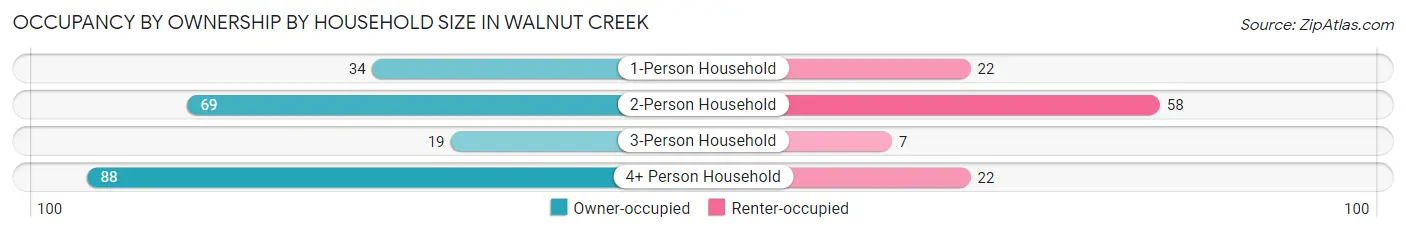
| Household Size | Owner-occupied | Renter-occupied |
| 1-Person Household | 34 (60.7%) | 22 (39.3%) |
| 2-Person Household | 69 (54.3%) | 58 (45.7%) |
| 3-Person Household | 19 (73.1%) | 7 (26.9%) |
| 4+ Person Household | 88 (80.0%) | 22 (20.0%) |
| Total Housing Units | 210 (65.8%) | 109 (34.2%) |
Occupancy by Educational Attainment in Walnut Creek
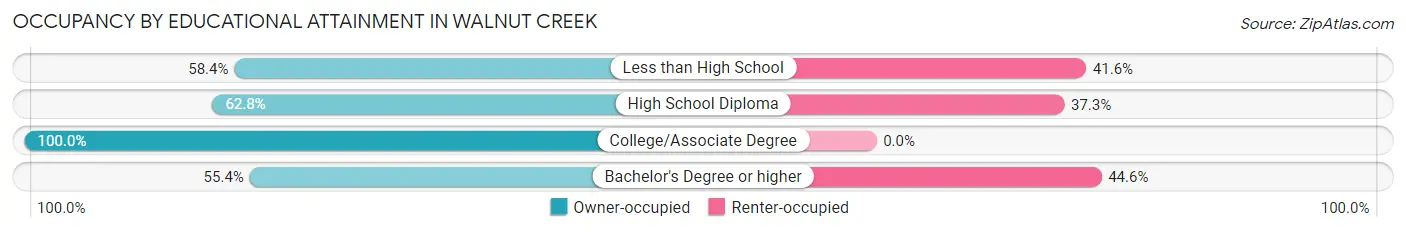
| Household Size | Owner-occupied | Renter-occupied |
| Less than High School | 59 (58.4%) | 42 (41.6%) |
| High School Diploma | 64 (62.7%) | 38 (37.2%) |
| College/Associate Degree | 51 (100.0%) | 0 (0.0%) |
| Bachelor's Degree or higher | 36 (55.4%) | 29 (44.6%) |
Occupancy by Age of Householder in Walnut Creek
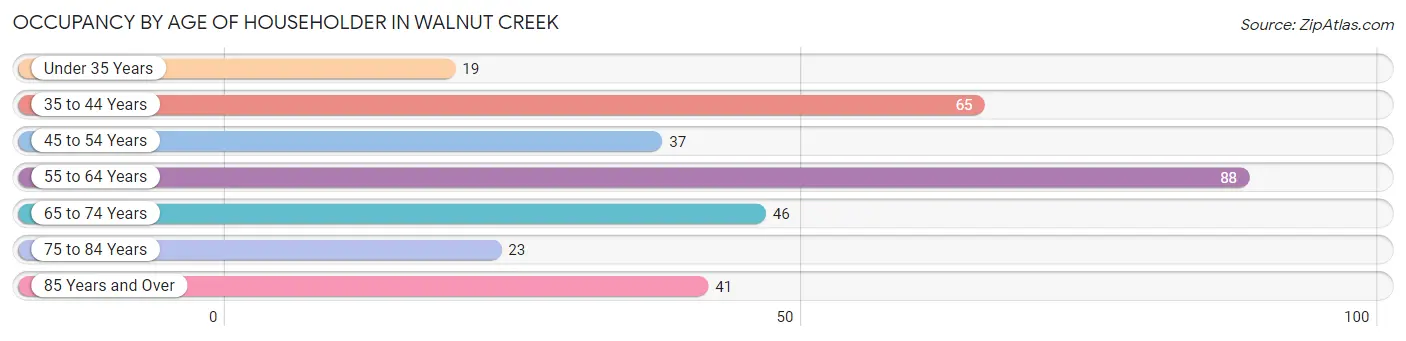
| Age Bracket | # Households | % Households |
| Under 35 Years | 19 | 6.0% |
| 35 to 44 Years | 65 | 20.4% |
| 45 to 54 Years | 37 | 11.6% |
| 55 to 64 Years | 88 | 27.6% |
| 65 to 74 Years | 46 | 14.4% |
| 75 to 84 Years | 23 | 7.2% |
| 85 Years and Over | 41 | 12.9% |
| Total | 319 | 100.0% |
Housing Finances in Walnut Creek
Median Income by Occupancy in Walnut Creek
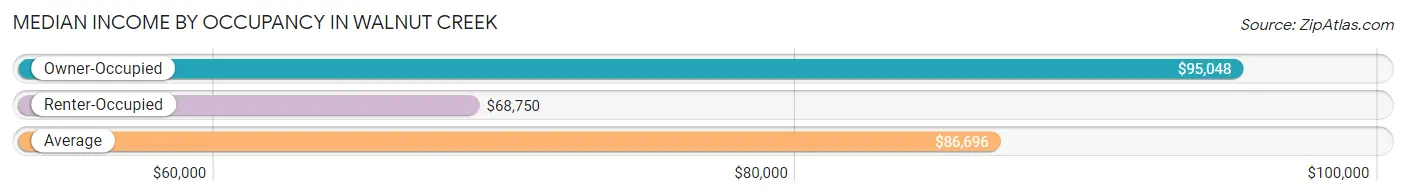
| Occupancy Type | # Households | Median Income |
| Owner-Occupied | 210 (65.8%) | $95,048 |
| Renter-Occupied | 109 (34.2%) | $68,750 |
| Average | 319 (100.0%) | $86,696 |
Occupancy by Householder Income Bracket in Walnut Creek
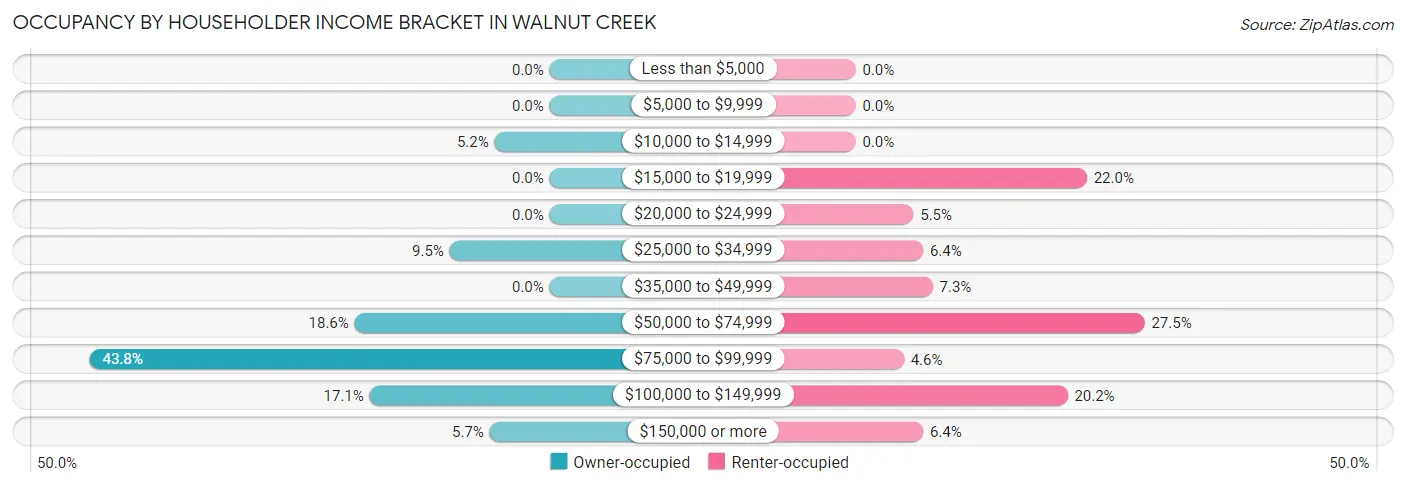
| Income Bracket | Owner-occupied | Renter-occupied |
| Less than $5,000 | 0 (0.0%) | 0 (0.0%) |
| $5,000 to $9,999 | 0 (0.0%) | 0 (0.0%) |
| $10,000 to $14,999 | 11 (5.2%) | 0 (0.0%) |
| $15,000 to $19,999 | 0 (0.0%) | 24 (22.0%) |
| $20,000 to $24,999 | 0 (0.0%) | 6 (5.5%) |
| $25,000 to $34,999 | 20 (9.5%) | 7 (6.4%) |
| $35,000 to $49,999 | 0 (0.0%) | 8 (7.3%) |
| $50,000 to $74,999 | 39 (18.6%) | 30 (27.5%) |
| $75,000 to $99,999 | 92 (43.8%) | 5 (4.6%) |
| $100,000 to $149,999 | 36 (17.1%) | 22 (20.2%) |
| $150,000 or more | 12 (5.7%) | 7 (6.4%) |
| Total | 210 (100.0%) | 109 (100.0%) |
Monthly Housing Cost Tiers in Walnut Creek
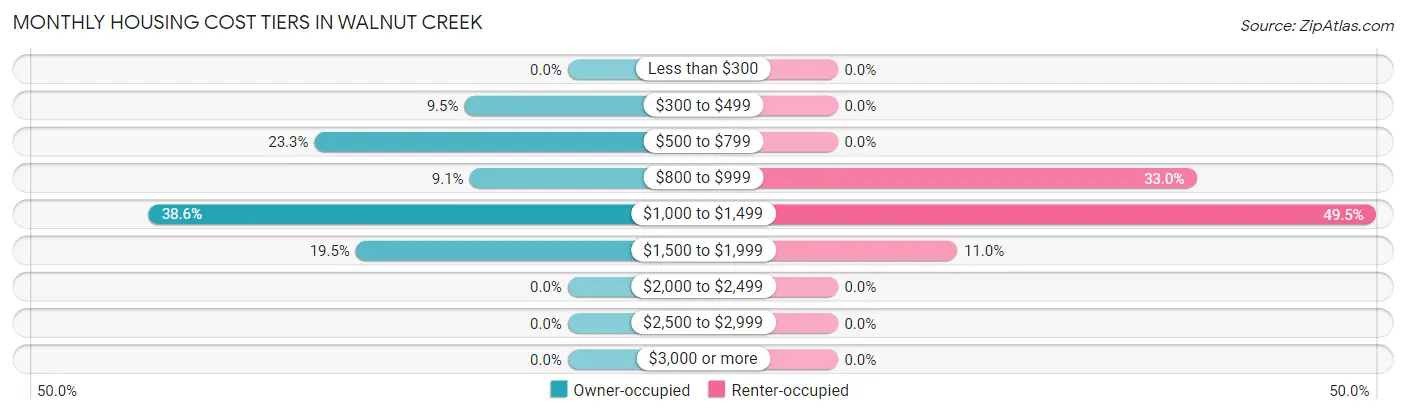
| Monthly Cost | Owner-occupied | Renter-occupied |
| Less than $300 | 0 (0.0%) | 0 (0.0%) |
| $300 to $499 | 20 (9.5%) | 0 (0.0%) |
| $500 to $799 | 49 (23.3%) | 0 (0.0%) |
| $800 to $999 | 19 (9.0%) | 36 (33.0%) |
| $1,000 to $1,499 | 81 (38.6%) | 54 (49.5%) |
| $1,500 to $1,999 | 41 (19.5%) | 12 (11.0%) |
| $2,000 to $2,499 | 0 (0.0%) | 0 (0.0%) |
| $2,500 to $2,999 | 0 (0.0%) | 0 (0.0%) |
| $3,000 or more | 0 (0.0%) | 0 (0.0%) |
| Total | 210 (100.0%) | 109 (100.0%) |
Physical Housing Characteristics in Walnut Creek
Housing Structures in Walnut Creek
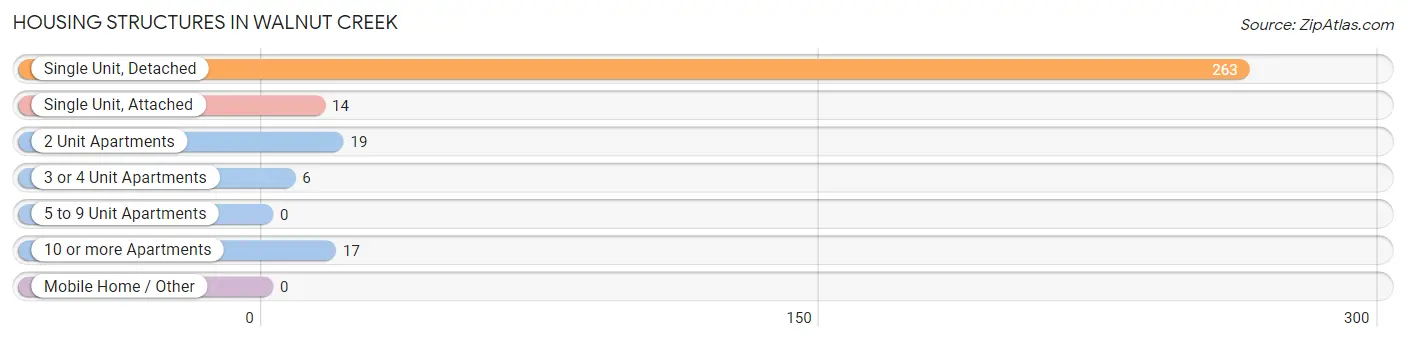
| Structure Type | # Housing Units | % Housing Units |
| Single Unit, Detached | 263 | 82.5% |
| Single Unit, Attached | 14 | 4.4% |
| 2 Unit Apartments | 19 | 6.0% |
| 3 or 4 Unit Apartments | 6 | 1.9% |
| 5 to 9 Unit Apartments | 0 | 0.0% |
| 10 or more Apartments | 17 | 5.3% |
| Mobile Home / Other | 0 | 0.0% |
| Total | 319 | 100.0% |
Housing Structures by Occupancy in Walnut Creek
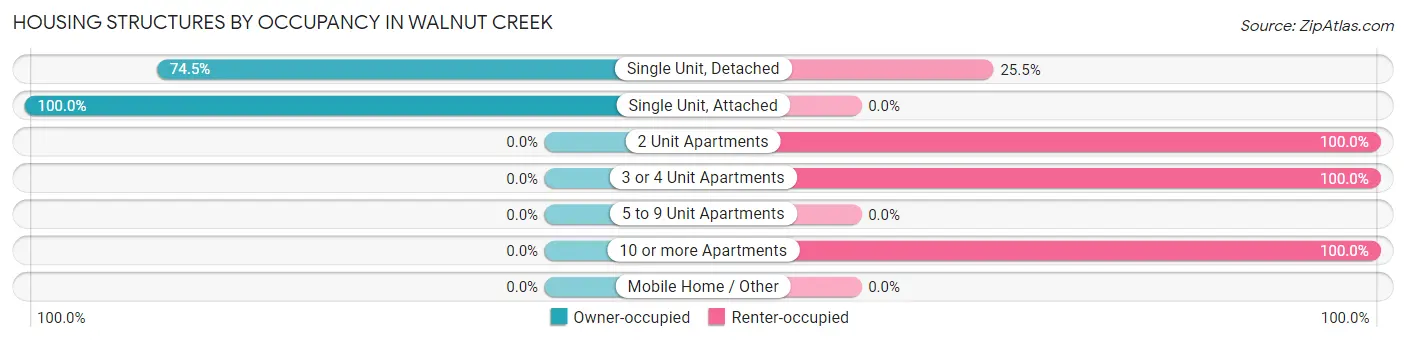
| Structure Type | Owner-occupied | Renter-occupied |
| Single Unit, Detached | 196 (74.5%) | 67 (25.5%) |
| Single Unit, Attached | 14 (100.0%) | 0 (0.0%) |
| 2 Unit Apartments | 0 (0.0%) | 19 (100.0%) |
| 3 or 4 Unit Apartments | 0 (0.0%) | 6 (100.0%) |
| 5 to 9 Unit Apartments | 0 (0.0%) | 0 (0.0%) |
| 10 or more Apartments | 0 (0.0%) | 17 (100.0%) |
| Mobile Home / Other | 0 (0.0%) | 0 (0.0%) |
| Total | 210 (65.8%) | 109 (34.2%) |
Housing Structures by Number of Rooms in Walnut Creek
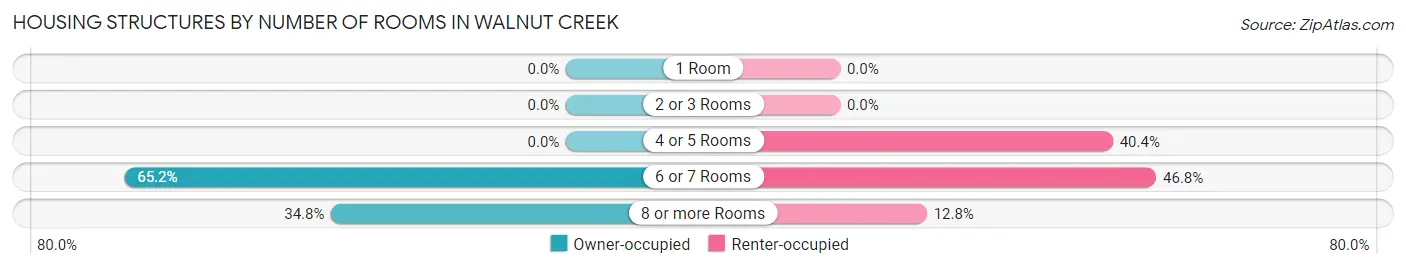
| Number of Rooms | Owner-occupied | Renter-occupied |
| 1 Room | 0 (0.0%) | 0 (0.0%) |
| 2 or 3 Rooms | 0 (0.0%) | 0 (0.0%) |
| 4 or 5 Rooms | 0 (0.0%) | 44 (40.4%) |
| 6 or 7 Rooms | 137 (65.2%) | 51 (46.8%) |
| 8 or more Rooms | 73 (34.8%) | 14 (12.8%) |
| Total | 210 (100.0%) | 109 (100.0%) |
Housing Structure by Heating Type in Walnut Creek
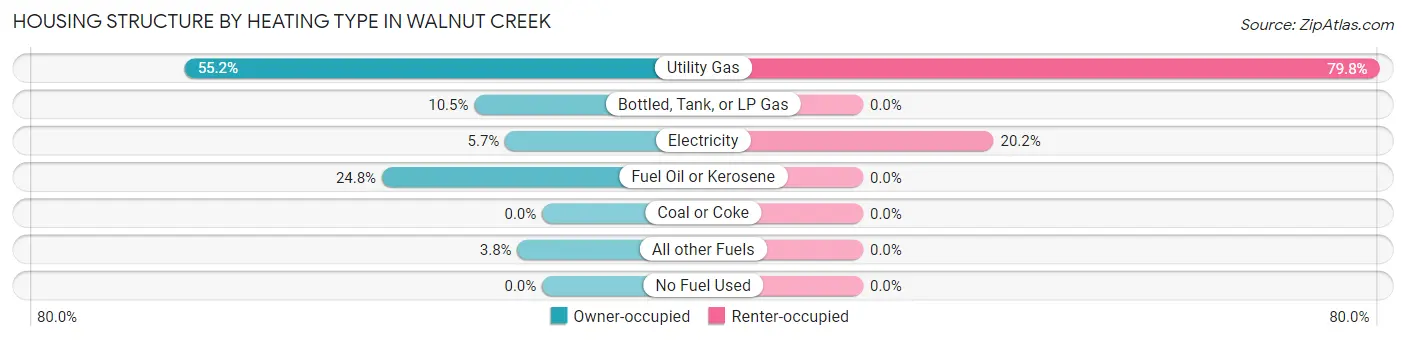
| Heating Type | Owner-occupied | Renter-occupied |
| Utility Gas | 116 (55.2%) | 87 (79.8%) |
| Bottled, Tank, or LP Gas | 22 (10.5%) | 0 (0.0%) |
| Electricity | 12 (5.7%) | 22 (20.2%) |
| Fuel Oil or Kerosene | 52 (24.8%) | 0 (0.0%) |
| Coal or Coke | 0 (0.0%) | 0 (0.0%) |
| All other Fuels | 8 (3.8%) | 0 (0.0%) |
| No Fuel Used | 0 (0.0%) | 0 (0.0%) |
| Total | 210 (100.0%) | 109 (100.0%) |
Household Vehicle Usage in Walnut Creek
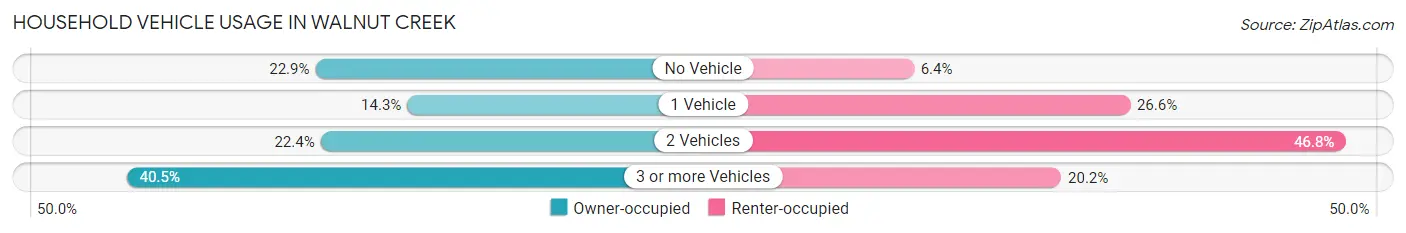
| Vehicles per Household | Owner-occupied | Renter-occupied |
| No Vehicle | 48 (22.9%) | 7 (6.4%) |
| 1 Vehicle | 30 (14.3%) | 29 (26.6%) |
| 2 Vehicles | 47 (22.4%) | 51 (46.8%) |
| 3 or more Vehicles | 85 (40.5%) | 22 (20.2%) |
| Total | 210 (100.0%) | 109 (100.0%) |
Real Estate & Mortgages in Walnut Creek
Real Estate and Mortgage Overview in Walnut Creek
| Characteristic | Without Mortgage | With Mortgage |
| Housing Units | 87 | 123 |
| Median Property Value | $310,900 | $216,400 |
| Median Household Income | $85,625 | $0 |
| Monthly Housing Costs | $648 | $0 |
| Real Estate Taxes | $3,534 | $0 |
Property Value by Mortgage Status in Walnut Creek
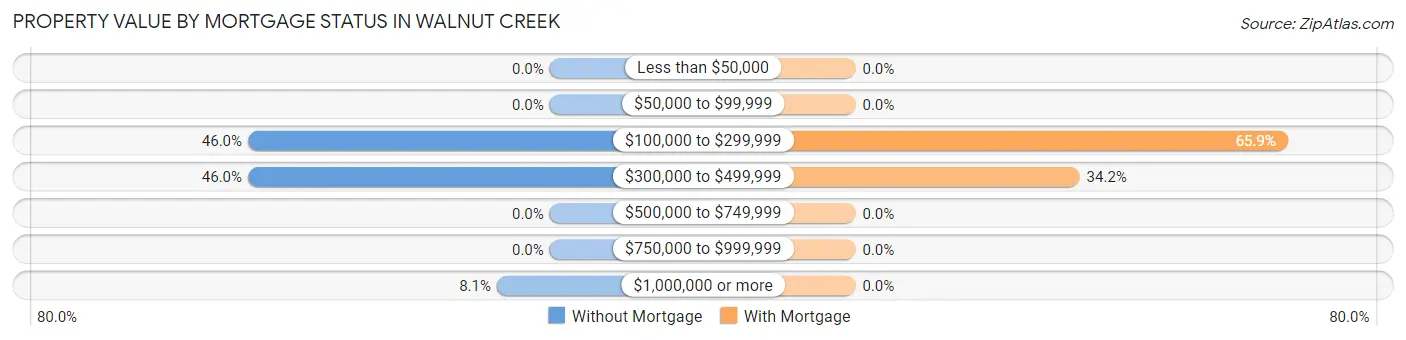
| Property Value | Without Mortgage | With Mortgage |
| Less than $50,000 | 0 (0.0%) | 0 (0.0%) |
| $50,000 to $99,999 | 0 (0.0%) | 0 (0.0%) |
| $100,000 to $299,999 | 40 (46.0%) | 81 (65.8%) |
| $300,000 to $499,999 | 40 (46.0%) | 42 (34.2%) |
| $500,000 to $749,999 | 0 (0.0%) | 0 (0.0%) |
| $750,000 to $999,999 | 0 (0.0%) | 0 (0.0%) |
| $1,000,000 or more | 7 (8.1%) | 0 (0.0%) |
| Total | 87 (100.0%) | 123 (100.0%) |
Household Income by Mortgage Status in Walnut Creek
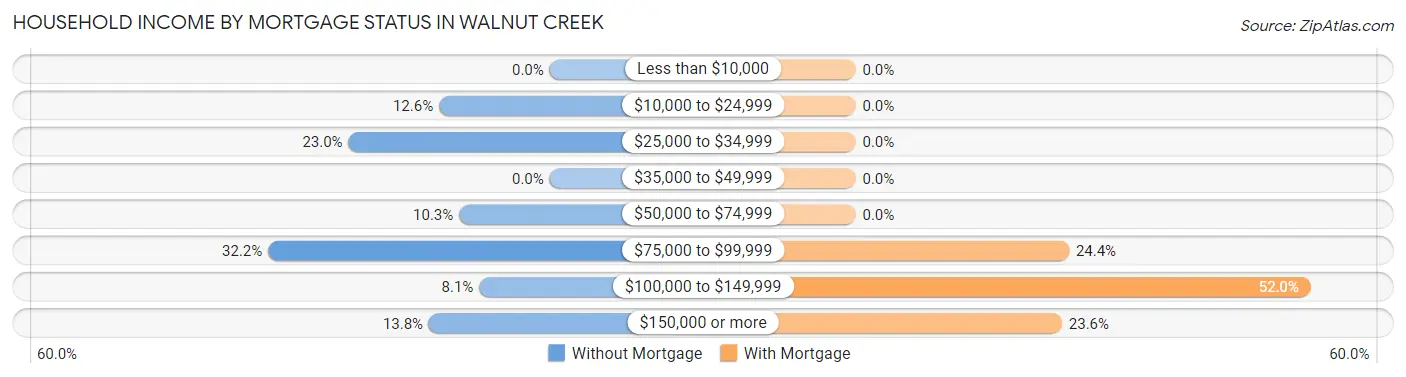
| Household Income | Without Mortgage | With Mortgage |
| Less than $10,000 | 0 (0.0%) | 0 (0.0%) |
| $10,000 to $24,999 | 11 (12.6%) | 0 (0.0%) |
| $25,000 to $34,999 | 20 (23.0%) | 0 (0.0%) |
| $35,000 to $49,999 | 0 (0.0%) | 0 (0.0%) |
| $50,000 to $74,999 | 9 (10.3%) | 0 (0.0%) |
| $75,000 to $99,999 | 28 (32.2%) | 30 (24.4%) |
| $100,000 to $149,999 | 7 (8.1%) | 64 (52.0%) |
| $150,000 or more | 12 (13.8%) | 29 (23.6%) |
| Total | 87 (100.0%) | 123 (100.0%) |
Property Value to Household Income Ratio in Walnut Creek
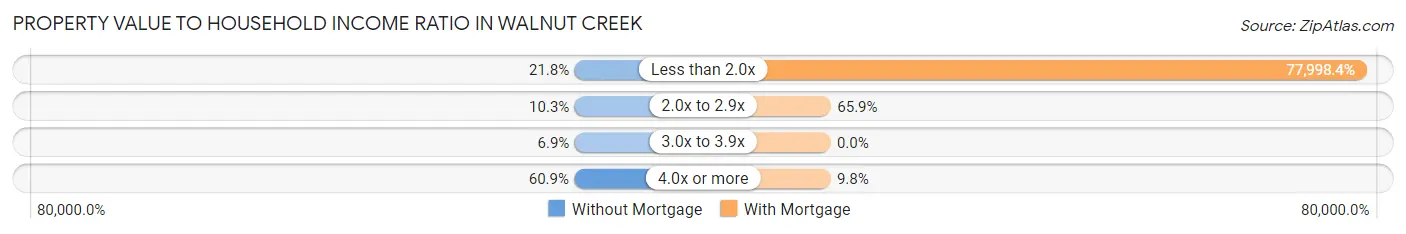
| Value-to-Income Ratio | Without Mortgage | With Mortgage |
| Less than 2.0x | 19 (21.8%) | 95,938 (77,998.4%) |
| 2.0x to 2.9x | 9 (10.3%) | 81 (65.8%) |
| 3.0x to 3.9x | 6 (6.9%) | 0 (0.0%) |
| 4.0x or more | 53 (60.9%) | 12 (9.8%) |
| Total | 87 (100.0%) | 123 (100.0%) |
Real Estate Taxes by Mortgage Status in Walnut Creek
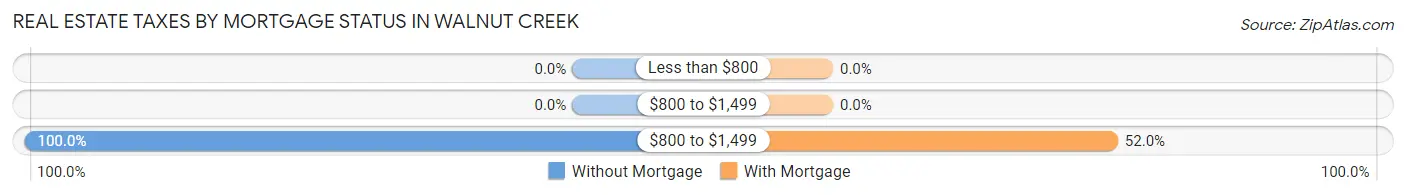
| Property Taxes | Without Mortgage | With Mortgage |
| Less than $800 | 0 (0.0%) | 0 (0.0%) |
| $800 to $1,499 | 0 (0.0%) | 0 (0.0%) |
| $800 to $1,499 | 87 (100.0%) | 64 (52.0%) |
| Total | 87 (100.0%) | 123 (100.0%) |
Health & Disability in Walnut Creek
Health Insurance Coverage by Age in Walnut Creek
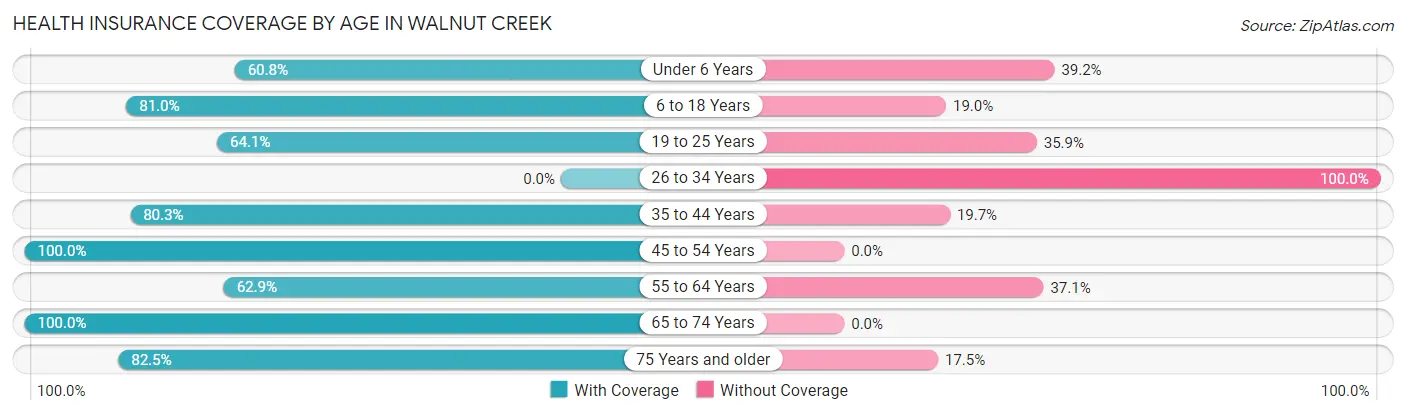
| Age Bracket | With Coverage | Without Coverage |
| Under 6 Years | 45 (60.8%) | 29 (39.2%) |
| 6 to 18 Years | 158 (81.0%) | 37 (19.0%) |
| 19 to 25 Years | 50 (64.1%) | 28 (35.9%) |
| 26 to 34 Years | 0 (0.0%) | 233 (100.0%) |
| 35 to 44 Years | 106 (80.3%) | 26 (19.7%) |
| 45 to 54 Years | 57 (100.0%) | 0 (0.0%) |
| 55 to 64 Years | 88 (62.9%) | 52 (37.1%) |
| 65 to 74 Years | 46 (100.0%) | 0 (0.0%) |
| 75 Years and older | 85 (82.5%) | 18 (17.5%) |
| Total | 635 (60.0%) | 423 (40.0%) |
Health Insurance Coverage by Citizenship Status in Walnut Creek
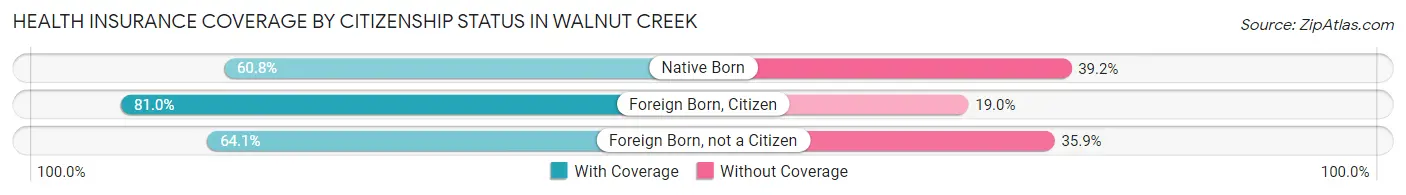
| Citizenship Status | With Coverage | Without Coverage |
| Native Born | 45 (60.8%) | 29 (39.2%) |
| Foreign Born, Citizen | 158 (81.0%) | 37 (19.0%) |
| Foreign Born, not a Citizen | 50 (64.1%) | 28 (35.9%) |
Health Insurance Coverage by Household Income in Walnut Creek
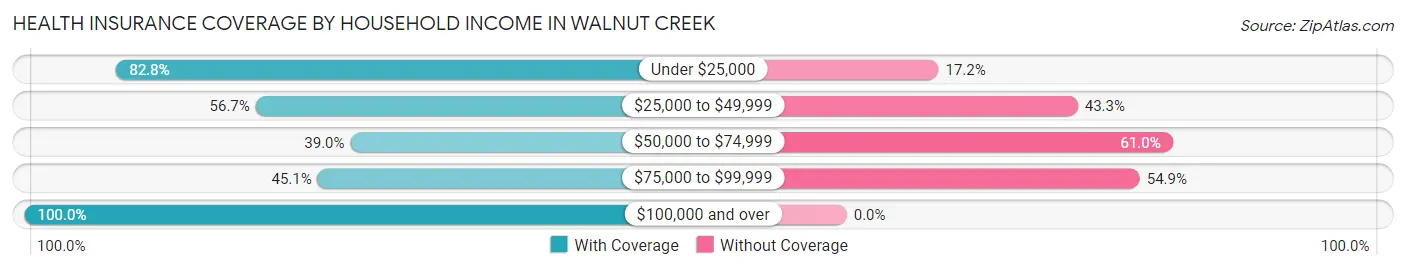
| Household Income | With Coverage | Without Coverage |
| Under $25,000 | 53 (82.8%) | 11 (17.2%) |
| $25,000 to $49,999 | 38 (56.7%) | 29 (43.3%) |
| $50,000 to $74,999 | 76 (39.0%) | 119 (61.0%) |
| $75,000 to $99,999 | 217 (45.1%) | 264 (54.9%) |
| $100,000 and over | 251 (100.0%) | 0 (0.0%) |
Public vs Private Health Insurance Coverage by Age in Walnut Creek
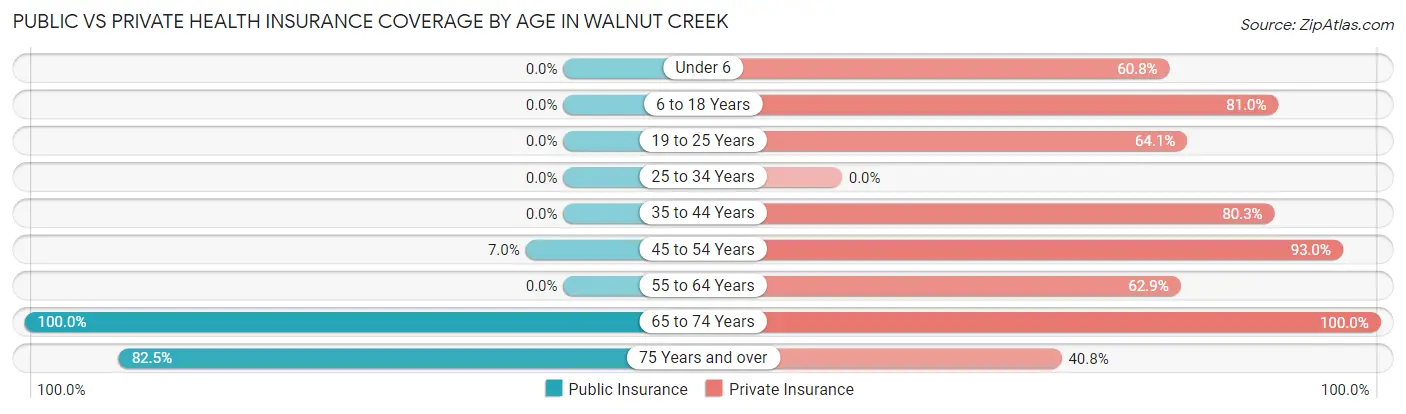
| Age Bracket | Public Insurance | Private Insurance |
| Under 6 | 0 (0.0%) | 45 (60.8%) |
| 6 to 18 Years | 0 (0.0%) | 158 (81.0%) |
| 19 to 25 Years | 0 (0.0%) | 50 (64.1%) |
| 25 to 34 Years | 0 (0.0%) | 0 (0.0%) |
| 35 to 44 Years | 0 (0.0%) | 106 (80.3%) |
| 45 to 54 Years | 4 (7.0%) | 53 (93.0%) |
| 55 to 64 Years | 0 (0.0%) | 88 (62.9%) |
| 65 to 74 Years | 46 (100.0%) | 46 (100.0%) |
| 75 Years and over | 85 (82.5%) | 42 (40.8%) |
| Total | 135 (12.8%) | 588 (55.6%) |
Disability Status by Sex by Age in Walnut Creek
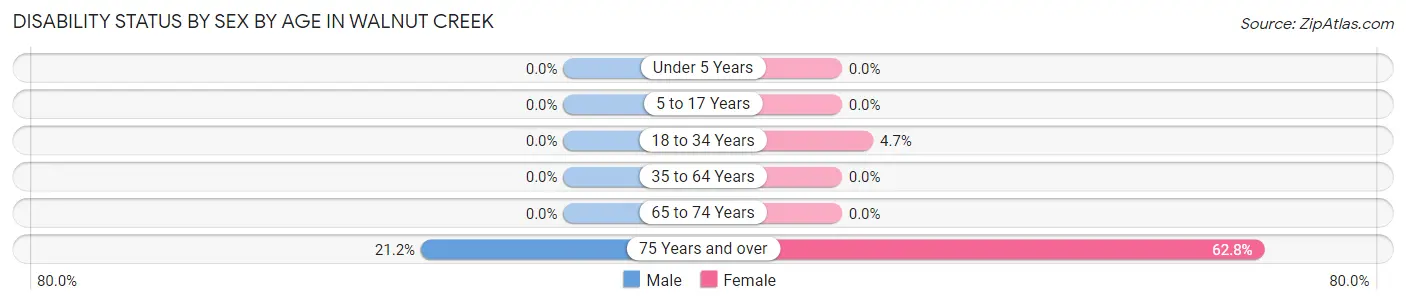
| Age Bracket | Male | Female |
| Under 5 Years | 0 (0.0%) | 0 (0.0%) |
| 5 to 17 Years | 0 (0.0%) | 0 (0.0%) |
| 18 to 34 Years | 0 (0.0%) | 6 (4.6%) |
| 35 to 64 Years | 0 (0.0%) | 0 (0.0%) |
| 65 to 74 Years | 0 (0.0%) | 0 (0.0%) |
| 75 Years and over | 11 (21.1%) | 32 (62.7%) |
Disability Class by Sex by Age in Walnut Creek
Disability Class: Hearing Difficulty
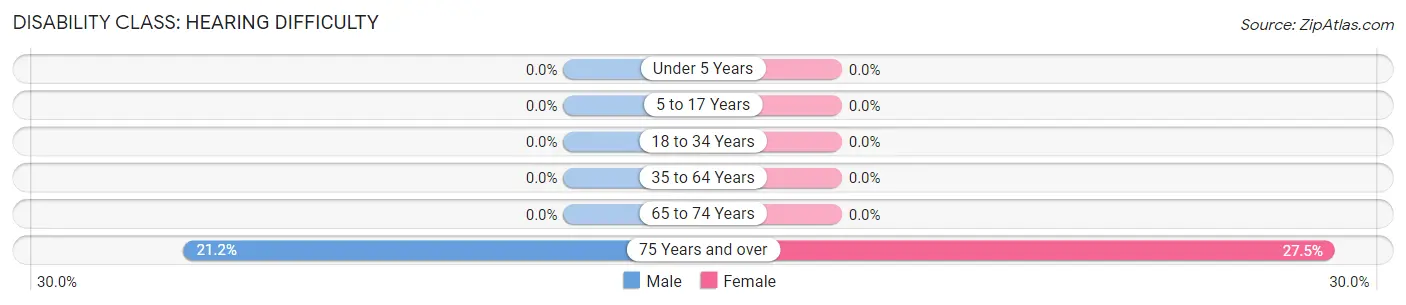
| Age Bracket | Male | Female |
| Under 5 Years | 0 (0.0%) | 0 (0.0%) |
| 5 to 17 Years | 0 (0.0%) | 0 (0.0%) |
| 18 to 34 Years | 0 (0.0%) | 0 (0.0%) |
| 35 to 64 Years | 0 (0.0%) | 0 (0.0%) |
| 65 to 74 Years | 0 (0.0%) | 0 (0.0%) |
| 75 Years and over | 11 (21.1%) | 14 (27.5%) |
Disability Class: Vision Difficulty
| Age Bracket | Male | Female |
| Under 5 Years | 0 (0.0%) | 0 (0.0%) |
| 5 to 17 Years | 0 (0.0%) | 0 (0.0%) |
| 18 to 34 Years | 0 (0.0%) | 0 (0.0%) |
| 35 to 64 Years | 0 (0.0%) | 0 (0.0%) |
| 65 to 74 Years | 0 (0.0%) | 0 (0.0%) |
| 75 Years and over | 0 (0.0%) | 0 (0.0%) |
Disability Class: Cognitive Difficulty

| Age Bracket | Male | Female |
| 5 to 17 Years | 0 (0.0%) | 0 (0.0%) |
| 18 to 34 Years | 0 (0.0%) | 0 (0.0%) |
| 35 to 64 Years | 0 (0.0%) | 0 (0.0%) |
| 65 to 74 Years | 0 (0.0%) | 0 (0.0%) |
| 75 Years and over | 0 (0.0%) | 0 (0.0%) |
Disability Class: Ambulatory Difficulty
| Age Bracket | Male | Female |
| 5 to 17 Years | 0 (0.0%) | 0 (0.0%) |
| 18 to 34 Years | 0 (0.0%) | 0 (0.0%) |
| 35 to 64 Years | 0 (0.0%) | 0 (0.0%) |
| 65 to 74 Years | 0 (0.0%) | 0 (0.0%) |
| 75 Years and over | 0 (0.0%) | 18 (35.3%) |
Disability Class: Self-Care Difficulty
| Age Bracket | Male | Female |
| 5 to 17 Years | 0 (0.0%) | 0 (0.0%) |
| 18 to 34 Years | 0 (0.0%) | 0 (0.0%) |
| 35 to 64 Years | 0 (0.0%) | 0 (0.0%) |
| 65 to 74 Years | 0 (0.0%) | 0 (0.0%) |
| 75 Years and over | 0 (0.0%) | 0 (0.0%) |
Technology Access in Walnut Creek
Computing Device Access in Walnut Creek
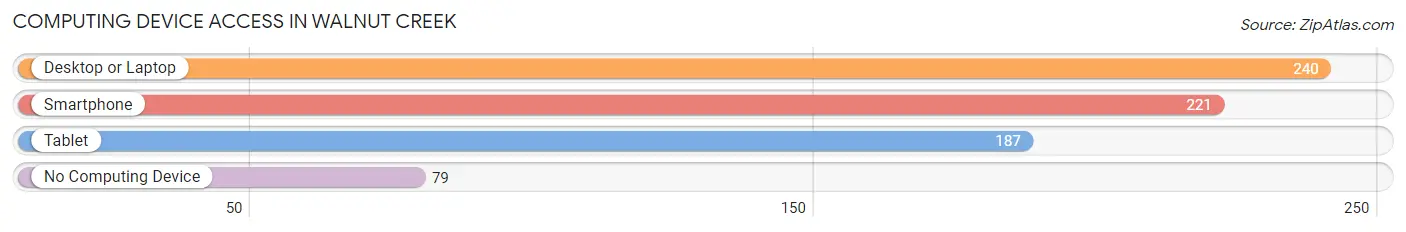
| Device Type | # Households | % Households |
| Desktop or Laptop | 240 | 75.2% |
| Smartphone | 221 | 69.3% |
| Tablet | 187 | 58.6% |
| No Computing Device | 79 | 24.8% |
| Total | 319 | 100.0% |
Internet Access in Walnut Creek
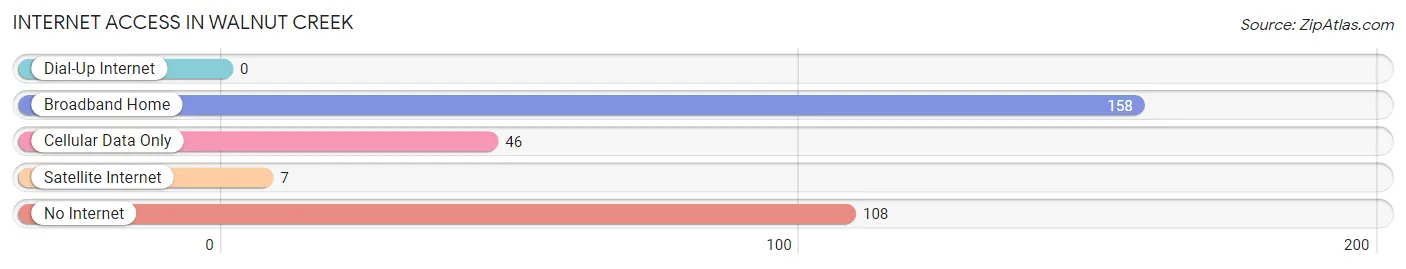
| Internet Type | # Households | % Households |
| Dial-Up Internet | 0 | 0.0% |
| Broadband Home | 158 | 49.5% |
| Cellular Data Only | 46 | 14.4% |
| Satellite Internet | 7 | 2.2% |
| No Internet | 108 | 33.9% |
| Total | 319 | 100.0% |
Walnut Creek Summary
Walnut Creek is a village located in the state of Ohio, in the United States. It is located in the county of Holmes, and is part of the Millersburg Micropolitan Statistical Area. The village has a population of approximately 1,000 people, and is located in the heart of Amish Country.
History
Walnut Creek was founded in 1817 by a group of settlers from Pennsylvania. The village was named after the nearby creek, which was named for the abundance of walnut trees that grew along its banks. The village was originally a farming community, and the settlers built a grist mill and a saw mill to process the grain and lumber. The village grew slowly, and by the mid-1800s, it had become a popular destination for tourists who wanted to experience the Amish culture.
In the late 1800s, the village began to experience a period of growth. The railroad was extended to the village, and a number of businesses opened up, including a hotel, a general store, and a blacksmith shop. The village also became a popular destination for tourists, who came to experience the Amish culture and to purchase handmade goods.
Geography
Walnut Creek is located in the heart of Amish Country, in the rolling hills of Holmes County. The village is situated on the banks of Walnut Creek, which flows through the village and is a popular spot for fishing and swimming. The village is surrounded by farmland, and is home to a number of Amish farms. The village is located approximately 30 miles from the city of Akron, and is within easy driving distance of Cleveland and Columbus.
Economy
The economy of Walnut Creek is largely based on agriculture and tourism. The village is home to a number of Amish farms, which produce a variety of crops, including corn, wheat, and hay. The village is also home to a number of businesses that cater to tourists, including restaurants, gift shops, and craft stores. The village is also home to a number of manufacturing businesses, which produce a variety of products, including furniture, clothing, and quilts.
Demographics
As of the 2010 census, the population of Walnut Creek was 1,000 people. The racial makeup of the village was 97.7% White, 0.3% African American, 0.2% Native American, 0.2% Asian, 0.1% from other races, and 1.5% from two or more races. The median household income was $37,500, and the median family income was $45,000. The per capita income was $18,000.
Conclusion
Walnut Creek is a small village located in the heart of Amish Country in Ohio. The village has a population of approximately 1,000 people, and is home to a number of Amish farms and businesses that cater to tourists. The economy of the village is largely based on agriculture and tourism, and the village is a popular destination for those looking to experience the Amish culture and purchase handmade goods. The population of the village is predominantly White, with a median household income of $37,500.
Common Questions
What is Per Capita Income in Walnut Creek?
Per Capita income in Walnut Creek is $28,584.
What is the Median Family Income in Walnut Creek?
Median Family Income in Walnut Creek is $91,042.
What is the Median Household income in Walnut Creek?
Median Household Income in Walnut Creek is $86,696.
What is Income or Wage Gap in Walnut Creek?
Income or Wage Gap in Walnut Creek is 55.8%.
Women in Walnut Creek earn 44.2 cents for every dollar earned by a man.
What is Inequality or Gini Index in Walnut Creek?
Inequality or Gini Index in Walnut Creek is 0.40.
What is the Total Population of Walnut Creek?
Total Population of Walnut Creek is 1,302.
What is the Total Male Population of Walnut Creek?
Total Male Population of Walnut Creek is 713.
What is the Total Female Population of Walnut Creek?
Total Female Population of Walnut Creek is 589.
What is the Ratio of Males per 100 Females in Walnut Creek?
There are 121.05 Males per 100 Females in Walnut Creek.
What is the Ratio of Females per 100 Males in Walnut Creek?
There are 82.61 Females per 100 Males in Walnut Creek.
What is the Median Population Age in Walnut Creek?
Median Population Age in Walnut Creek is 39.5 Years.
What is the Average Family Size in Walnut Creek
Average Family Size in Walnut Creek is 3.9 People.
What is the Average Household Size in Walnut Creek
Average Household Size in Walnut Creek is 3.3 People.
How Large is the Labor Force in Walnut Creek?
There are 615 People in the Labor Forcein in Walnut Creek.
What is the Percentage of People in the Labor Force in Walnut Creek?
57.6% of People are in the Labor Force in Walnut Creek.
What is the Unemployment Rate in Walnut Creek?
Unemployment Rate in Walnut Creek is 22.6%.