Zip Codes with the Highest Percentage of Hispanic or Latino Population in Springfield, OH
RELATED REPORTS & OPTIONS
Hispanic or Latino
Springfield
Compare Zip Codes
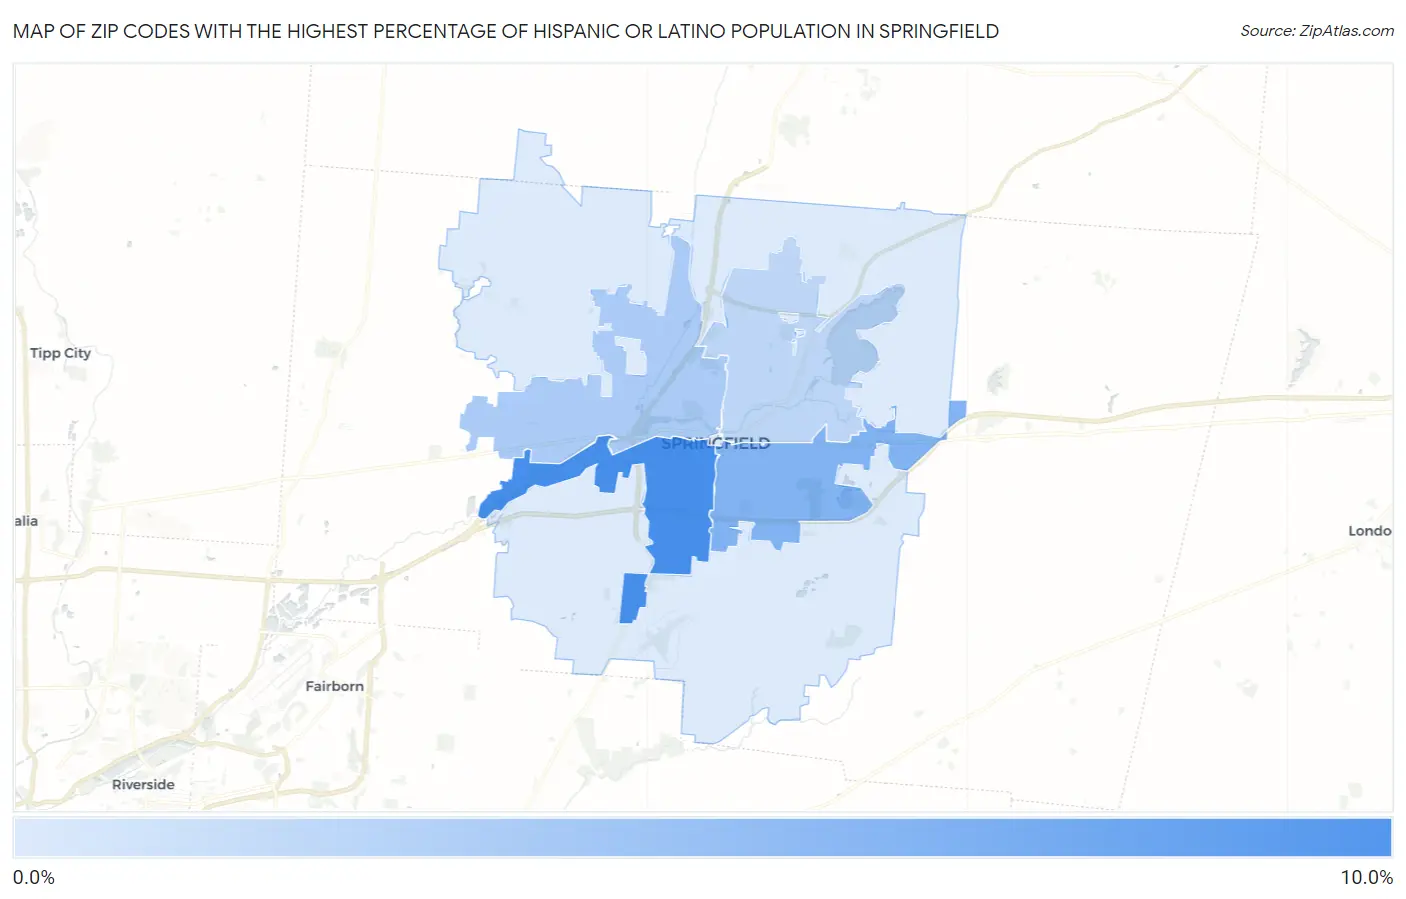
Map of Zip Codes with the Highest Percentage of Hispanic or Latino Population in Springfield
0.52%
8.4%
Zip Codes with the Highest Percentage of Hispanic or Latino Population in Springfield, OH
| Zip Code | Hispanic or Latino | vs State | vs National | |
| 1. | 45506 | 8.4% | 4.2%(+4.22)#97 | 18.7%(-10.2)#10,203 |
| 2. | 45505 | 5.3% | 4.2%(+1.07)#208 | 18.7%(-13.4)#13,848 |
| 3. | 45504 | 3.1% | 4.2%(-1.10)#394 | 18.7%(-15.5)#18,095 |
| 4. | 45503 | 2.1% | 4.2%(-2.08)#527 | 18.7%(-16.5)#20,699 |
| 5. | 45502 | 0.52% | 4.2%(-3.68)#878 | 18.7%(-18.1)#25,684 |
1
Common Questions
What are the Top 3 Zip Codes with the Highest Percentage of Hispanic or Latino Population in Springfield, OH?
Top 3 Zip Codes with the Highest Percentage of Hispanic or Latino Population in Springfield, OH are:
What zip code has the Highest Percentage of Hispanic or Latino Population in Springfield, OH?
45506 has the Highest Percentage of Hispanic or Latino Population in Springfield, OH with 8.4%.
What is the Percentage of Hispanic or Latino Population in Springfield, OH?
Percentage of Hispanic or Latino Population in Springfield is 4.9%.
What is the Percentage of Hispanic or Latino Population in Ohio?
Percentage of Hispanic or Latino Population in Ohio is 4.2%.
What is the Percentage of Hispanic or Latino Population in the United States?
Percentage of Hispanic or Latino Population in the United States is 18.7%.