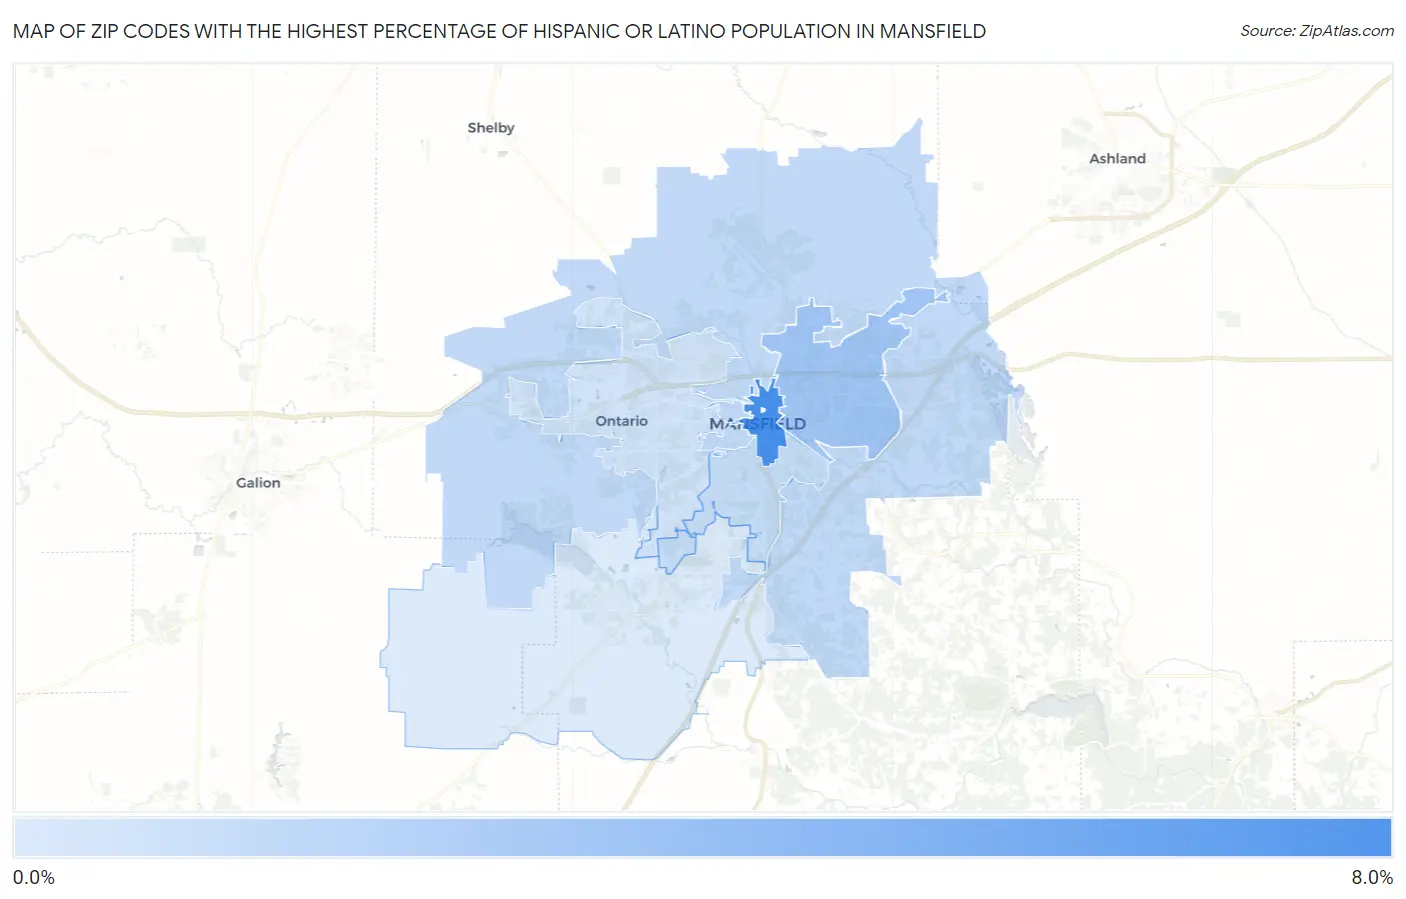
Zip Codes with the Highest Percentage of Hispanic or Latino Population in Mansfield, OH
RELATED REPORTS & OPTIONS
Hispanic or Latino
Mansfield
Compare Zip Codes
Map of Zip Codes with the Highest Percentage of Hispanic or Latino Population in Mansfield
0.95%
7.5%
Zip Codes with the Highest Percentage of Hispanic or Latino Population in Mansfield, OH
| Zip Code | Hispanic or Latino | vs State | vs National | |
| 1. | 44902 | 7.5% | 4.2%(+3.30)#121 | 18.7%(-11.2)#11,055 |
| 2. | 44905 | 3.6% | 4.2%(-0.637)#334 | 18.7%(-15.1)#17,018 |
| 3. | 44903 | 2.1% | 4.2%(-2.06)#524 | 18.7%(-16.5)#20,633 |
| 4. | 44907 | 1.9% | 4.2%(-2.31)#570 | 18.7%(-16.8)#21,375 |
| 5. | 44906 | 1.4% | 4.2%(-2.79)#673 | 18.7%(-17.2)#22,859 |
| 6. | 44904 | 0.95% | 4.2%(-3.25)#774 | 18.7%(-17.7)#24,291 |
1
Common Questions
What are the Top 5 Zip Codes with the Highest Percentage of Hispanic or Latino Population in Mansfield, OH?
Top 5 Zip Codes with the Highest Percentage of Hispanic or Latino Population in Mansfield, OH are:
What zip code has the Highest Percentage of Hispanic or Latino Population in Mansfield, OH?
44902 has the Highest Percentage of Hispanic or Latino Population in Mansfield, OH with 7.5%.
What is the Percentage of Hispanic or Latino Population in Mansfield, OH?
Percentage of Hispanic or Latino Population in Mansfield is 2.9%.
What is the Percentage of Hispanic or Latino Population in Ohio?
Percentage of Hispanic or Latino Population in Ohio is 4.2%.
What is the Percentage of Hispanic or Latino Population in the United States?
Percentage of Hispanic or Latino Population in the United States is 18.7%.