Ottawa, OH Map & Demographics
Ottawa Map
Ottawa Overview
$33,461
PER CAPITA INCOME
$94,286
AVG FAMILY INCOME
$61,379
AVG HOUSEHOLD INCOME
56.4%
WAGE / INCOME GAP [ % ]
43.6¢/ $1
WAGE / INCOME GAP [ $ ]
0.47
INEQUALITY / GINI INDEX
4,447
TOTAL POPULATION
2,114
MALE POPULATION
2,333
FEMALE POPULATION
90.61
MALES / 100 FEMALES
110.36
FEMALES / 100 MALES
42.2
MEDIAN AGE
3.5
AVG FAMILY SIZE
2.5
AVG HOUSEHOLD SIZE
2,044
LABOR FORCE [ PEOPLE ]
58.0%
PERCENT IN LABOR FORCE
Ottawa Zip Codes
Income in Ottawa
Income Overview in Ottawa
Per Capita Income in Ottawa is $33,461, while median incomes of families and households are $94,286 and $61,379 respectively.
| Characteristic | Number | Measure |
| Per Capita Income | 4,447 | $33,461 |
| Median Family Income | 1,016 | $94,286 |
| Mean Family Income | 1,016 | $110,610 |
| Median Household Income | 1,750 | $61,379 |
| Mean Household Income | 1,750 | $77,201 |
| Income Deficit | 1,016 | $0 |
| Wage / Income Gap (%) | 4,447 | 56.37% |
| Wage / Income Gap ($) | 4,447 | 43.63¢ per $1 |
| Gini / Inequality Index | 4,447 | 0.47 |
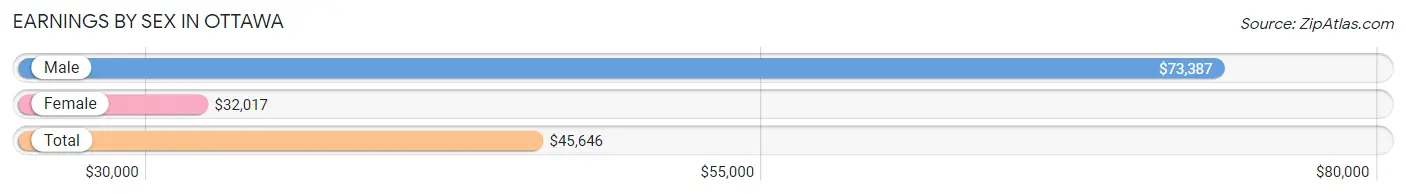
Earnings by Sex in Ottawa
Average Earnings in Ottawa are $45,646, $73,387 for men and $32,017 for women, a difference of 56.4%.
| Sex | Number | Average Earnings |
| Male | 1,150 (53.8%) | $73,387 |
| Female | 989 (46.2%) | $32,017 |
| Total | 2,139 (100.0%) | $45,646 |
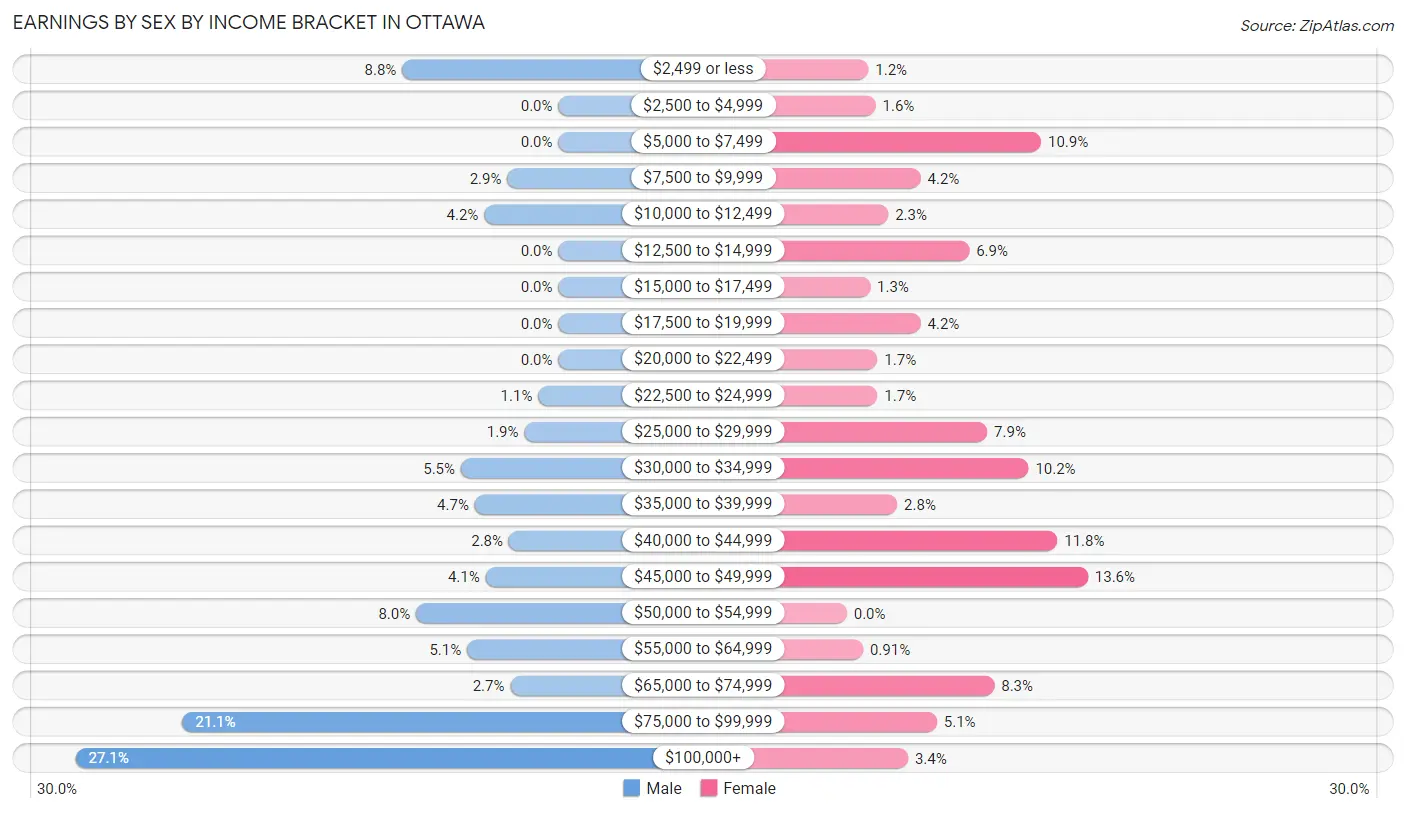
Earnings by Sex by Income Bracket in Ottawa
The most common earnings brackets in Ottawa are $100,000+ for men (312 | 27.1%) and $45,000 to $49,999 for women (134 | 13.6%).
| Income | Male | Female |
| $2,499 or less | 101 (8.8%) | 12 (1.2%) |
| $2,500 to $4,999 | 0 (0.0%) | 16 (1.6%) |
| $5,000 to $7,499 | 0 (0.0%) | 108 (10.9%) |
| $7,500 to $9,999 | 33 (2.9%) | 41 (4.2%) |
| $10,000 to $12,499 | 48 (4.2%) | 23 (2.3%) |
| $12,500 to $14,999 | 0 (0.0%) | 68 (6.9%) |
| $15,000 to $17,499 | 0 (0.0%) | 13 (1.3%) |
| $17,500 to $19,999 | 0 (0.0%) | 41 (4.2%) |
| $20,000 to $22,499 | 0 (0.0%) | 17 (1.7%) |
| $22,500 to $24,999 | 13 (1.1%) | 17 (1.7%) |
| $25,000 to $29,999 | 22 (1.9%) | 78 (7.9%) |
| $30,000 to $34,999 | 63 (5.5%) | 101 (10.2%) |
| $35,000 to $39,999 | 54 (4.7%) | 28 (2.8%) |
| $40,000 to $44,999 | 32 (2.8%) | 117 (11.8%) |
| $45,000 to $49,999 | 47 (4.1%) | 134 (13.6%) |
| $50,000 to $54,999 | 92 (8.0%) | 0 (0.0%) |
| $55,000 to $64,999 | 59 (5.1%) | 9 (0.9%) |
| $65,000 to $74,999 | 31 (2.7%) | 82 (8.3%) |
| $75,000 to $99,999 | 243 (21.1%) | 50 (5.1%) |
| $100,000+ | 312 (27.1%) | 34 (3.4%) |
| Total | 1,150 (100.0%) | 989 (100.0%) |
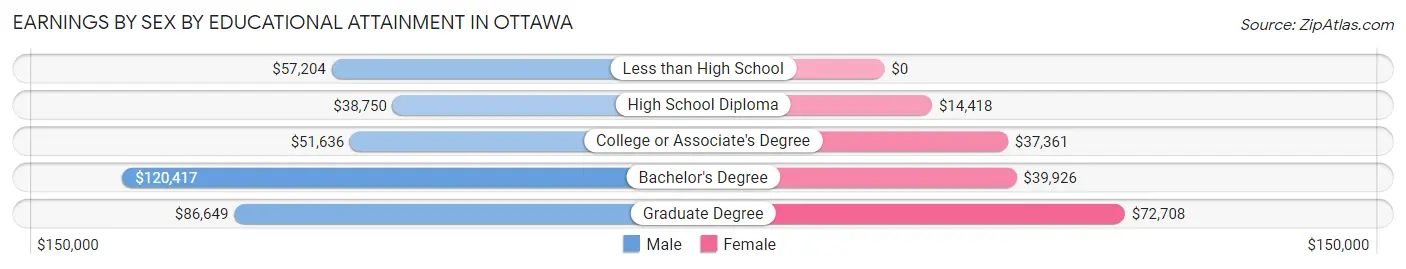
Earnings by Sex by Educational Attainment in Ottawa
Average earnings in Ottawa are $76,452 for men and $40,192 for women, a difference of 47.4%. Men with an educational attainment of bachelor's degree enjoy the highest average annual earnings of $120,417, while those with high school diploma education earn the least with $38,750. Women with an educational attainment of graduate degree earn the most with the average annual earnings of $72,708, while those with high school diploma education have the smallest earnings of $14,418.
| Educational Attainment | Male Income | Female Income |
| Less than High School | $57,204 | $0 |
| High School Diploma | $38,750 | $14,418 |
| College or Associate's Degree | $51,636 | $37,361 |
| Bachelor's Degree | $120,417 | $39,926 |
| Graduate Degree | $86,649 | $72,708 |
| Total | $76,452 | $40,192 |
Family Income in Ottawa
Family Income Brackets in Ottawa
According to the Ottawa family income data, there are 229 families falling into the $150,000 to $199,999 income range, which is the most common income bracket and makes up 22.5% of all families.
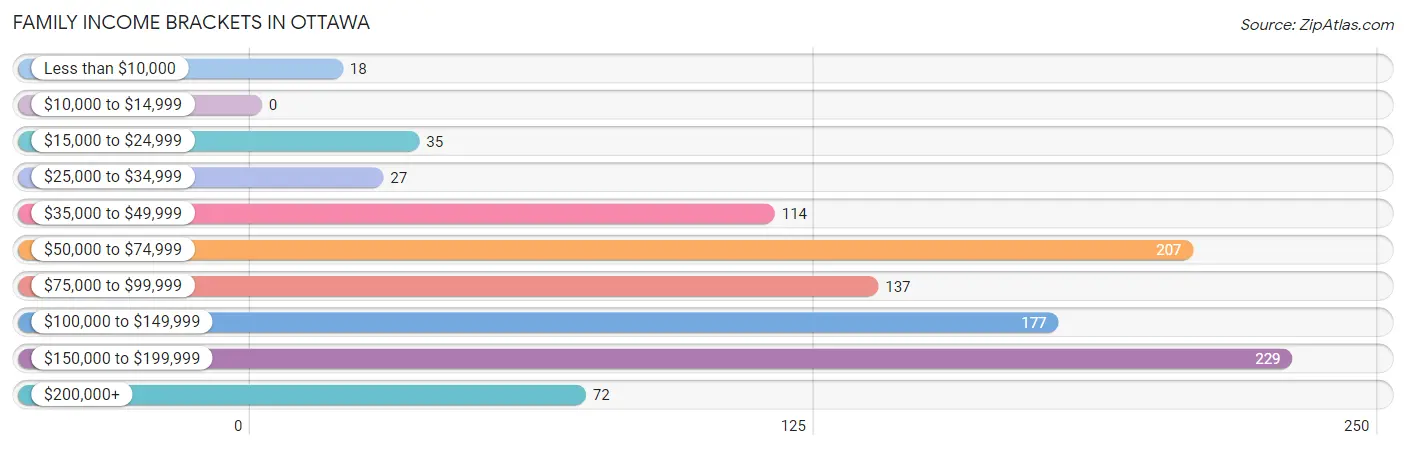
| Income Bracket | # Families | % Families |
| Less than $10,000 | 18 | 1.8% |
| $10,000 to $14,999 | 0 | 0.0% |
| $15,000 to $24,999 | 35 | 3.4% |
| $25,000 to $34,999 | 27 | 2.7% |
| $35,000 to $49,999 | 114 | 11.2% |
| $50,000 to $74,999 | 207 | 20.4% |
| $75,000 to $99,999 | 137 | 13.5% |
| $100,000 to $149,999 | 177 | 17.4% |
| $150,000 to $199,999 | 229 | 22.5% |
| $200,000+ | 72 | 7.1% |
Family Income by Famaliy Size in Ottawa
5-person families (174 | 17.1%) account for the highest median family income in Ottawa with $162,857 per family, while 3-person families (175 | 17.2%) have the highest median income of $41,477 per family member.
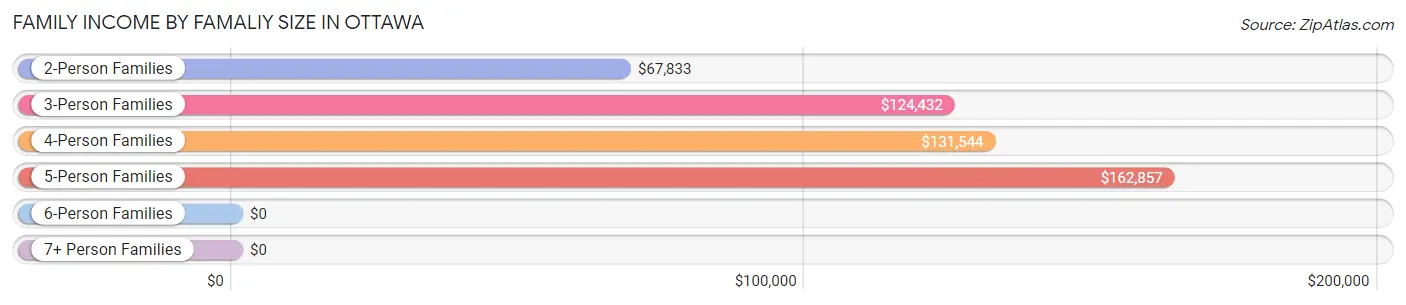
| Income Bracket | # Families | Median Income |
| 2-Person Families | 410 (40.4%) | $67,833 |
| 3-Person Families | 175 (17.2%) | $124,432 |
| 4-Person Families | 201 (19.8%) | $131,544 |
| 5-Person Families | 174 (17.1%) | $162,857 |
| 6-Person Families | 29 (2.9%) | $0 |
| 7+ Person Families | 27 (2.7%) | $0 |
| Total | 1,016 (100.0%) | $94,286 |
Family Income by Number of Earners in Ottawa
The median family income in Ottawa is $94,286, with families comprising 3+ earners (166) having the highest median family income of $153,750, while families with no earners (218) have the lowest median family income of $39,643, accounting for 16.3% and 21.5% of families, respectively.
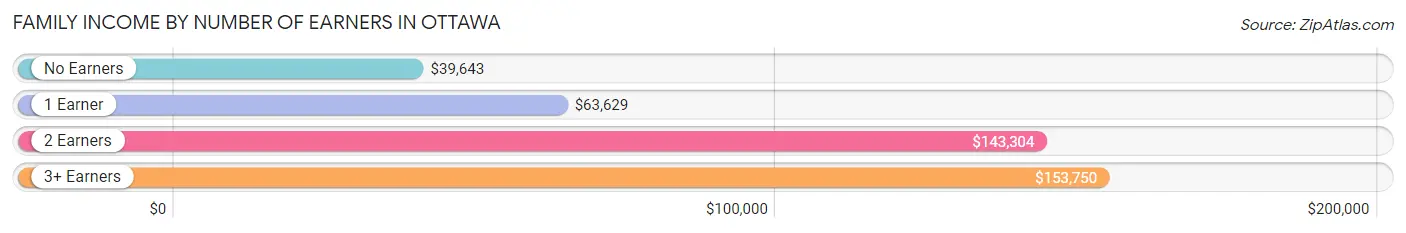
| Number of Earners | # Families | Median Income |
| No Earners | 218 (21.5%) | $39,643 |
| 1 Earner | 176 (17.3%) | $63,629 |
| 2 Earners | 456 (44.9%) | $143,304 |
| 3+ Earners | 166 (16.3%) | $153,750 |
| Total | 1,016 (100.0%) | $94,286 |
Household Income in Ottawa
Household Income Brackets in Ottawa
With 296 households falling in the category, the $50,000 to $74,999 income range is the most frequent in Ottawa, accounting for 16.9% of all households. In contrast, only 72 households (4.1%) fall into the $200,000+ income bracket, making it the least populous group.
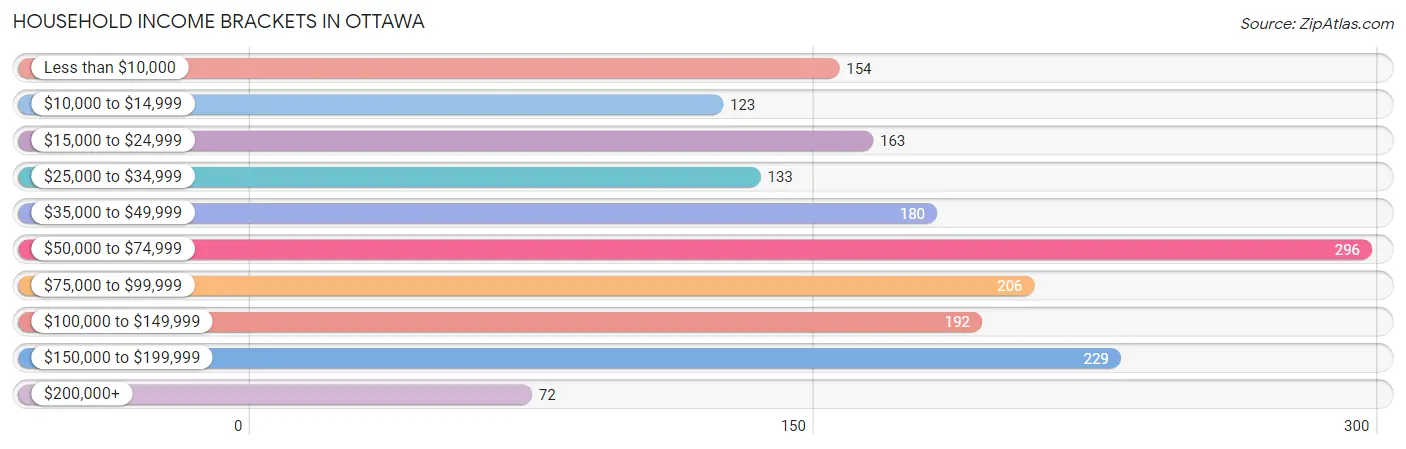
| Income Bracket | # Households | % Households |
| Less than $10,000 | 154 | 8.8% |
| $10,000 to $14,999 | 123 | 7.0% |
| $15,000 to $24,999 | 163 | 9.3% |
| $25,000 to $34,999 | 133 | 7.6% |
| $35,000 to $49,999 | 180 | 10.3% |
| $50,000 to $74,999 | 296 | 16.9% |
| $75,000 to $99,999 | 206 | 11.8% |
| $100,000 to $149,999 | 192 | 11.0% |
| $150,000 to $199,999 | 229 | 13.1% |
| $200,000+ | 72 | 4.1% |
Household Income by Householder Age in Ottawa
The median household income in Ottawa is $61,379, with the highest median household income of $142,589 found in the 25 to 44 years age bracket for the primary householder. A total of 370 households (21.1%) fall into this category. Meanwhile, the 15 to 24 years age bracket for the primary householder has the lowest median household income of $0, with 61 households (3.5%) in this group.
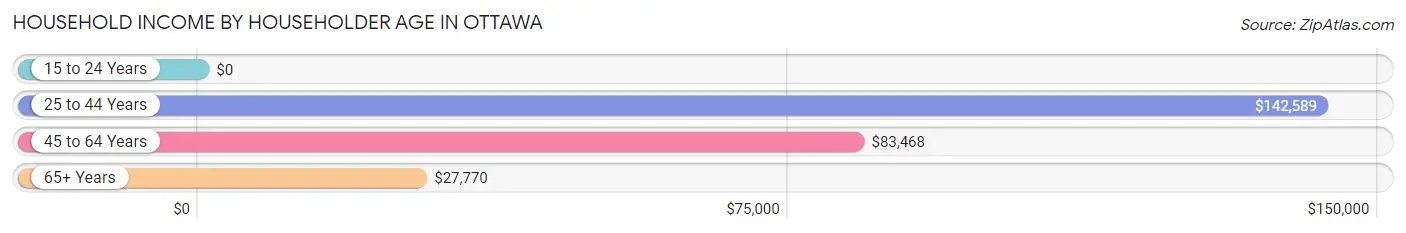
| Income Bracket | # Households | Median Income |
| 15 to 24 Years | 61 (3.5%) | $0 |
| 25 to 44 Years | 370 (21.1%) | $142,589 |
| 45 to 64 Years | 688 (39.3%) | $83,468 |
| 65+ Years | 631 (36.1%) | $27,770 |
| Total | 1,750 (100.0%) | $61,379 |
Poverty in Ottawa
Income Below Poverty by Sex and Age in Ottawa
With 6.0% poverty level for males and 14.3% for females among the residents of Ottawa, 6 to 11 year old males and 65 to 74 year old females are the most vulnerable to poverty, with 45 males (32.9%) and 102 females (35.5%) in their respective age groups living below the poverty level.
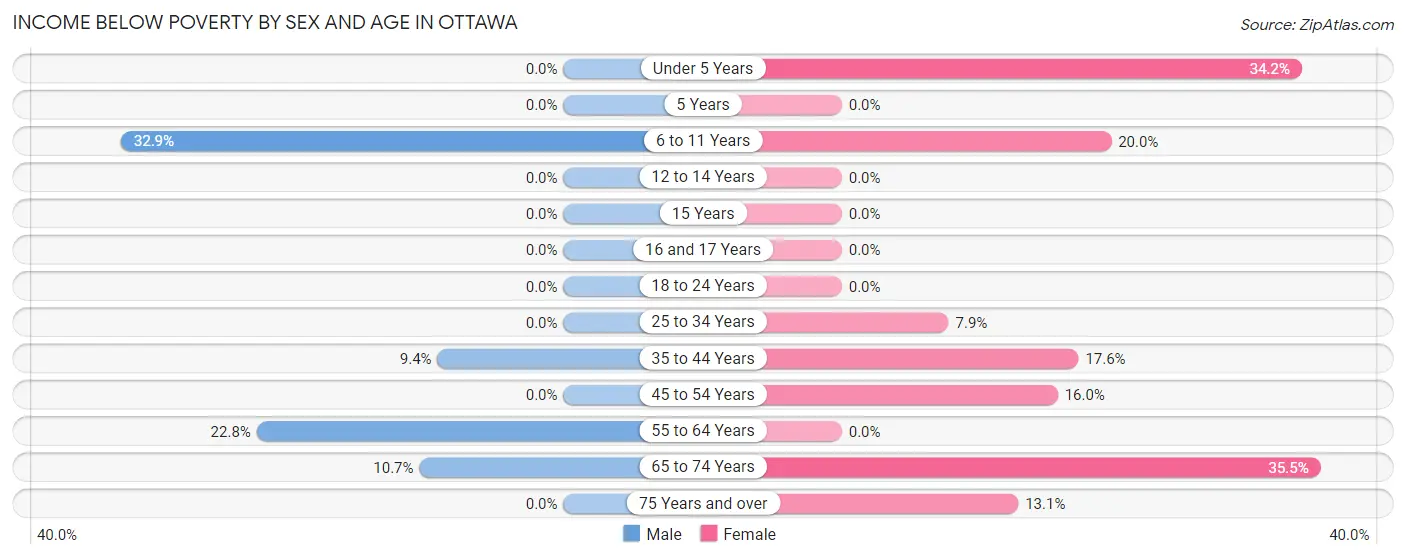
| Age Bracket | Male | Female |
| Under 5 Years | 0 (0.0%) | 14 (34.2%) |
| 5 Years | 0 (0.0%) | 0 (0.0%) |
| 6 to 11 Years | 45 (32.9%) | 58 (20.0%) |
| 12 to 14 Years | 0 (0.0%) | 0 (0.0%) |
| 15 Years | 0 (0.0%) | 0 (0.0%) |
| 16 and 17 Years | 0 (0.0%) | 0 (0.0%) |
| 18 to 24 Years | 0 (0.0%) | 0 (0.0%) |
| 25 to 34 Years | 0 (0.0%) | 13 (7.9%) |
| 35 to 44 Years | 13 (9.3%) | 39 (17.6%) |
| 45 to 54 Years | 0 (0.0%) | 55 (16.0%) |
| 55 to 64 Years | 51 (22.8%) | 0 (0.0%) |
| 65 to 74 Years | 17 (10.7%) | 102 (35.5%) |
| 75 Years and over | 0 (0.0%) | 44 (13.1%) |
| Total | 126 (6.0%) | 325 (14.3%) |
Income Above Poverty by Sex and Age in Ottawa
According to the poverty statistics in Ottawa, males aged under 5 years and females aged 5 years are the age groups that are most secure financially, with 100.0% of males and 100.0% of females in these age groups living above the poverty line.
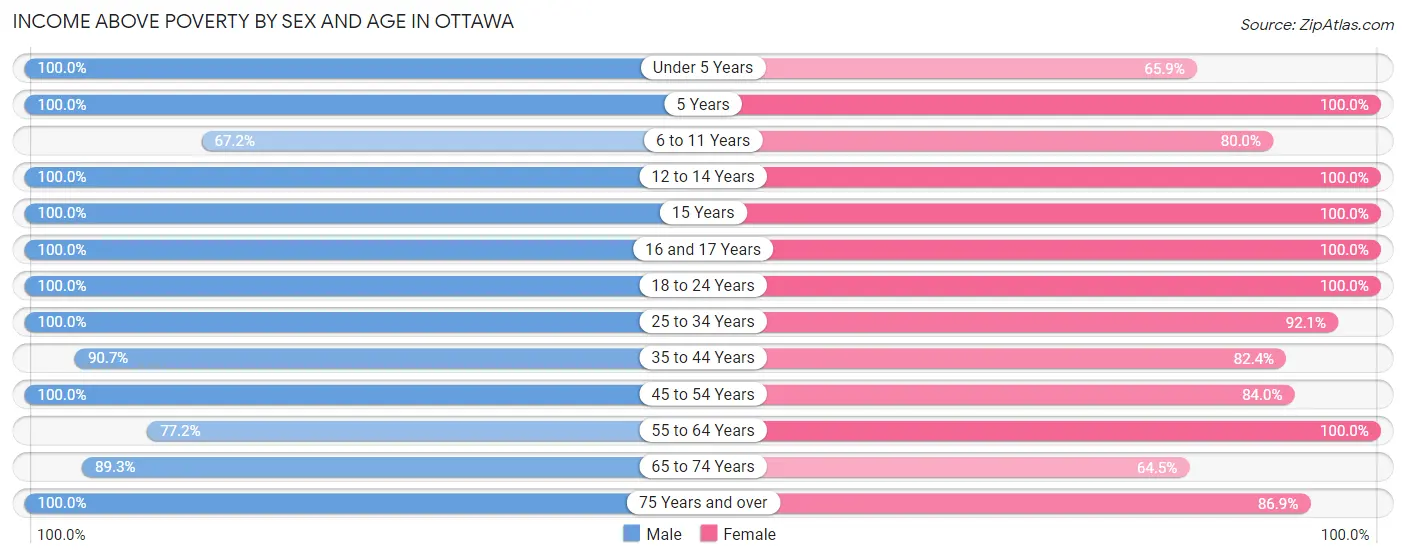
| Age Bracket | Male | Female |
| Under 5 Years | 132 (100.0%) | 27 (65.8%) |
| 5 Years | 49 (100.0%) | 10 (100.0%) |
| 6 to 11 Years | 92 (67.1%) | 232 (80.0%) |
| 12 to 14 Years | 90 (100.0%) | 32 (100.0%) |
| 15 Years | 23 (100.0%) | 101 (100.0%) |
| 16 and 17 Years | 111 (100.0%) | 26 (100.0%) |
| 18 to 24 Years | 332 (100.0%) | 248 (100.0%) |
| 25 to 34 Years | 180 (100.0%) | 151 (92.1%) |
| 35 to 44 Years | 126 (90.6%) | 183 (82.4%) |
| 45 to 54 Years | 436 (100.0%) | 288 (84.0%) |
| 55 to 64 Years | 173 (77.2%) | 174 (100.0%) |
| 65 to 74 Years | 142 (89.3%) | 185 (64.5%) |
| 75 Years and over | 74 (100.0%) | 292 (86.9%) |
| Total | 1,960 (94.0%) | 1,949 (85.7%) |
Income Below Poverty Among Married-Couple Families in Ottawa
The poverty statistics for married-couple families in Ottawa show that 2.0% or 18 of the total 886 families live below the poverty line. Families with 1 or 2 children have the highest poverty rate of 3.7%, comprising of 13 families. On the other hand, families with 3 or 4 children have the lowest poverty rate of 0.0%, which includes 0 families.
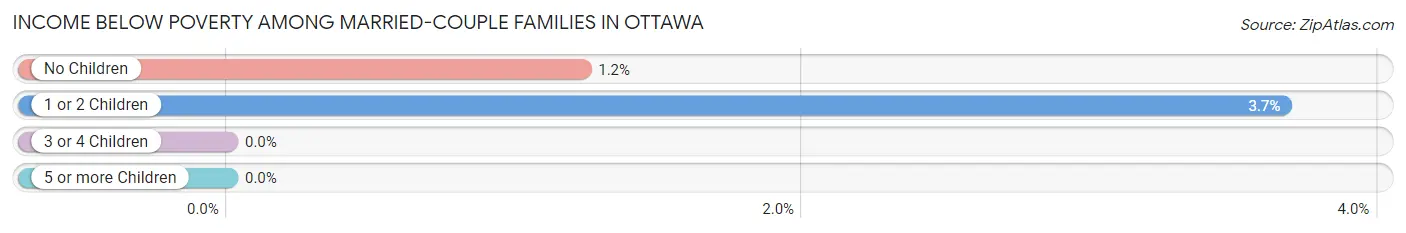
| Children | Above Poverty | Below Poverty |
| No Children | 403 (98.8%) | 5 (1.2%) |
| 1 or 2 Children | 341 (96.3%) | 13 (3.7%) |
| 3 or 4 Children | 97 (100.0%) | 0 (0.0%) |
| 5 or more Children | 27 (100.0%) | 0 (0.0%) |
| Total | 868 (98.0%) | 18 (2.0%) |
Income Below Poverty Among Single-Parent Households in Ottawa
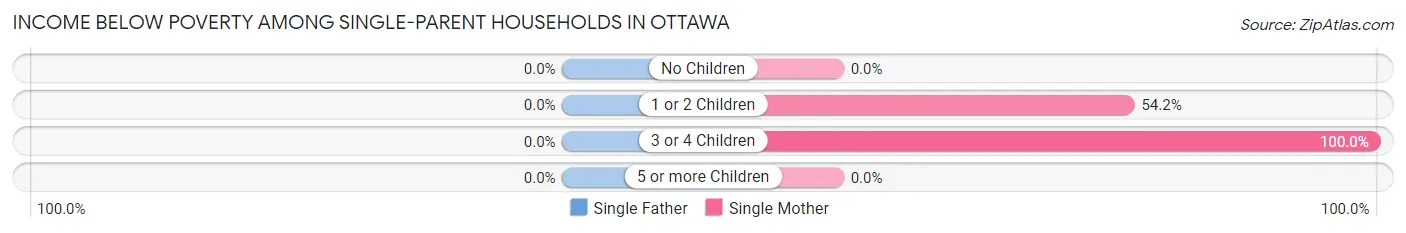
| Children | Single Father | Single Mother |
| No Children | 0 (0.0%) | 0 (0.0%) |
| 1 or 2 Children | 0 (0.0%) | 26 (54.2%) |
| 3 or 4 Children | 0 (0.0%) | 14 (100.0%) |
| 5 or more Children | 0 (0.0%) | 0 (0.0%) |
| Total | 0 (0.0%) | 40 (41.7%) |
Income Below Poverty Among Married-Couple vs Single-Parent Households in Ottawa
The poverty data for Ottawa shows that 18 of the married-couple family households (2.0%) and 40 of the single-parent households (30.8%) are living below the poverty level. Within the married-couple family households, those with 1 or 2 children have the highest poverty rate, with 13 households (3.7%) falling below the poverty line. Among the single-parent households, those with 1 or 2 children have the highest poverty rate, with 26 household (54.2%) living below poverty.
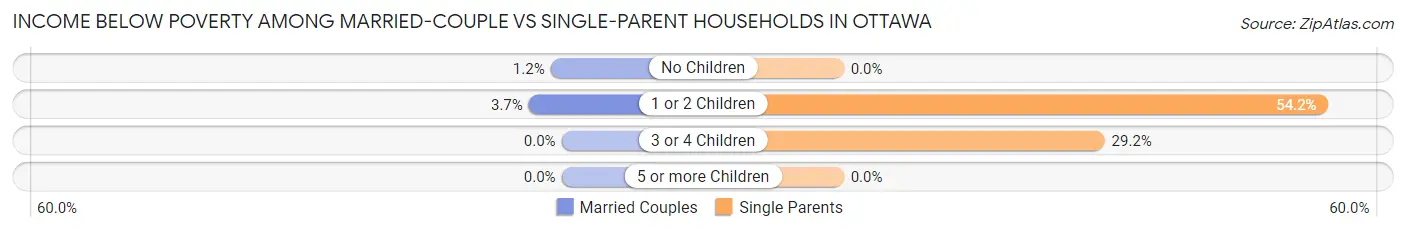
| Children | Married-Couple Families | Single-Parent Households |
| No Children | 5 (1.2%) | 0 (0.0%) |
| 1 or 2 Children | 13 (3.7%) | 26 (54.2%) |
| 3 or 4 Children | 0 (0.0%) | 14 (29.2%) |
| 5 or more Children | 0 (0.0%) | 0 (0.0%) |
| Total | 18 (2.0%) | 40 (30.8%) |
Race in Ottawa
The most populous races in Ottawa are White / Caucasian (3,813 | 85.7%), Hispanic or Latino (567 | 12.8%), and Two or more Races (258 | 5.8%).
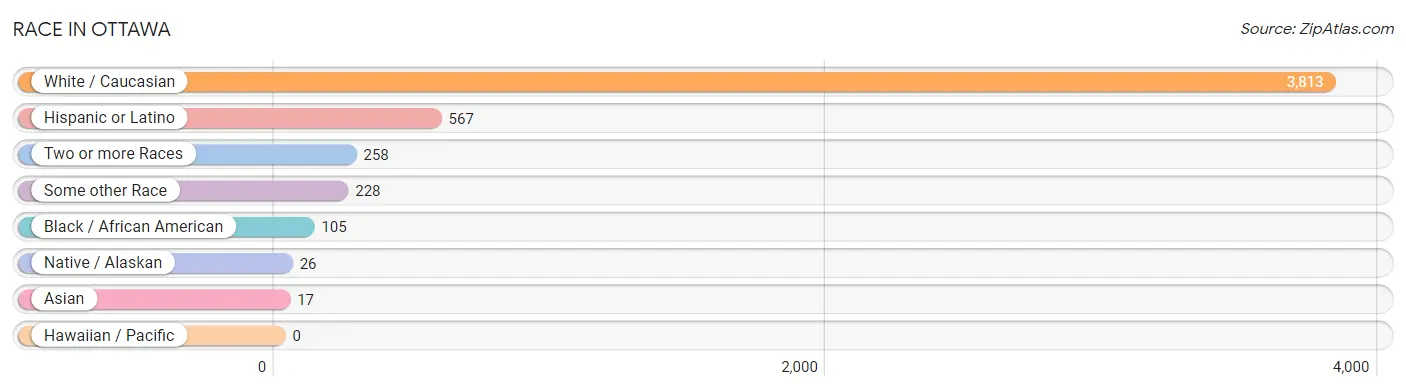
| Race | # Population | % Population |
| Asian | 17 | 0.4% |
| Black / African American | 105 | 2.4% |
| Hawaiian / Pacific | 0 | 0.0% |
| Hispanic or Latino | 567 | 12.8% |
| Native / Alaskan | 26 | 0.6% |
| White / Caucasian | 3,813 | 85.7% |
| Two or more Races | 258 | 5.8% |
| Some other Race | 228 | 5.1% |
| Total | 4,447 | 100.0% |
Ancestry in Ottawa
The most populous ancestries reported in Ottawa are German (2,083 | 46.8%), Mexican (434 | 9.8%), English (358 | 8.1%), Irish (197 | 4.4%), and Italian (195 | 4.4%), together accounting for 73.5% of all Ottawa residents.
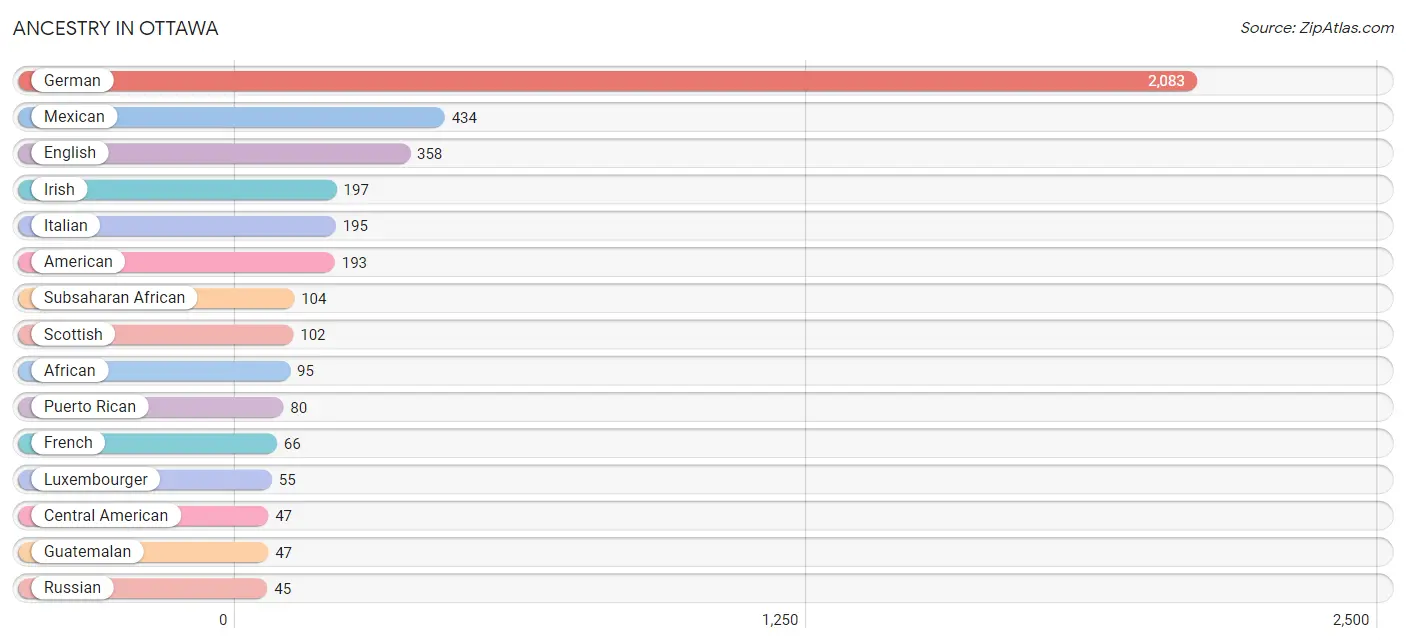
| Ancestry | # Population | % Population |
| African | 95 | 2.1% |
| American | 193 | 4.3% |
| Belgian | 13 | 0.3% |
| Celtic | 21 | 0.5% |
| Central American | 47 | 1.1% |
| Czech | 18 | 0.4% |
| Czechoslovakian | 7 | 0.2% |
| Dutch | 27 | 0.6% |
| English | 358 | 8.1% |
| French | 66 | 1.5% |
| French American Indian | 26 | 0.6% |
| German | 2,083 | 46.8% |
| German Russian | 18 | 0.4% |
| Guatemalan | 47 | 1.1% |
| Irish | 197 | 4.4% |
| Italian | 195 | 4.4% |
| Korean | 32 | 0.7% |
| Luxembourger | 55 | 1.2% |
| Mexican | 434 | 9.8% |
| Norwegian | 17 | 0.4% |
| Peruvian | 6 | 0.1% |
| Polish | 30 | 0.7% |
| Puerto Rican | 80 | 1.8% |
| Russian | 45 | 1.0% |
| Scotch-Irish | 12 | 0.3% |
| Scottish | 102 | 2.3% |
| South American | 6 | 0.1% |
| Subsaharan African | 104 | 2.3% |
| Swiss | 31 | 0.7% |
| Welsh | 11 | 0.3% | View All 30 Rows |
Immigrants in Ottawa
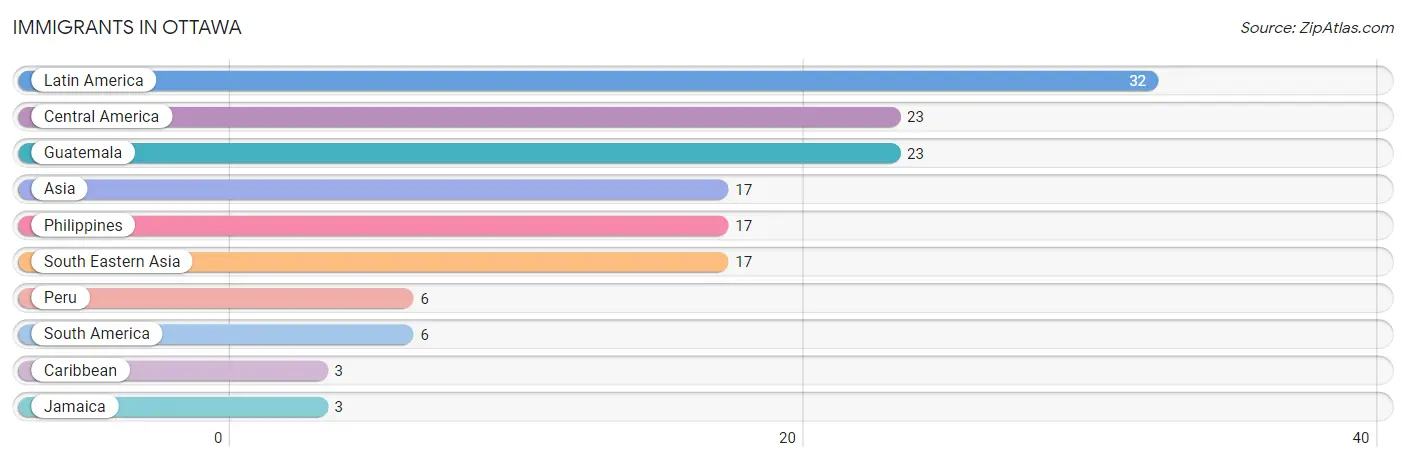
The most numerous immigrant groups reported in Ottawa came from Latin America (32 | 0.7%), Central America (23 | 0.5%), Guatemala (23 | 0.5%), Asia (17 | 0.4%), and Philippines (17 | 0.4%), together accounting for 2.5% of all Ottawa residents.
| Immigration Origin | # Population | % Population |
| Asia | 17 | 0.4% |
| Caribbean | 3 | 0.1% |
| Central America | 23 | 0.5% |
| Guatemala | 23 | 0.5% |
| Jamaica | 3 | 0.1% |
| Latin America | 32 | 0.7% |
| Peru | 6 | 0.1% |
| Philippines | 17 | 0.4% |
| South America | 6 | 0.1% |
| South Eastern Asia | 17 | 0.4% | View All 10 Rows |
Sex and Age in Ottawa
Sex and Age in Ottawa
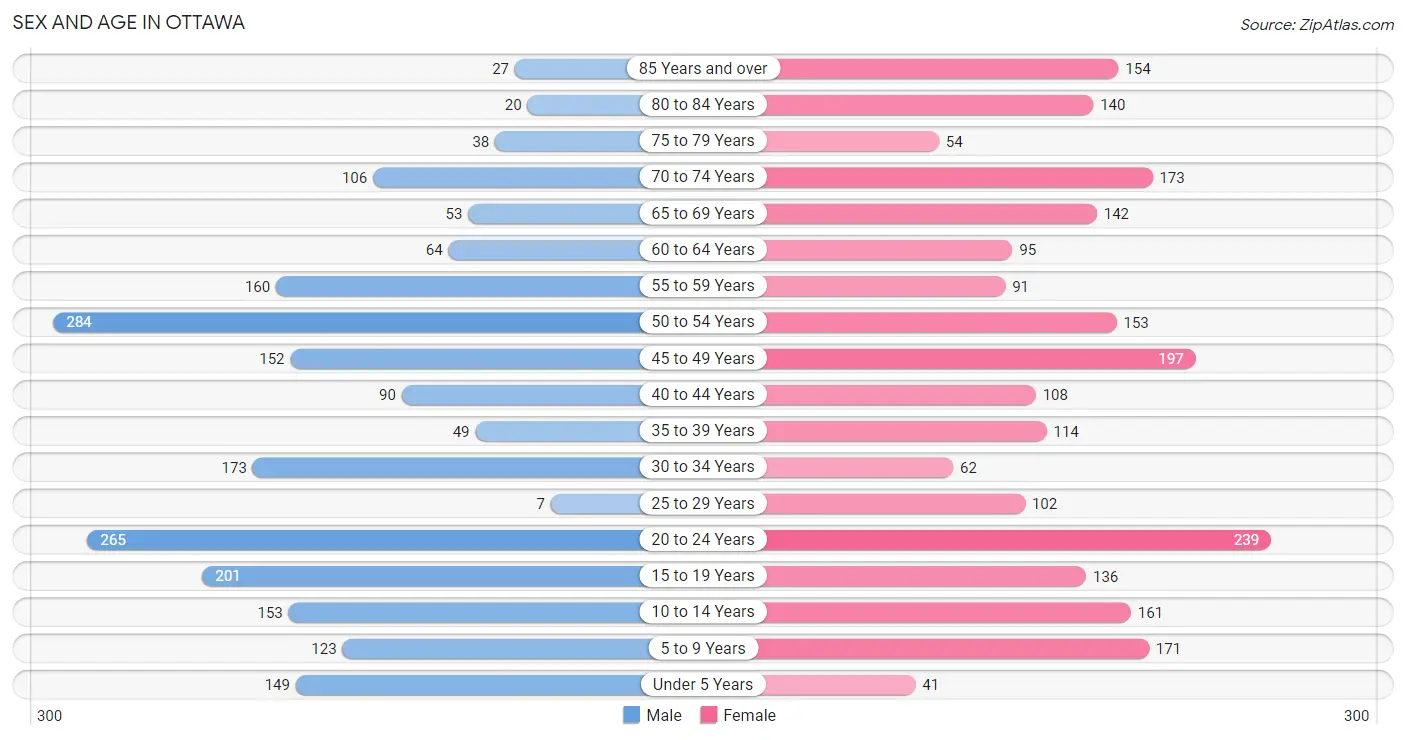
The most populous age groups in Ottawa are 50 to 54 Years (284 | 13.4%) for men and 20 to 24 Years (239 | 10.2%) for women.
| Age Bracket | Male | Female |
| Under 5 Years | 149 (7.0%) | 41 (1.8%) |
| 5 to 9 Years | 123 (5.8%) | 171 (7.3%) |
| 10 to 14 Years | 153 (7.2%) | 161 (6.9%) |
| 15 to 19 Years | 201 (9.5%) | 136 (5.8%) |
| 20 to 24 Years | 265 (12.5%) | 239 (10.2%) |
| 25 to 29 Years | 7 (0.3%) | 102 (4.4%) |
| 30 to 34 Years | 173 (8.2%) | 62 (2.7%) |
| 35 to 39 Years | 49 (2.3%) | 114 (4.9%) |
| 40 to 44 Years | 90 (4.3%) | 108 (4.6%) |
| 45 to 49 Years | 152 (7.2%) | 197 (8.4%) |
| 50 to 54 Years | 284 (13.4%) | 153 (6.6%) |
| 55 to 59 Years | 160 (7.6%) | 91 (3.9%) |
| 60 to 64 Years | 64 (3.0%) | 95 (4.1%) |
| 65 to 69 Years | 53 (2.5%) | 142 (6.1%) |
| 70 to 74 Years | 106 (5.0%) | 173 (7.4%) |
| 75 to 79 Years | 38 (1.8%) | 54 (2.3%) |
| 80 to 84 Years | 20 (0.9%) | 140 (6.0%) |
| 85 Years and over | 27 (1.3%) | 154 (6.6%) |
| Total | 2,114 (100.0%) | 2,333 (100.0%) |
Families and Households in Ottawa
Median Family Size in Ottawa
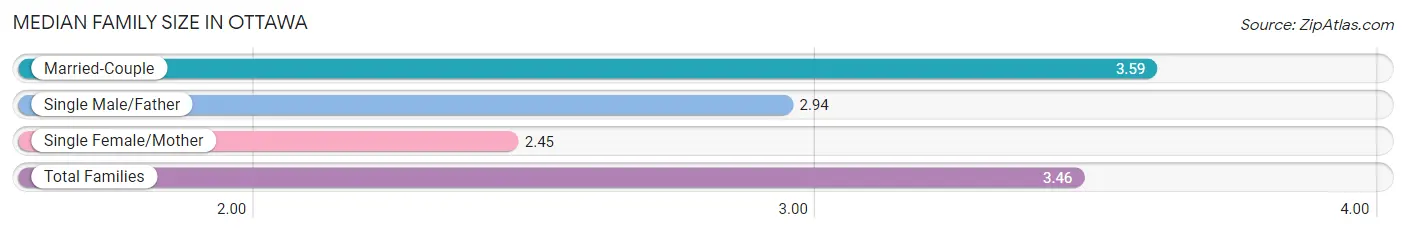
The median family size in Ottawa is 3.46 persons per family, with married-couple families (886 | 87.2%) accounting for the largest median family size of 3.59 persons per family. On the other hand, single female/mother families (96 | 9.5%) represent the smallest median family size with 2.45 persons per family.
| Family Type | # Families | Family Size |
| Married-Couple | 886 (87.2%) | 3.59 |
| Single Male/Father | 34 (3.4%) | 2.94 |
| Single Female/Mother | 96 (9.5%) | 2.45 |
| Total Families | 1,016 (100.0%) | 3.46 |
Median Household Size in Ottawa
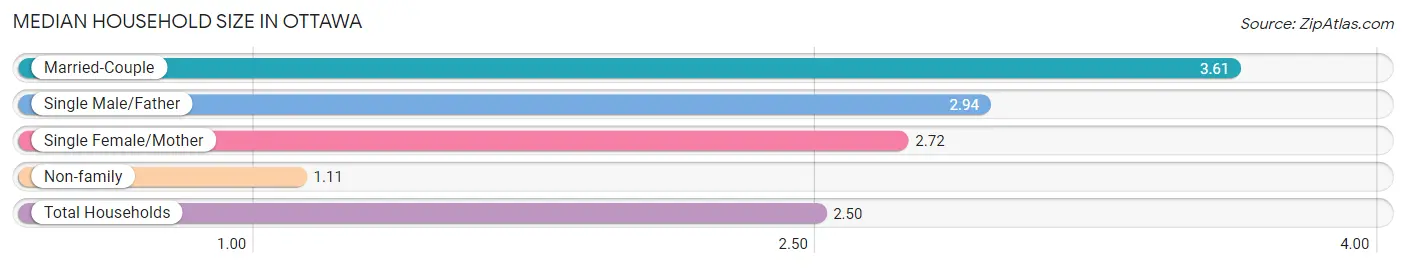
The median household size in Ottawa is 2.50 persons per household, with married-couple households (886 | 50.6%) accounting for the largest median household size of 3.61 persons per household. non-family households (734 | 41.9%) represent the smallest median household size with 1.11 persons per household.
| Household Type | # Households | Household Size |
| Married-Couple | 886 (50.6%) | 3.61 |
| Single Male/Father | 34 (1.9%) | 2.94 |
| Single Female/Mother | 96 (5.5%) | 2.72 |
| Non-family | 734 (41.9%) | 1.11 |
| Total Households | 1,750 (100.0%) | 2.50 |
Household Size by Marriage Status in Ottawa
Out of a total of 1,750 households in Ottawa, 1,016 (58.1%) are family households, while 734 (41.9%) are nonfamily households. The most numerous type of family households are 2-person households, comprising 387, and the most common type of nonfamily households are 1-person households, comprising 665.
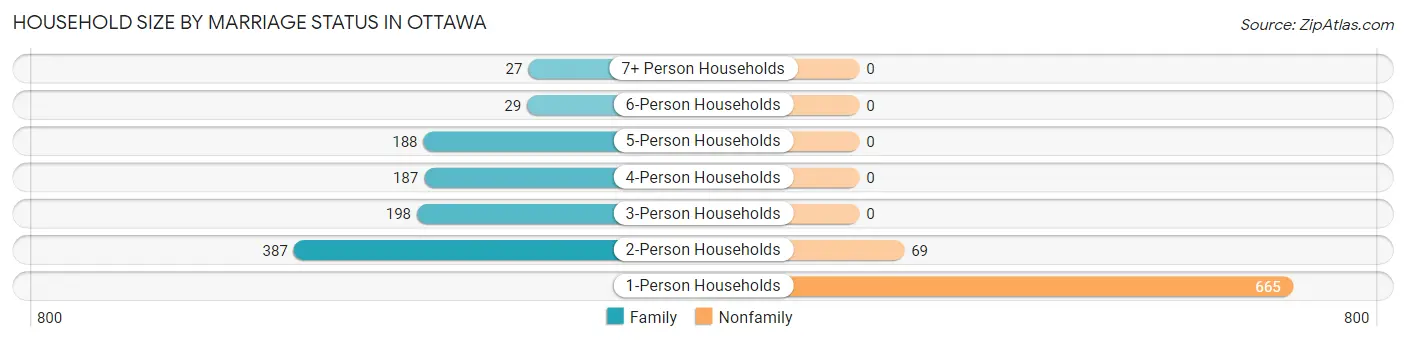
| Household Size | Family Households | Nonfamily Households |
| 1-Person Households | - | 665 (38.0%) |
| 2-Person Households | 387 (22.1%) | 69 (3.9%) |
| 3-Person Households | 198 (11.3%) | 0 (0.0%) |
| 4-Person Households | 187 (10.7%) | 0 (0.0%) |
| 5-Person Households | 188 (10.7%) | 0 (0.0%) |
| 6-Person Households | 29 (1.7%) | 0 (0.0%) |
| 7+ Person Households | 27 (1.5%) | 0 (0.0%) |
| Total | 1,016 (58.1%) | 734 (41.9%) |
Female Fertility in Ottawa
Fertility by Age in Ottawa
Average fertility rate in Ottawa is 12.0 births per 1,000 women. Women in the age bracket of 20 to 34 years have the highest fertility rate with 30.0 births per 1,000 women. Women in the age bracket of 20 to 34 years acount for 100.0% of all women with births.
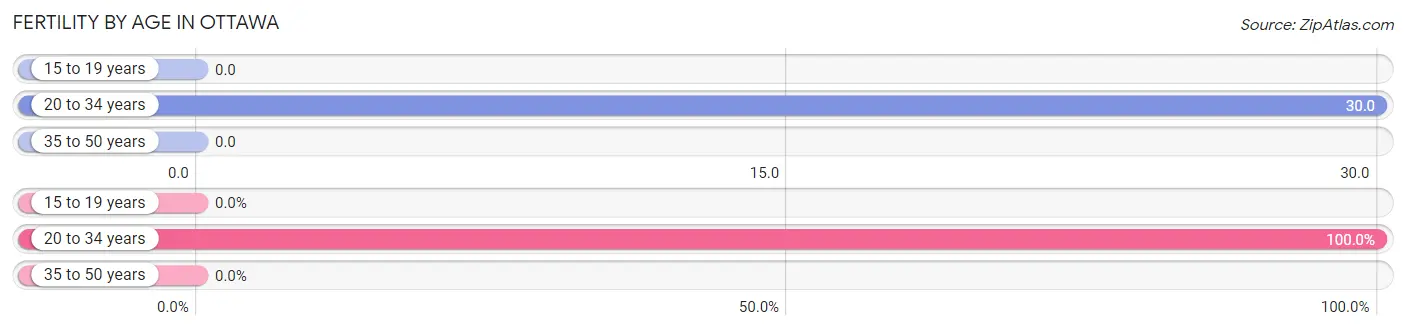
| Age Bracket | Women with Births | Births / 1,000 Women |
| 15 to 19 years | 0 (0.0%) | 0.0 |
| 20 to 34 years | 12 (100.0%) | 30.0 |
| 35 to 50 years | 0 (0.0%) | 0.0 |
| Total | 12 (100.0%) | 12.0 |
Fertility by Age by Marriage Status in Ottawa
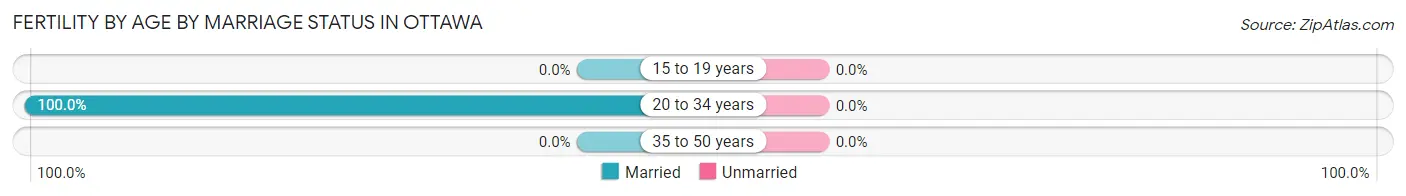
| Age Bracket | Married | Unmarried |
| 15 to 19 years | 0 (0.0%) | 0 (0.0%) |
| 20 to 34 years | 12 (100.0%) | 0 (0.0%) |
| 35 to 50 years | 0 (0.0%) | 0 (0.0%) |
| Total | 12 (100.0%) | 0 (0.0%) |
Fertility by Education in Ottawa
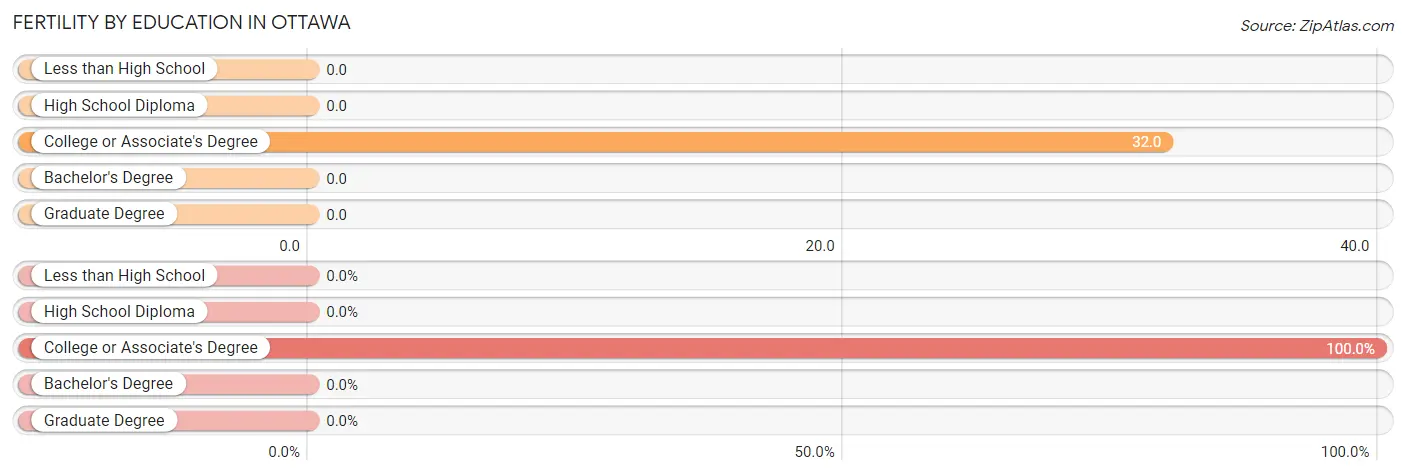
| Educational Attainment | Women with Births | Births / 1,000 Women |
| Less than High School | 0 (0.0%) | 0.0 |
| High School Diploma | 0 (0.0%) | 0.0 |
| College or Associate's Degree | 12 (100.0%) | 32.0 |
| Bachelor's Degree | 0 (0.0%) | 0.0 |
| Graduate Degree | 0 (0.0%) | 0.0 |
| Total | 12 (100.0%) | 12.0 |
Fertility by Education by Marriage Status in Ottawa
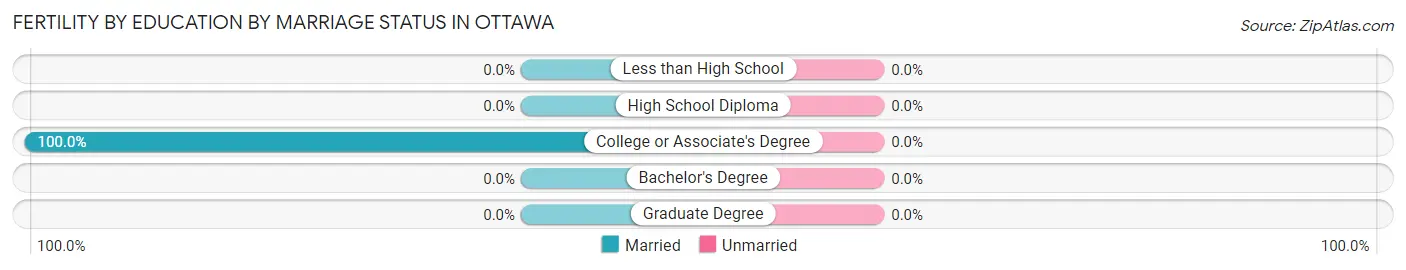
| Educational Attainment | Married | Unmarried |
| Less than High School | 0 (0.0%) | 0 (0.0%) |
| High School Diploma | 0 (0.0%) | 0 (0.0%) |
| College or Associate's Degree | 12 (100.0%) | 0 (0.0%) |
| Bachelor's Degree | 0 (0.0%) | 0 (0.0%) |
| Graduate Degree | 0 (0.0%) | 0 (0.0%) |
| Total | 12 (100.0%) | 0 (0.0%) |
Employment Characteristics in Ottawa
Employment by Class of Employer in Ottawa
Among the 2,016 employed individuals in Ottawa, private company employees (1,188 | 58.9%), self-employed (incorporated) (293 | 14.5%), and local government employees (190 | 9.4%) make up the most common classes of employment.
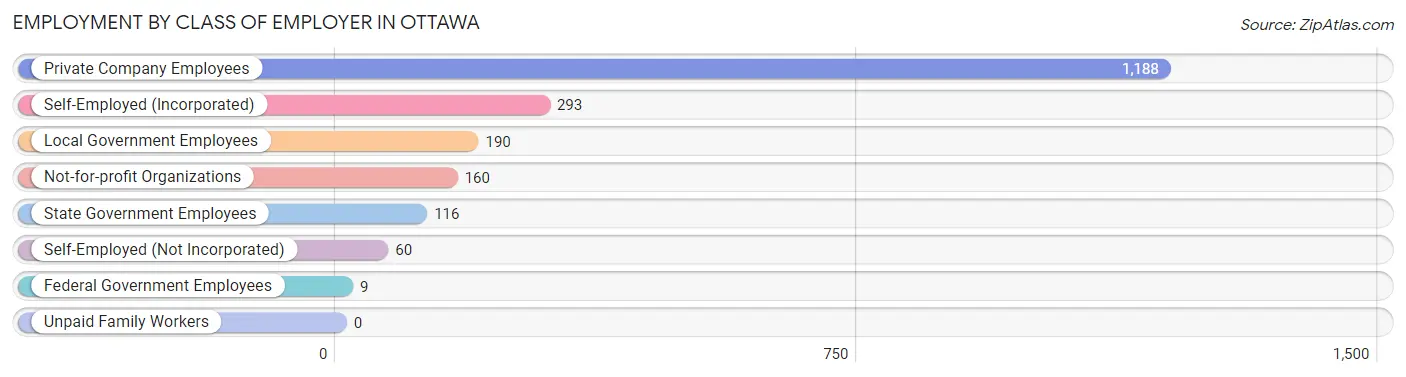
| Employer Class | # Employees | % Employees |
| Private Company Employees | 1,188 | 58.9% |
| Self-Employed (Incorporated) | 293 | 14.5% |
| Self-Employed (Not Incorporated) | 60 | 3.0% |
| Not-for-profit Organizations | 160 | 7.9% |
| Local Government Employees | 190 | 9.4% |
| State Government Employees | 116 | 5.8% |
| Federal Government Employees | 9 | 0.4% |
| Unpaid Family Workers | 0 | 0.0% |
| Total | 2,016 | 100.0% |
Employment Status by Age in Ottawa
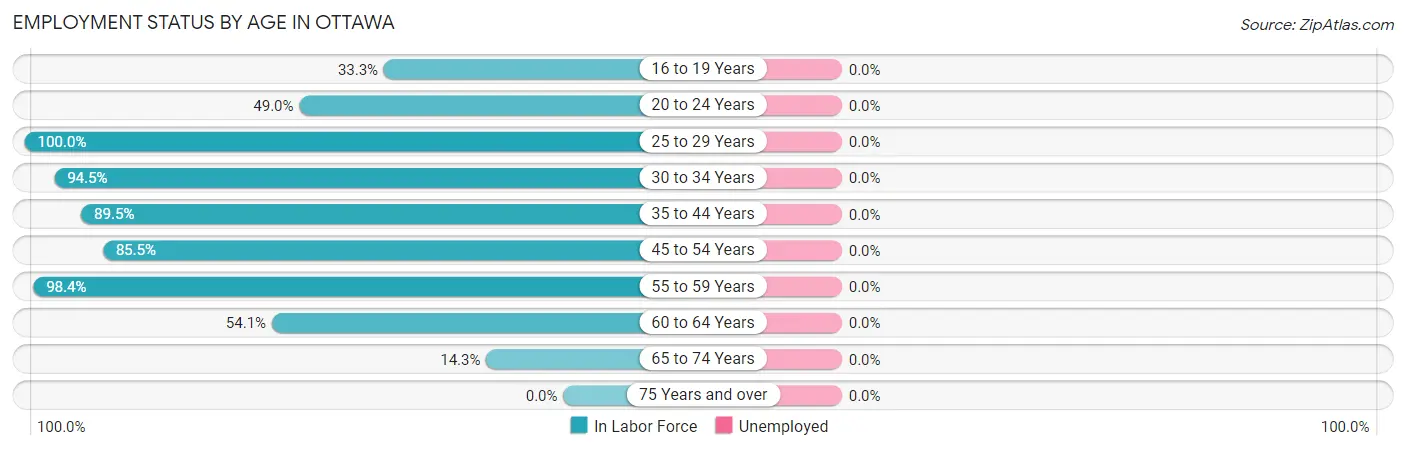
| Age Bracket | In Labor Force | Unemployed |
| 16 to 19 Years | 71 (33.3%) | 0 (0.0%) |
| 20 to 24 Years | 247 (49.0%) | 0 (0.0%) |
| 25 to 29 Years | 109 (100.0%) | 0 (0.0%) |
| 30 to 34 Years | 222 (94.5%) | 0 (0.0%) |
| 35 to 44 Years | 323 (89.5%) | 0 (0.0%) |
| 45 to 54 Years | 672 (85.5%) | 0 (0.0%) |
| 55 to 59 Years | 247 (98.4%) | 0 (0.0%) |
| 60 to 64 Years | 86 (54.1%) | 0 (0.0%) |
| 65 to 74 Years | 68 (14.3%) | 0 (0.0%) |
| 75 Years and over | 0 (0.0%) | 0 (0.0%) |
| Total | 2,044 (58.0%) | 0 (0.0%) |
Employment Status by Educational Attainment in Ottawa
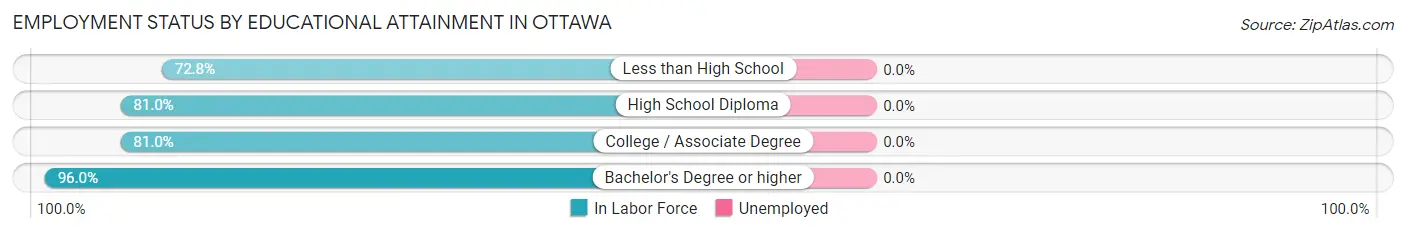
| Educational Attainment | In Labor Force | Unemployed |
| Less than High School | 67 (72.8%) | 0 (0.0%) |
| High School Diploma | 333 (81.0%) | 0 (0.0%) |
| College / Associate Degree | 449 (81.0%) | 0 (0.0%) |
| Bachelor's Degree or higher | 810 (96.0%) | 0 (0.0%) |
| Total | 1,660 (87.3%) | 0 (0.0%) |
Employment Occupations by Sex in Ottawa
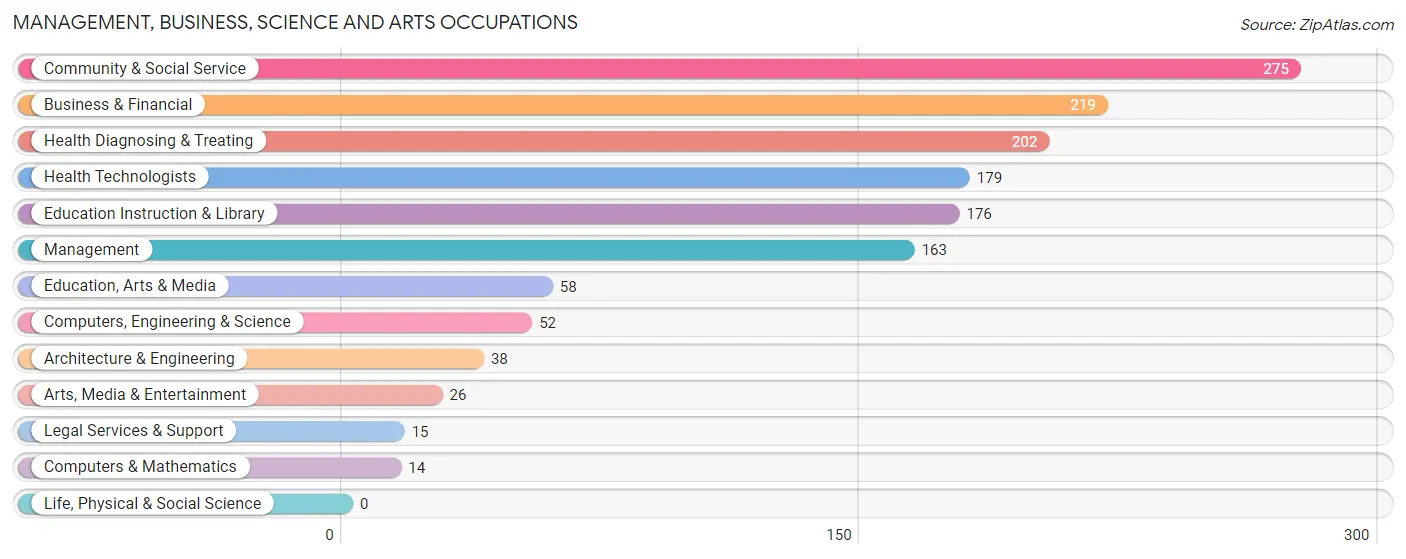
Management, Business, Science and Arts Occupations
The most common Management, Business, Science and Arts occupations in Ottawa are Community & Social Service (275 | 13.5%), Business & Financial (219 | 10.7%), Health Diagnosing & Treating (202 | 9.9%), Health Technologists (179 | 8.7%), and Education Instruction & Library (176 | 8.6%).
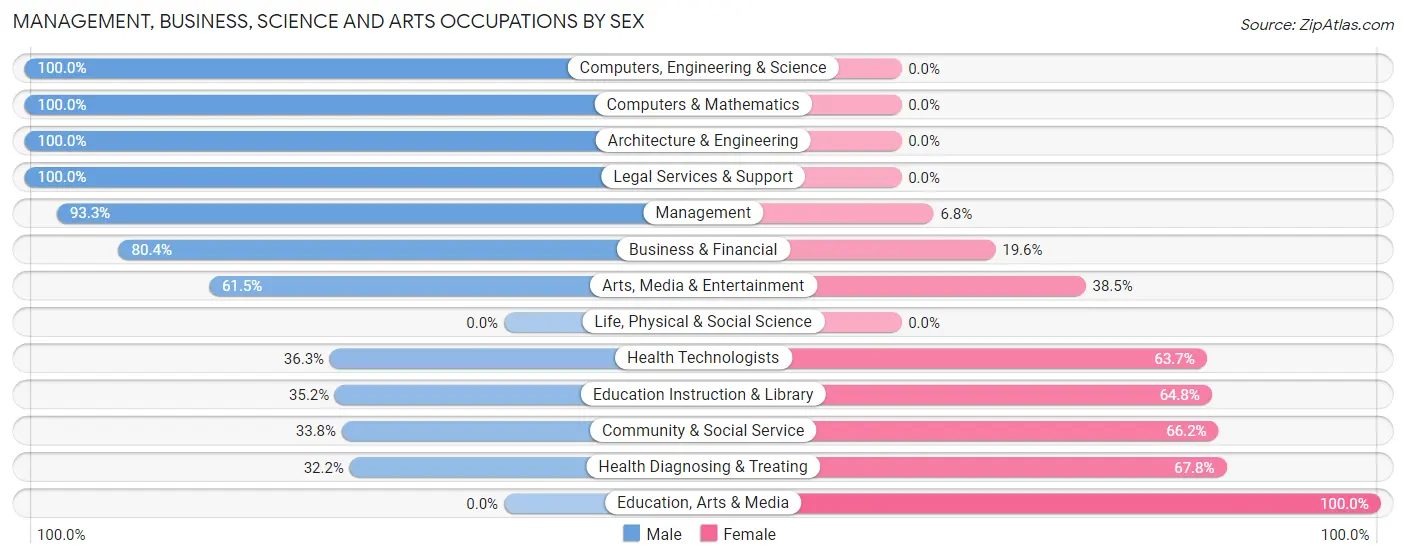
Management, Business, Science and Arts Occupations by Sex
Within the Management, Business, Science and Arts occupations in Ottawa, the most male-oriented occupations are Computers, Engineering & Science (100.0%), Computers & Mathematics (100.0%), and Architecture & Engineering (100.0%), while the most female-oriented occupations are Education, Arts & Media (100.0%), Health Diagnosing & Treating (67.8%), and Community & Social Service (66.2%).
| Occupation | Male | Female |
| Management | 152 (93.2%) | 11 (6.8%) |
| Business & Financial | 176 (80.4%) | 43 (19.6%) |
| Computers, Engineering & Science | 52 (100.0%) | 0 (0.0%) |
| Computers & Mathematics | 14 (100.0%) | 0 (0.0%) |
| Architecture & Engineering | 38 (100.0%) | 0 (0.0%) |
| Life, Physical & Social Science | 0 (0.0%) | 0 (0.0%) |
| Community & Social Service | 93 (33.8%) | 182 (66.2%) |
| Education, Arts & Media | 0 (0.0%) | 58 (100.0%) |
| Legal Services & Support | 15 (100.0%) | 0 (0.0%) |
| Education Instruction & Library | 62 (35.2%) | 114 (64.8%) |
| Arts, Media & Entertainment | 16 (61.5%) | 10 (38.5%) |
| Health Diagnosing & Treating | 65 (32.2%) | 137 (67.8%) |
| Health Technologists | 65 (36.3%) | 114 (63.7%) |
| Total (Category) | 538 (59.1%) | 373 (40.9%) |
| Total (Overall) | 1,135 (55.5%) | 910 (44.5%) |
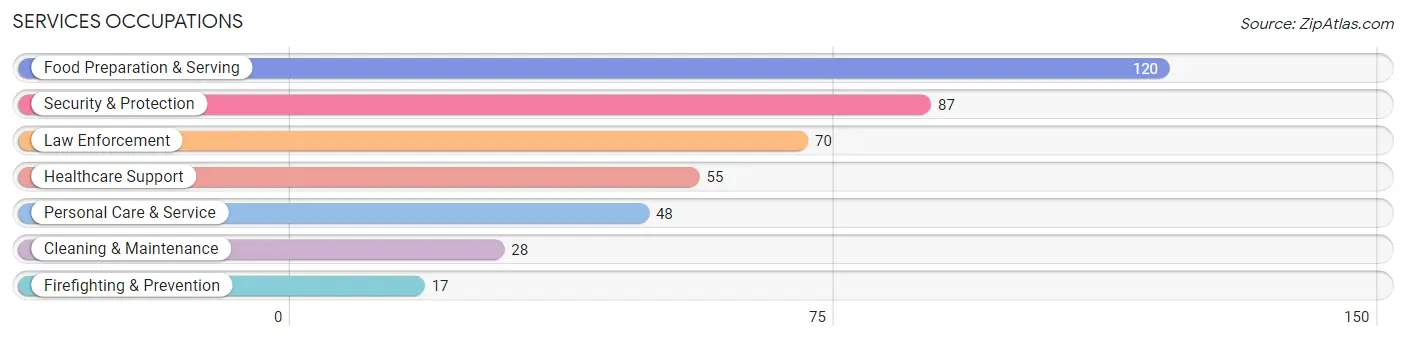
Services Occupations
The most common Services occupations in Ottawa are Food Preparation & Serving (120 | 5.9%), Security & Protection (87 | 4.3%), Law Enforcement (70 | 3.4%), Healthcare Support (55 | 2.7%), and Personal Care & Service (48 | 2.4%).
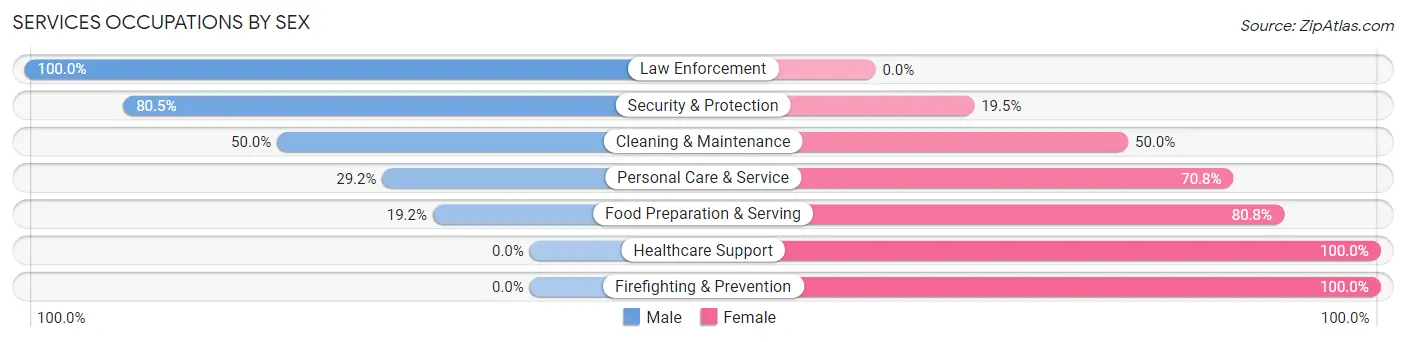
Services Occupations by Sex
Within the Services occupations in Ottawa, the most male-oriented occupations are Law Enforcement (100.0%), Security & Protection (80.5%), and Cleaning & Maintenance (50.0%), while the most female-oriented occupations are Healthcare Support (100.0%), Firefighting & Prevention (100.0%), and Food Preparation & Serving (80.8%).
| Occupation | Male | Female |
| Healthcare Support | 0 (0.0%) | 55 (100.0%) |
| Security & Protection | 70 (80.5%) | 17 (19.5%) |
| Firefighting & Prevention | 0 (0.0%) | 17 (100.0%) |
| Law Enforcement | 70 (100.0%) | 0 (0.0%) |
| Food Preparation & Serving | 23 (19.2%) | 97 (80.8%) |
| Cleaning & Maintenance | 14 (50.0%) | 14 (50.0%) |
| Personal Care & Service | 14 (29.2%) | 34 (70.8%) |
| Total (Category) | 121 (35.8%) | 217 (64.2%) |
| Total (Overall) | 1,135 (55.5%) | 910 (44.5%) |
Sales and Office Occupations
The most common Sales and Office occupations in Ottawa are Office & Administration (195 | 9.5%), and Sales & Related (124 | 6.1%).
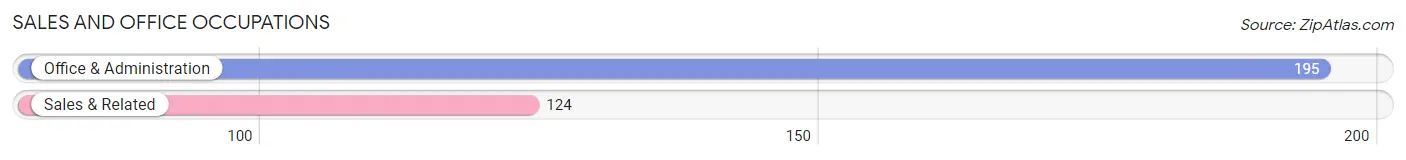
Sales and Office Occupations by Sex
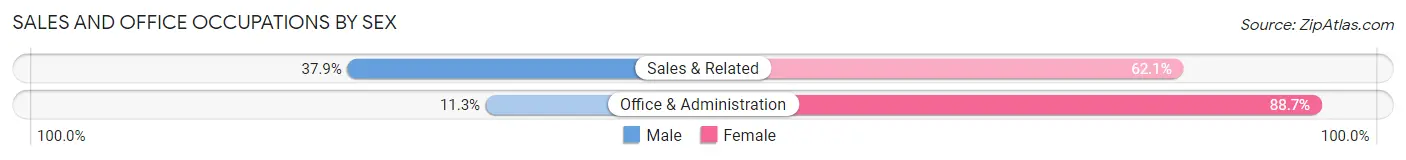
| Occupation | Male | Female |
| Sales & Related | 47 (37.9%) | 77 (62.1%) |
| Office & Administration | 22 (11.3%) | 173 (88.7%) |
| Total (Category) | 69 (21.6%) | 250 (78.4%) |
| Total (Overall) | 1,135 (55.5%) | 910 (44.5%) |
Natural Resources, Construction and Maintenance Occupations
The most common Natural Resources, Construction and Maintenance occupations in Ottawa are Installation, Maintenance & Repair (95 | 4.6%), and Construction & Extraction (40 | 2.0%).
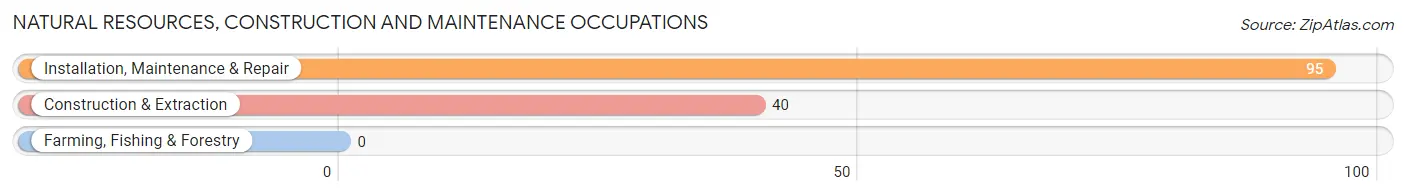
Natural Resources, Construction and Maintenance Occupations by Sex
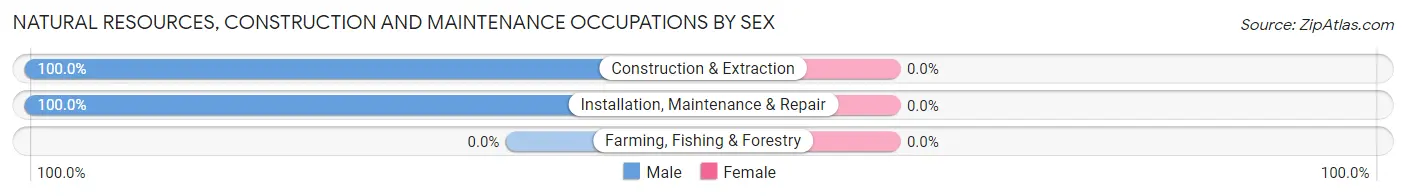
| Occupation | Male | Female |
| Farming, Fishing & Forestry | 0 (0.0%) | 0 (0.0%) |
| Construction & Extraction | 40 (100.0%) | 0 (0.0%) |
| Installation, Maintenance & Repair | 95 (100.0%) | 0 (0.0%) |
| Total (Category) | 135 (100.0%) | 0 (0.0%) |
| Total (Overall) | 1,135 (55.5%) | 910 (44.5%) |
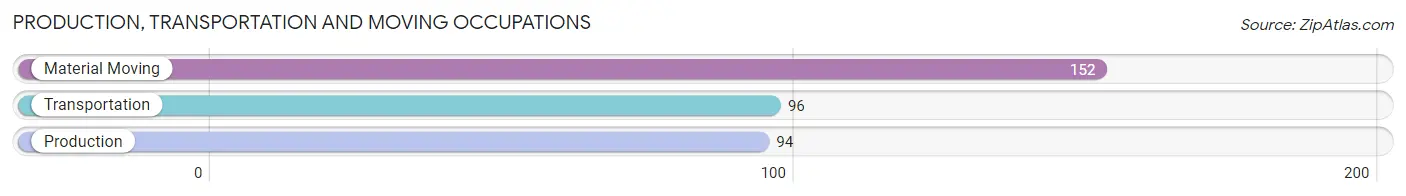
Production, Transportation and Moving Occupations
The most common Production, Transportation and Moving occupations in Ottawa are Material Moving (152 | 7.4%), Transportation (96 | 4.7%), and Production (94 | 4.6%).
Production, Transportation and Moving Occupations by Sex
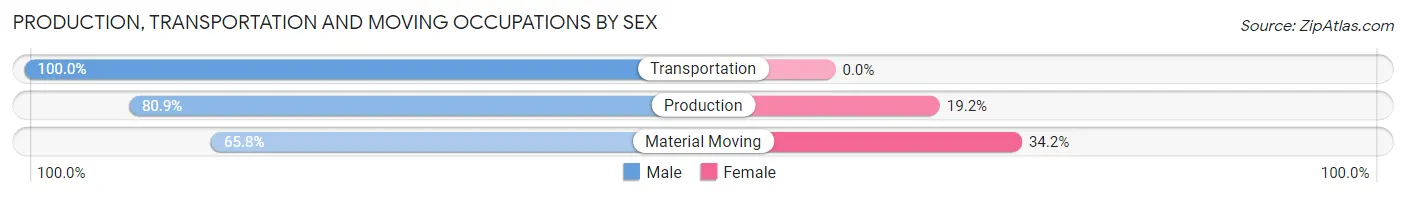
| Occupation | Male | Female |
| Production | 76 (80.8%) | 18 (19.2%) |
| Transportation | 96 (100.0%) | 0 (0.0%) |
| Material Moving | 100 (65.8%) | 52 (34.2%) |
| Total (Category) | 272 (79.5%) | 70 (20.5%) |
| Total (Overall) | 1,135 (55.5%) | 910 (44.5%) |
Employment Industries by Sex in Ottawa
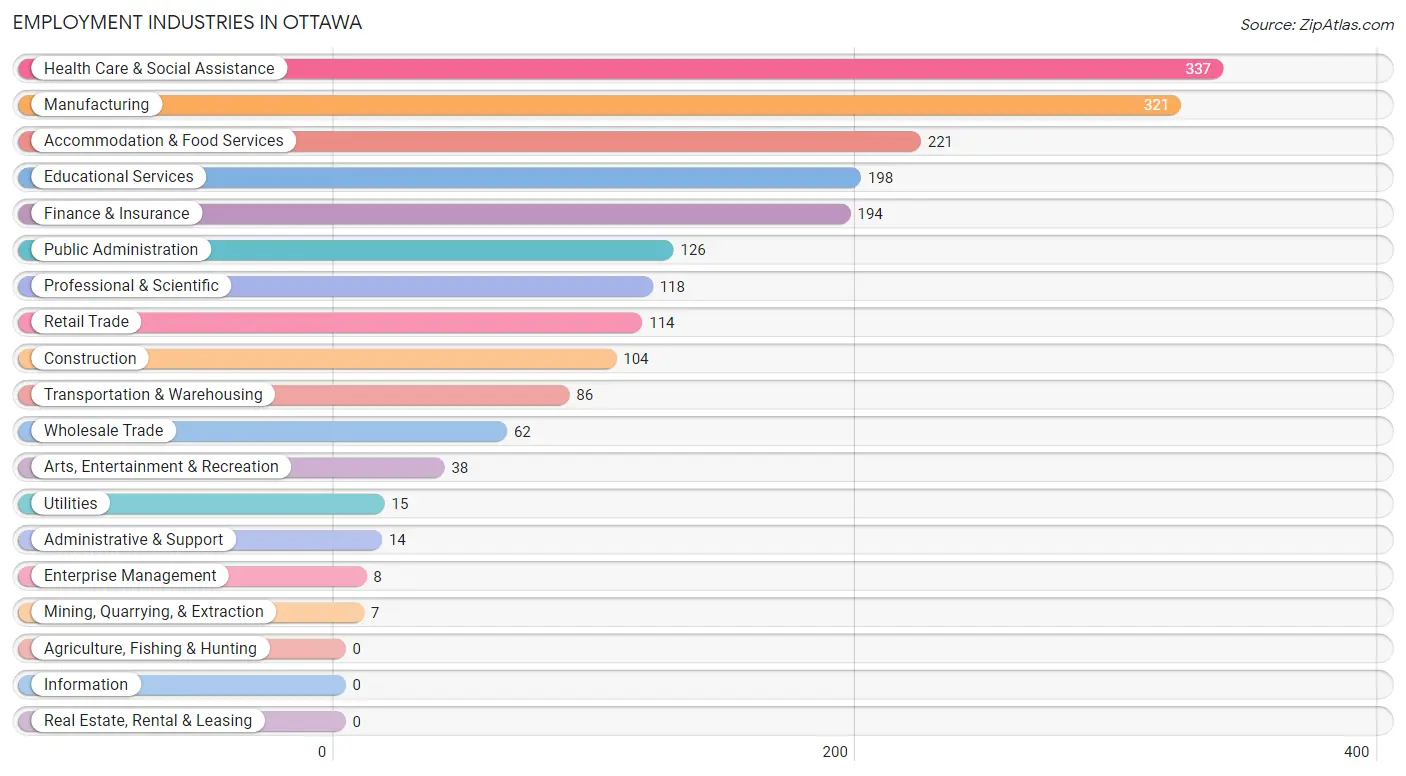
Employment Industries in Ottawa
The major employment industries in Ottawa include Health Care & Social Assistance (337 | 16.5%), Manufacturing (321 | 15.7%), Accommodation & Food Services (221 | 10.8%), Educational Services (198 | 9.7%), and Finance & Insurance (194 | 9.5%).
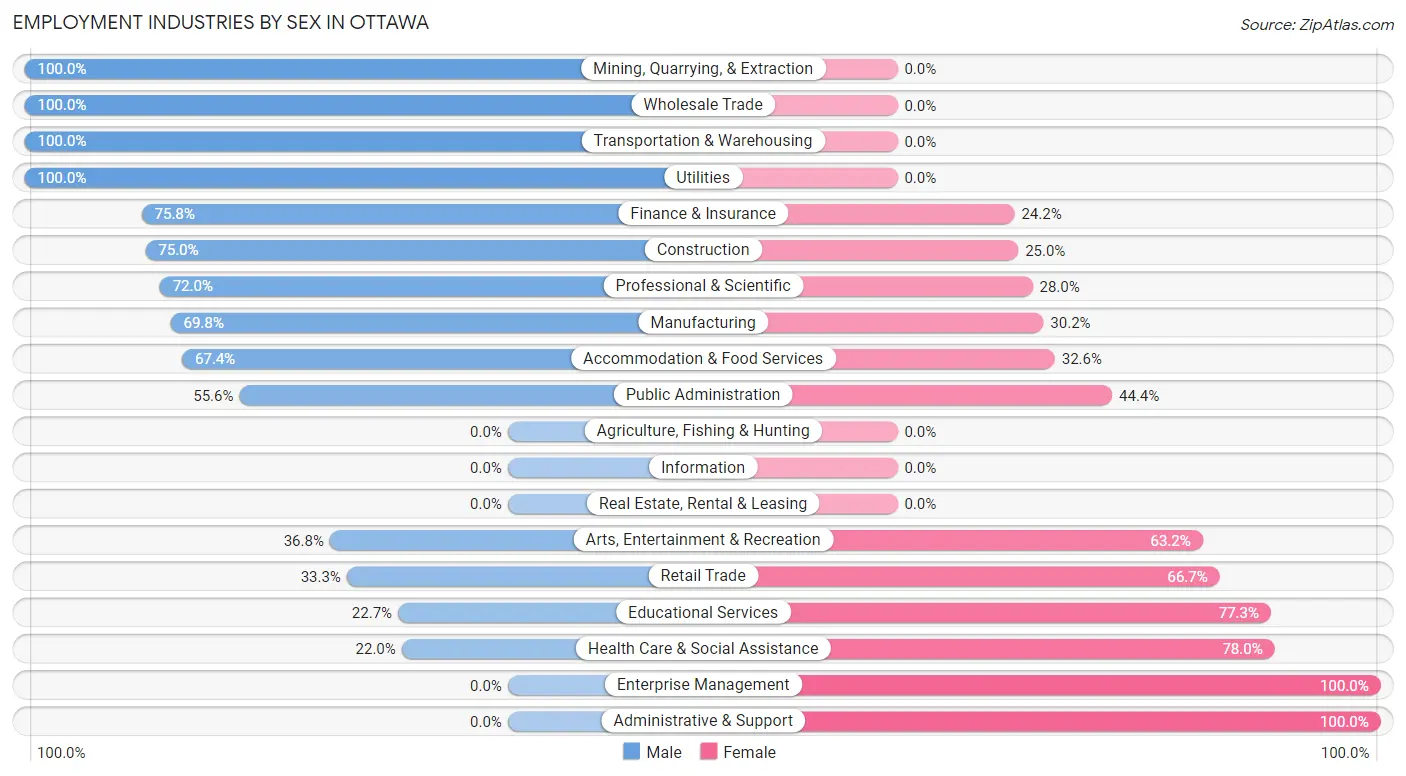
Employment Industries by Sex in Ottawa
The Ottawa industries that see more men than women are Mining, Quarrying, & Extraction (100.0%), Wholesale Trade (100.0%), and Transportation & Warehousing (100.0%), whereas the industries that tend to have a higher number of women are Enterprise Management (100.0%), Administrative & Support (100.0%), and Health Care & Social Assistance (78.0%).
| Industry | Male | Female |
| Agriculture, Fishing & Hunting | 0 (0.0%) | 0 (0.0%) |
| Mining, Quarrying, & Extraction | 7 (100.0%) | 0 (0.0%) |
| Construction | 78 (75.0%) | 26 (25.0%) |
| Manufacturing | 224 (69.8%) | 97 (30.2%) |
| Wholesale Trade | 62 (100.0%) | 0 (0.0%) |
| Retail Trade | 38 (33.3%) | 76 (66.7%) |
| Transportation & Warehousing | 86 (100.0%) | 0 (0.0%) |
| Utilities | 15 (100.0%) | 0 (0.0%) |
| Information | 0 (0.0%) | 0 (0.0%) |
| Finance & Insurance | 147 (75.8%) | 47 (24.2%) |
| Real Estate, Rental & Leasing | 0 (0.0%) | 0 (0.0%) |
| Professional & Scientific | 85 (72.0%) | 33 (28.0%) |
| Enterprise Management | 0 (0.0%) | 8 (100.0%) |
| Administrative & Support | 0 (0.0%) | 14 (100.0%) |
| Educational Services | 45 (22.7%) | 153 (77.3%) |
| Health Care & Social Assistance | 74 (22.0%) | 263 (78.0%) |
| Arts, Entertainment & Recreation | 14 (36.8%) | 24 (63.2%) |
| Accommodation & Food Services | 149 (67.4%) | 72 (32.6%) |
| Public Administration | 70 (55.6%) | 56 (44.4%) |
| Total | 1,135 (55.5%) | 910 (44.5%) |
Education in Ottawa
School Enrollment in Ottawa
The most common levels of schooling among the 1,339 students in Ottawa are elementary school (334 | 24.9%), high school (328 | 24.5%), and college / undergraduate (251 | 18.8%).
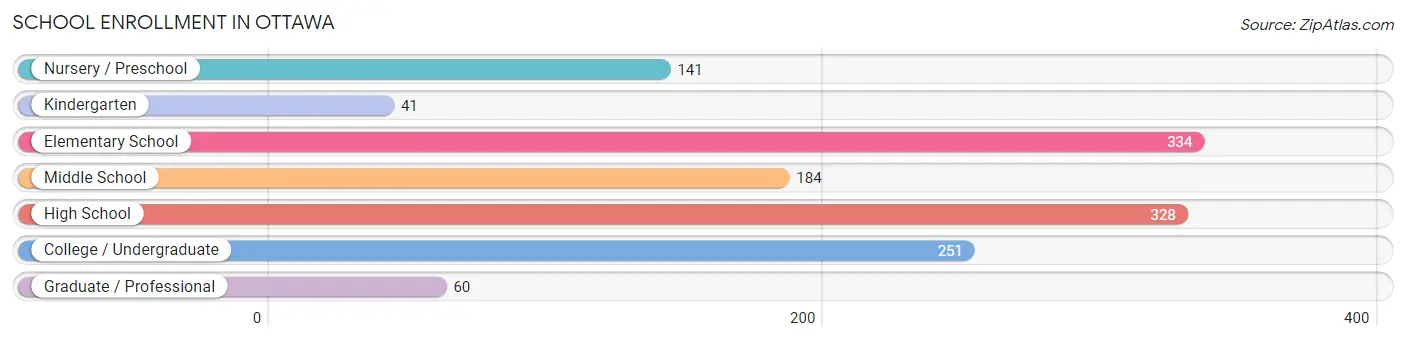
| School Level | # Students | % Students |
| Nursery / Preschool | 141 | 10.5% |
| Kindergarten | 41 | 3.1% |
| Elementary School | 334 | 24.9% |
| Middle School | 184 | 13.7% |
| High School | 328 | 24.5% |
| College / Undergraduate | 251 | 18.8% |
| Graduate / Professional | 60 | 4.5% |
| Total | 1,339 | 100.0% |
School Enrollment by Age by Funding Source in Ottawa
Out of a total of 1,339 students who are enrolled in schools in Ottawa, 370 (27.6%) attend a private institution, while the remaining 969 (72.4%) are enrolled in public schools. The age group of 25 to 34 year olds has the highest likelihood of being enrolled in private schools, with 9 (100.0% in the age bracket) enrolled. Conversely, the age group of 15 to 17 year olds has the lowest likelihood of being enrolled in a private school, with 261 (100.0% in the age bracket) attending a public institution.
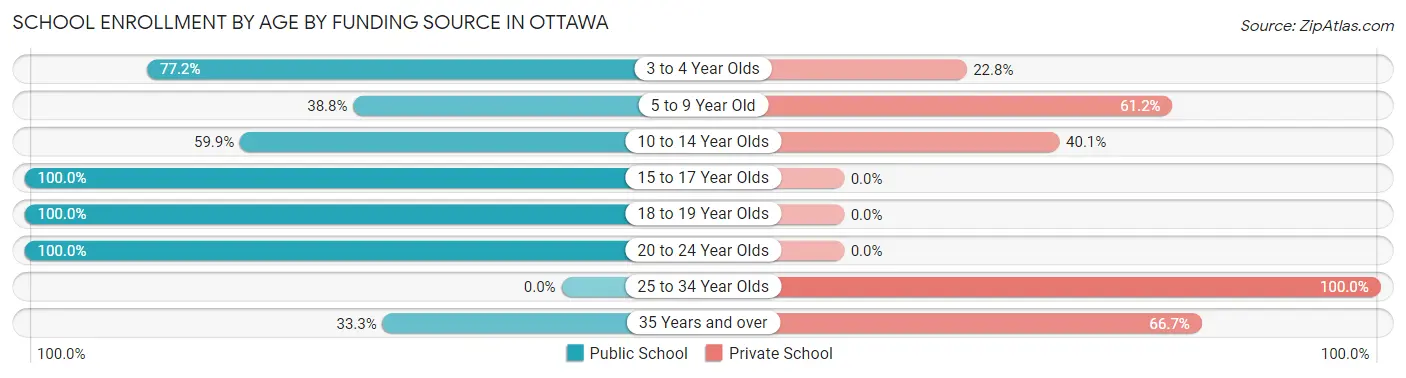
| Age Bracket | Public School | Private School |
| 3 to 4 Year Olds | 71 (77.2%) | 21 (22.8%) |
| 5 to 9 Year Old | 114 (38.8%) | 180 (61.2%) |
| 10 to 14 Year Olds | 188 (59.9%) | 126 (40.1%) |
| 15 to 17 Year Olds | 261 (100.0%) | 0 (0.0%) |
| 18 to 19 Year Olds | 76 (100.0%) | 0 (0.0%) |
| 20 to 24 Year Olds | 242 (100.0%) | 0 (0.0%) |
| 25 to 34 Year Olds | 0 (0.0%) | 9 (100.0%) |
| 35 Years and over | 17 (33.3%) | 34 (66.7%) |
| Total | 969 (72.4%) | 370 (27.6%) |
Educational Attainment by Field of Study in Ottawa
Education (332 | 31.1%), business (264 | 24.8%), science & technology (178 | 16.7%), arts & humanities (78 | 7.3%), and bio, nature & agricultural (75 | 7.0%) are the most common fields of study among 1,066 individuals in Ottawa who have obtained a bachelor's degree or higher.
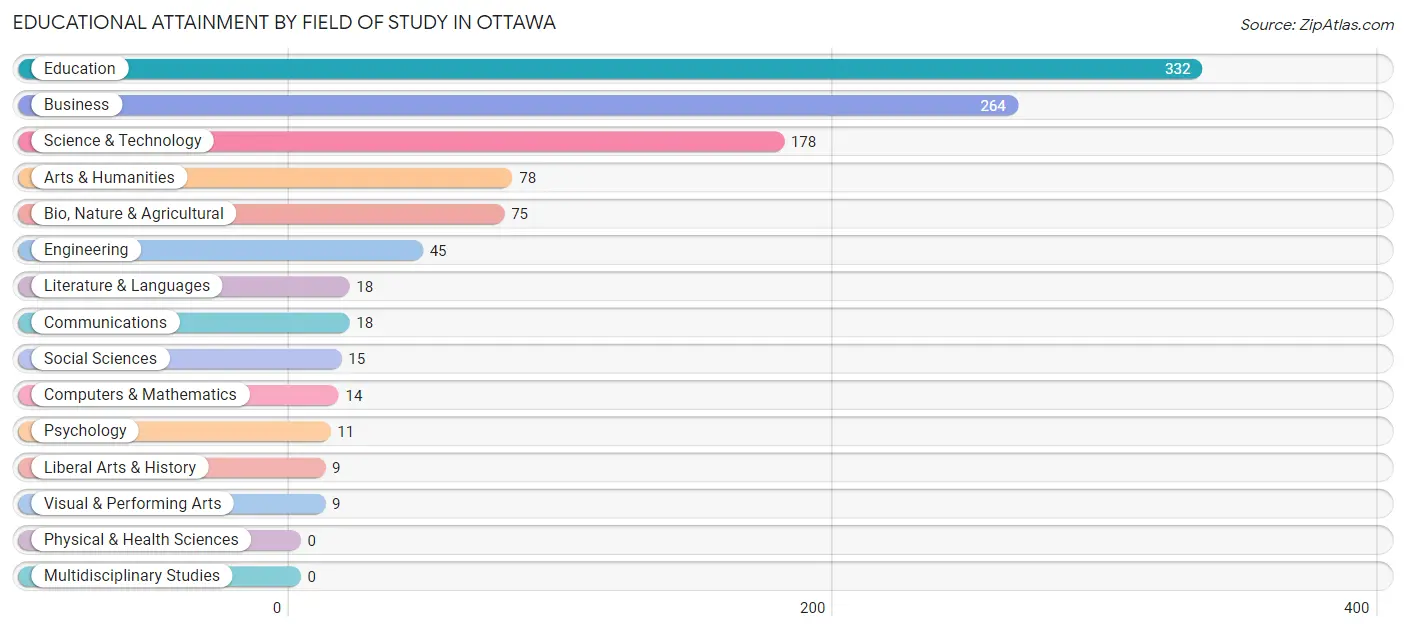
| Field of Study | # Graduates | % Graduates |
| Computers & Mathematics | 14 | 1.3% |
| Bio, Nature & Agricultural | 75 | 7.0% |
| Physical & Health Sciences | 0 | 0.0% |
| Psychology | 11 | 1.0% |
| Social Sciences | 15 | 1.4% |
| Engineering | 45 | 4.2% |
| Multidisciplinary Studies | 0 | 0.0% |
| Science & Technology | 178 | 16.7% |
| Business | 264 | 24.8% |
| Education | 332 | 31.1% |
| Literature & Languages | 18 | 1.7% |
| Liberal Arts & History | 9 | 0.8% |
| Visual & Performing Arts | 9 | 0.8% |
| Communications | 18 | 1.7% |
| Arts & Humanities | 78 | 7.3% |
| Total | 1,066 | 100.0% |
Transportation & Commute in Ottawa
Vehicle Availability by Sex in Ottawa
The most prevalent vehicle ownership categories in Ottawa are males with 2 vehicles (515, accounting for 46.6%) and females with 2 vehicles (357, making up 56.6%).
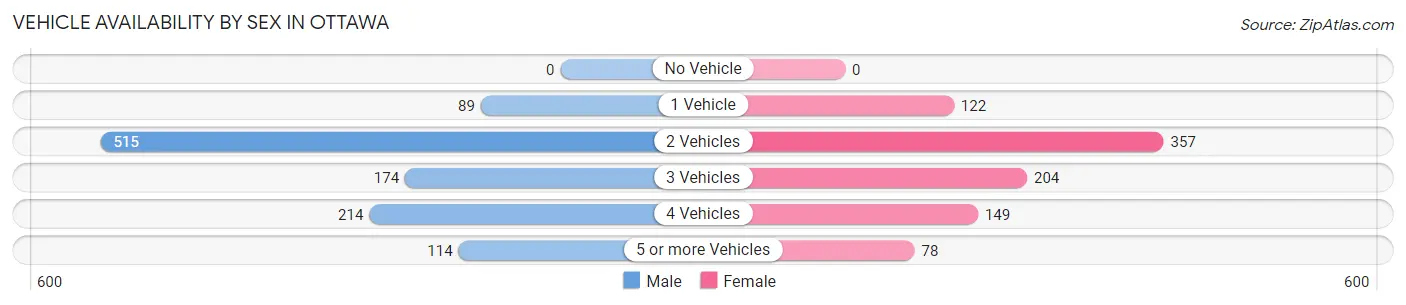
| Vehicles Available | Male | Female |
| No Vehicle | 0 (0.0%) | 0 (0.0%) |
| 1 Vehicle | 89 (8.1%) | 122 (13.4%) |
| 2 Vehicles | 515 (46.6%) | 357 (39.2%) |
| 3 Vehicles | 174 (15.7%) | 204 (22.4%) |
| 4 Vehicles | 214 (19.4%) | 149 (16.4%) |
| 5 or more Vehicles | 114 (10.3%) | 78 (8.6%) |
| Total | 1,106 (100.0%) | 910 (100.0%) |
Commute Time in Ottawa
The most frequently occuring commute durations in Ottawa are 5 to 9 minutes (582 commuters, 31.5%), 30 to 34 minutes (322 commuters, 17.4%), and 10 to 14 minutes (195 commuters, 10.5%).
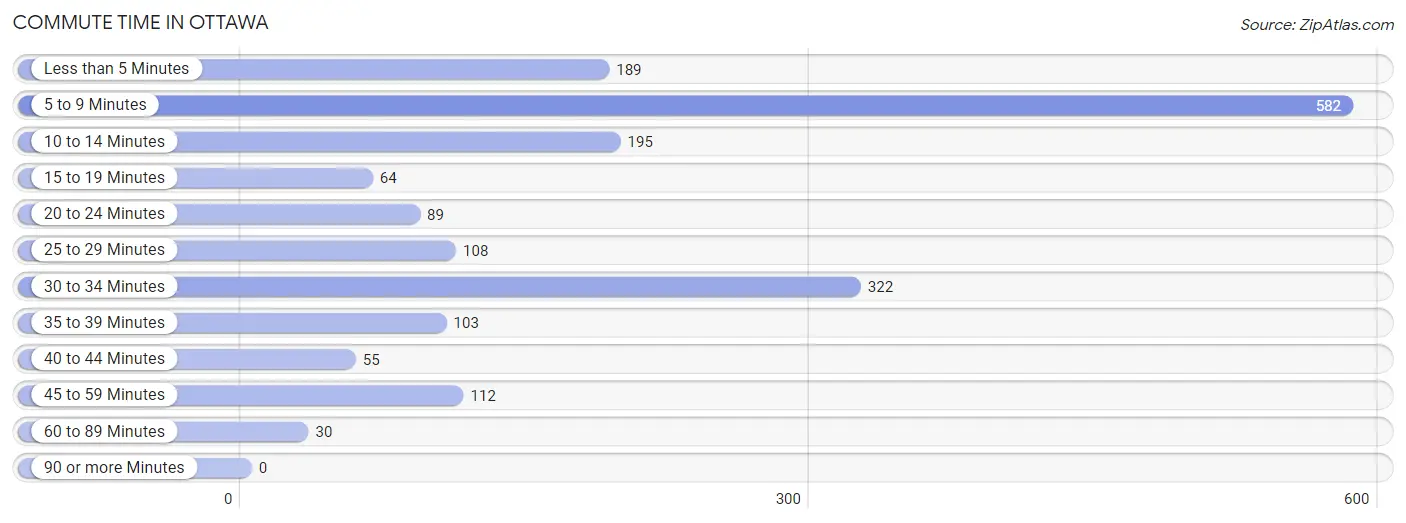
| Commute Time | # Commuters | % Commuters |
| Less than 5 Minutes | 189 | 10.2% |
| 5 to 9 Minutes | 582 | 31.5% |
| 10 to 14 Minutes | 195 | 10.5% |
| 15 to 19 Minutes | 64 | 3.5% |
| 20 to 24 Minutes | 89 | 4.8% |
| 25 to 29 Minutes | 108 | 5.8% |
| 30 to 34 Minutes | 322 | 17.4% |
| 35 to 39 Minutes | 103 | 5.6% |
| 40 to 44 Minutes | 55 | 3.0% |
| 45 to 59 Minutes | 112 | 6.1% |
| 60 to 89 Minutes | 30 | 1.6% |
| 90 or more Minutes | 0 | 0.0% |
Commute Time by Sex in Ottawa
The most common commute times in Ottawa are 30 to 34 minutes (286 commuters, 27.3%) for males and 5 to 9 minutes (340 commuters, 42.4%) for females.
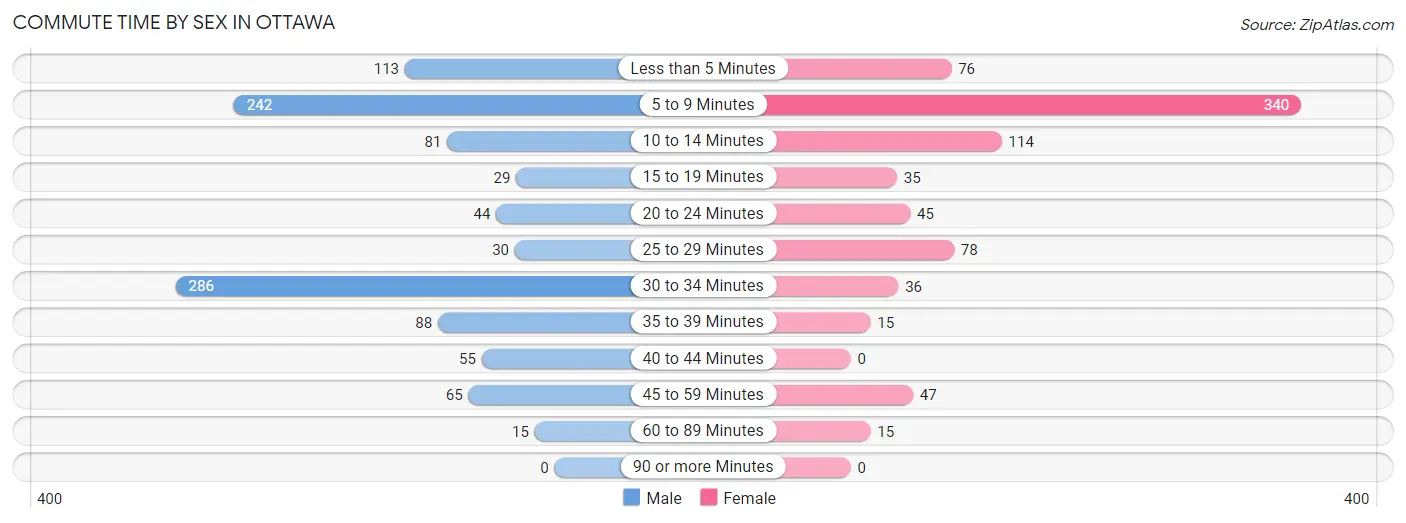
| Commute Time | Male | Female |
| Less than 5 Minutes | 113 (10.8%) | 76 (9.5%) |
| 5 to 9 Minutes | 242 (23.1%) | 340 (42.4%) |
| 10 to 14 Minutes | 81 (7.7%) | 114 (14.2%) |
| 15 to 19 Minutes | 29 (2.8%) | 35 (4.4%) |
| 20 to 24 Minutes | 44 (4.2%) | 45 (5.6%) |
| 25 to 29 Minutes | 30 (2.9%) | 78 (9.7%) |
| 30 to 34 Minutes | 286 (27.3%) | 36 (4.5%) |
| 35 to 39 Minutes | 88 (8.4%) | 15 (1.9%) |
| 40 to 44 Minutes | 55 (5.2%) | 0 (0.0%) |
| 45 to 59 Minutes | 65 (6.2%) | 47 (5.9%) |
| 60 to 89 Minutes | 15 (1.4%) | 15 (1.9%) |
| 90 or more Minutes | 0 (0.0%) | 0 (0.0%) |
Time of Departure to Work by Sex in Ottawa
The most frequent times of departure to work in Ottawa are 7:30 AM to 7:59 AM (161, 15.4%) for males and 7:30 AM to 7:59 AM (196, 24.5%) for females.
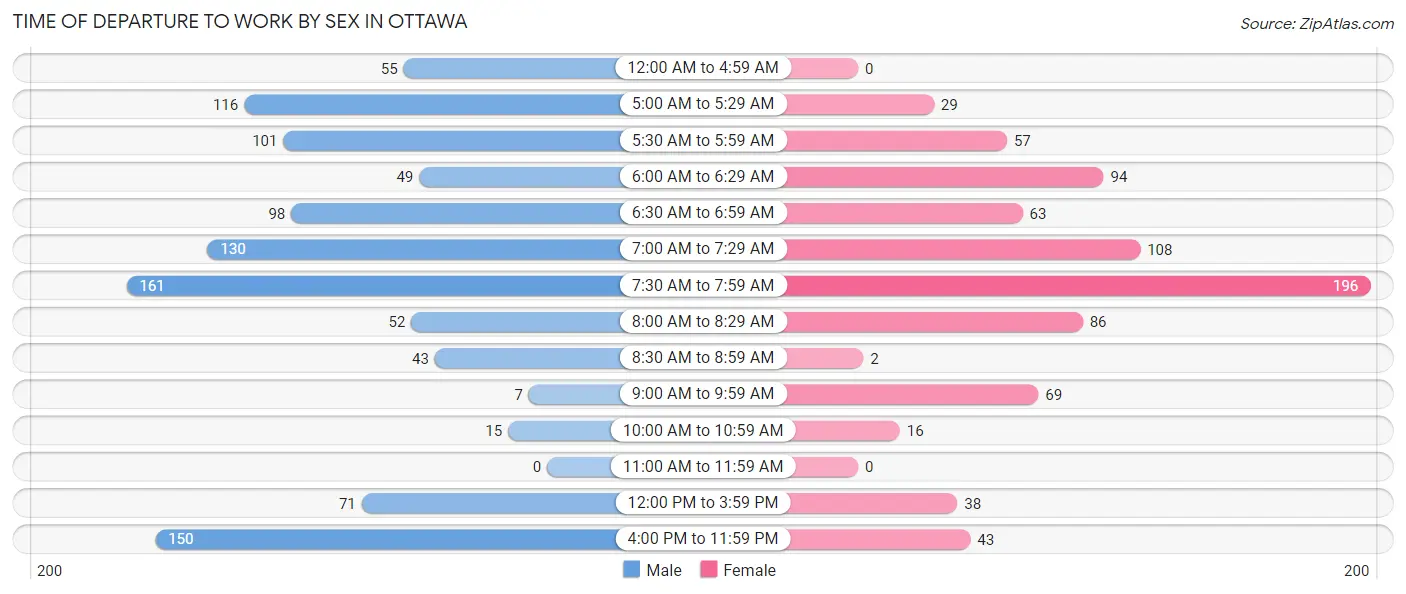
| Time of Departure | Male | Female |
| 12:00 AM to 4:59 AM | 55 (5.2%) | 0 (0.0%) |
| 5:00 AM to 5:29 AM | 116 (11.1%) | 29 (3.6%) |
| 5:30 AM to 5:59 AM | 101 (9.6%) | 57 (7.1%) |
| 6:00 AM to 6:29 AM | 49 (4.7%) | 94 (11.7%) |
| 6:30 AM to 6:59 AM | 98 (9.3%) | 63 (7.9%) |
| 7:00 AM to 7:29 AM | 130 (12.4%) | 108 (13.5%) |
| 7:30 AM to 7:59 AM | 161 (15.4%) | 196 (24.5%) |
| 8:00 AM to 8:29 AM | 52 (5.0%) | 86 (10.7%) |
| 8:30 AM to 8:59 AM | 43 (4.1%) | 2 (0.3%) |
| 9:00 AM to 9:59 AM | 7 (0.7%) | 69 (8.6%) |
| 10:00 AM to 10:59 AM | 15 (1.4%) | 16 (2.0%) |
| 11:00 AM to 11:59 AM | 0 (0.0%) | 0 (0.0%) |
| 12:00 PM to 3:59 PM | 71 (6.8%) | 38 (4.7%) |
| 4:00 PM to 11:59 PM | 150 (14.3%) | 43 (5.4%) |
| Total | 1,048 (100.0%) | 801 (100.0%) |
Housing Occupancy in Ottawa
Occupancy by Ownership in Ottawa
Of the total 1,750 dwellings in Ottawa, owner-occupied units account for 1,281 (73.2%), while renter-occupied units make up 469 (26.8%).
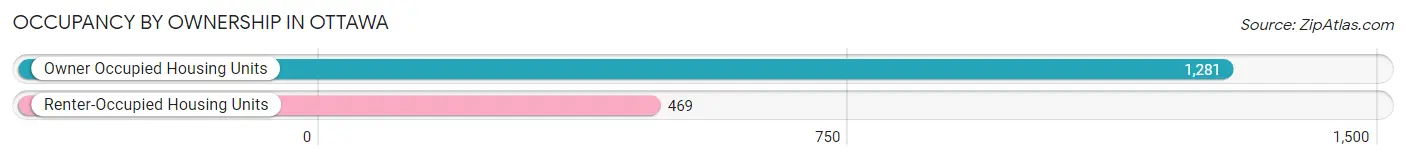
| Occupancy | # Housing Units | % Housing Units |
| Owner Occupied Housing Units | 1,281 | 73.2% |
| Renter-Occupied Housing Units | 469 | 26.8% |
| Total Occupied Housing Units | 1,750 | 100.0% |
Occupancy by Household Size in Ottawa
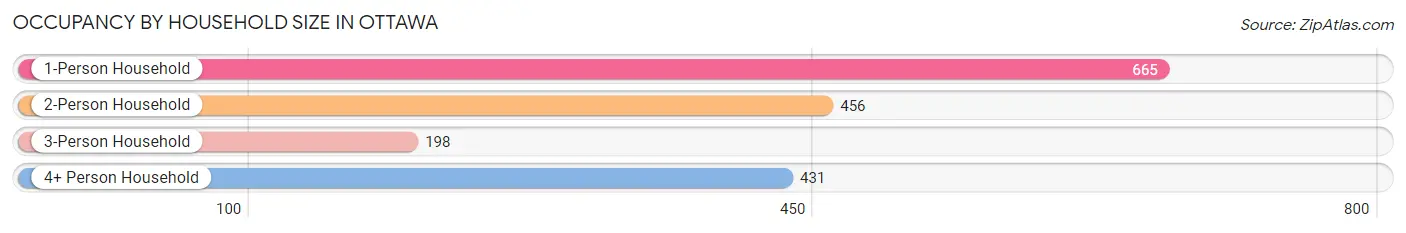
| Household Size | # Housing Units | % Housing Units |
| 1-Person Household | 665 | 38.0% |
| 2-Person Household | 456 | 26.1% |
| 3-Person Household | 198 | 11.3% |
| 4+ Person Household | 431 | 24.6% |
| Total Housing Units | 1,750 | 100.0% |
Occupancy by Ownership by Household Size in Ottawa
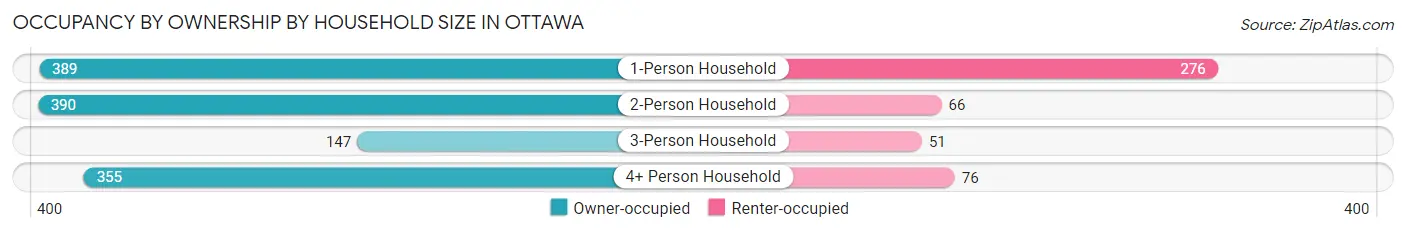
| Household Size | Owner-occupied | Renter-occupied |
| 1-Person Household | 389 (58.5%) | 276 (41.5%) |
| 2-Person Household | 390 (85.5%) | 66 (14.5%) |
| 3-Person Household | 147 (74.2%) | 51 (25.8%) |
| 4+ Person Household | 355 (82.4%) | 76 (17.6%) |
| Total Housing Units | 1,281 (73.2%) | 469 (26.8%) |
Occupancy by Educational Attainment in Ottawa
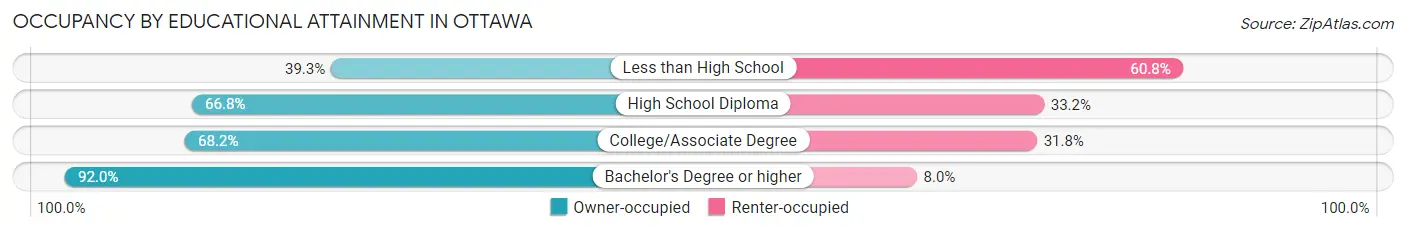
| Household Size | Owner-occupied | Renter-occupied |
| Less than High School | 42 (39.3%) | 65 (60.8%) |
| High School Diploma | 414 (66.8%) | 206 (33.2%) |
| College/Associate Degree | 332 (68.2%) | 155 (31.8%) |
| Bachelor's Degree or higher | 493 (92.0%) | 43 (8.0%) |
Occupancy by Age of Householder in Ottawa
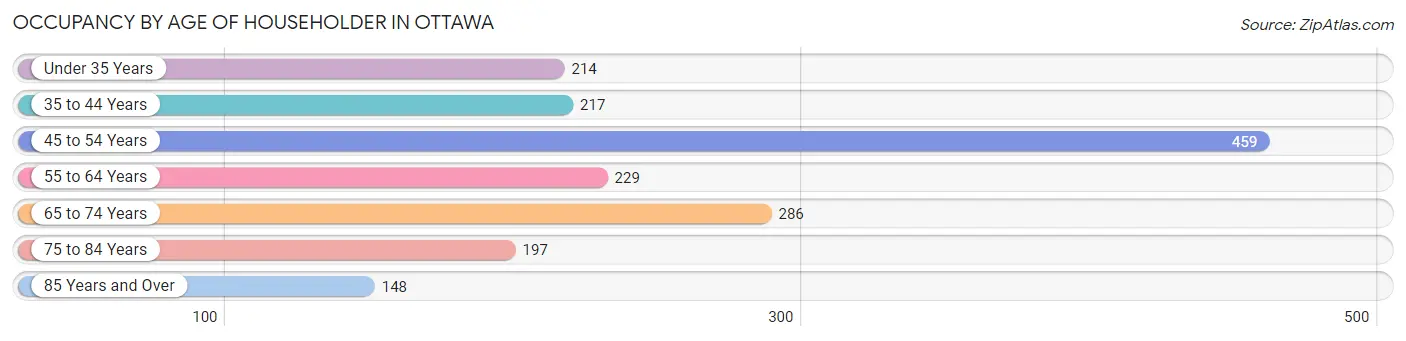
| Age Bracket | # Households | % Households |
| Under 35 Years | 214 | 12.2% |
| 35 to 44 Years | 217 | 12.4% |
| 45 to 54 Years | 459 | 26.2% |
| 55 to 64 Years | 229 | 13.1% |
| 65 to 74 Years | 286 | 16.3% |
| 75 to 84 Years | 197 | 11.3% |
| 85 Years and Over | 148 | 8.5% |
| Total | 1,750 | 100.0% |
Housing Finances in Ottawa
Median Income by Occupancy in Ottawa
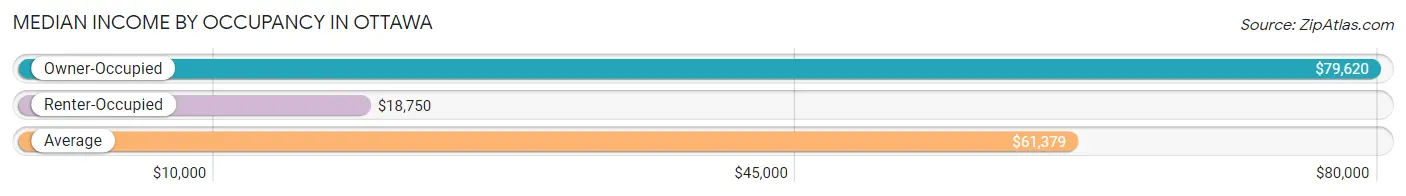
| Occupancy Type | # Households | Median Income |
| Owner-Occupied | 1,281 (73.2%) | $79,620 |
| Renter-Occupied | 469 (26.8%) | $18,750 |
| Average | 1,750 (100.0%) | $61,379 |
Occupancy by Householder Income Bracket in Ottawa
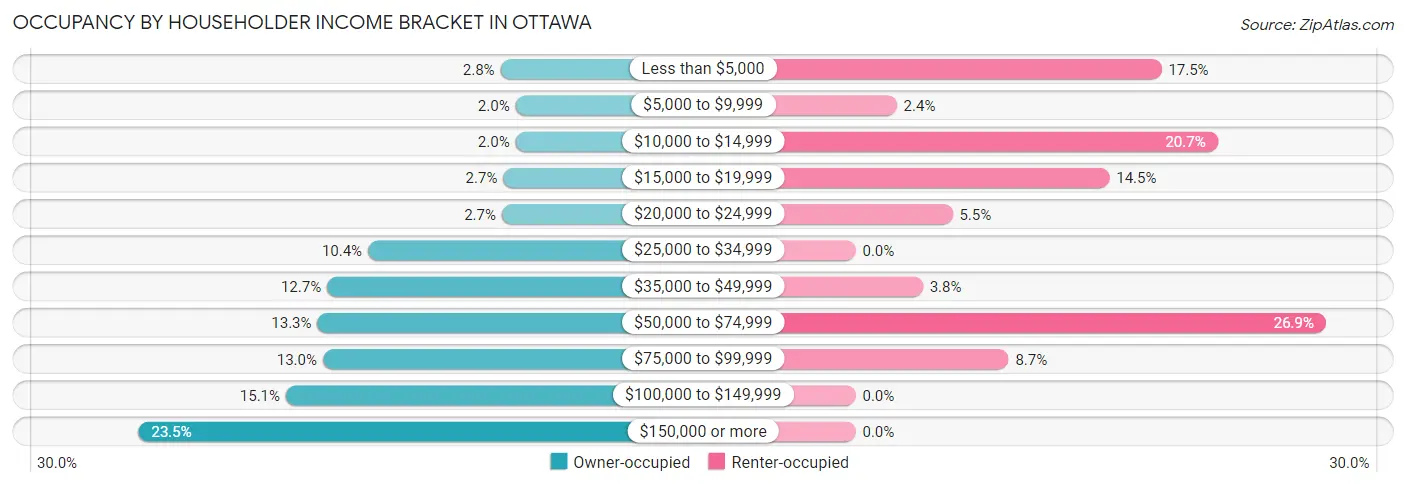
| Income Bracket | Owner-occupied | Renter-occupied |
| Less than $5,000 | 36 (2.8%) | 82 (17.5%) |
| $5,000 to $9,999 | 25 (1.9%) | 11 (2.4%) |
| $10,000 to $14,999 | 25 (1.9%) | 97 (20.7%) |
| $15,000 to $19,999 | 34 (2.6%) | 68 (14.5%) |
| $20,000 to $24,999 | 35 (2.7%) | 26 (5.5%) |
| $25,000 to $34,999 | 133 (10.4%) | 0 (0.0%) |
| $35,000 to $49,999 | 163 (12.7%) | 18 (3.8%) |
| $50,000 to $74,999 | 170 (13.3%) | 126 (26.9%) |
| $75,000 to $99,999 | 166 (13.0%) | 41 (8.7%) |
| $100,000 to $149,999 | 193 (15.1%) | 0 (0.0%) |
| $150,000 or more | 301 (23.5%) | 0 (0.0%) |
| Total | 1,281 (100.0%) | 469 (100.0%) |
Monthly Housing Cost Tiers in Ottawa
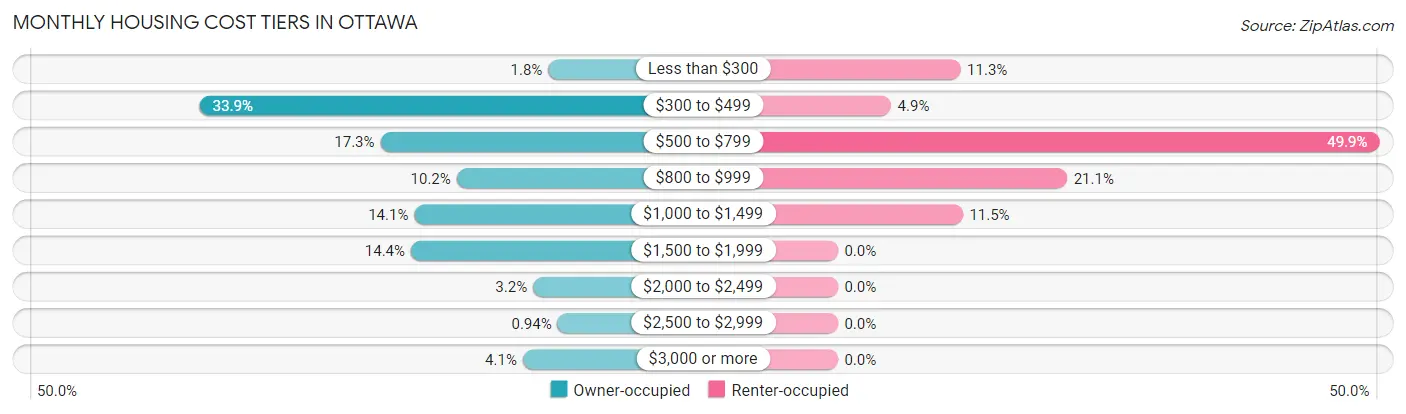
| Monthly Cost | Owner-occupied | Renter-occupied |
| Less than $300 | 23 (1.8%) | 53 (11.3%) |
| $300 to $499 | 434 (33.9%) | 23 (4.9%) |
| $500 to $799 | 221 (17.2%) | 234 (49.9%) |
| $800 to $999 | 131 (10.2%) | 99 (21.1%) |
| $1,000 to $1,499 | 181 (14.1%) | 54 (11.5%) |
| $1,500 to $1,999 | 185 (14.4%) | 0 (0.0%) |
| $2,000 to $2,499 | 41 (3.2%) | 0 (0.0%) |
| $2,500 to $2,999 | 12 (0.9%) | 0 (0.0%) |
| $3,000 or more | 53 (4.1%) | 0 (0.0%) |
| Total | 1,281 (100.0%) | 469 (100.0%) |
Physical Housing Characteristics in Ottawa
Housing Structures in Ottawa
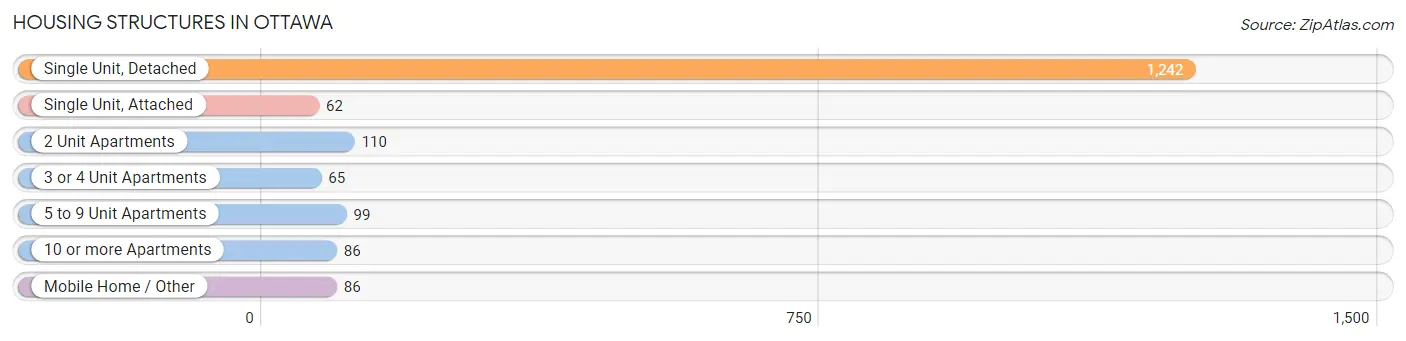
| Structure Type | # Housing Units | % Housing Units |
| Single Unit, Detached | 1,242 | 71.0% |
| Single Unit, Attached | 62 | 3.5% |
| 2 Unit Apartments | 110 | 6.3% |
| 3 or 4 Unit Apartments | 65 | 3.7% |
| 5 to 9 Unit Apartments | 99 | 5.7% |
| 10 or more Apartments | 86 | 4.9% |
| Mobile Home / Other | 86 | 4.9% |
| Total | 1,750 | 100.0% |
Housing Structures by Occupancy in Ottawa
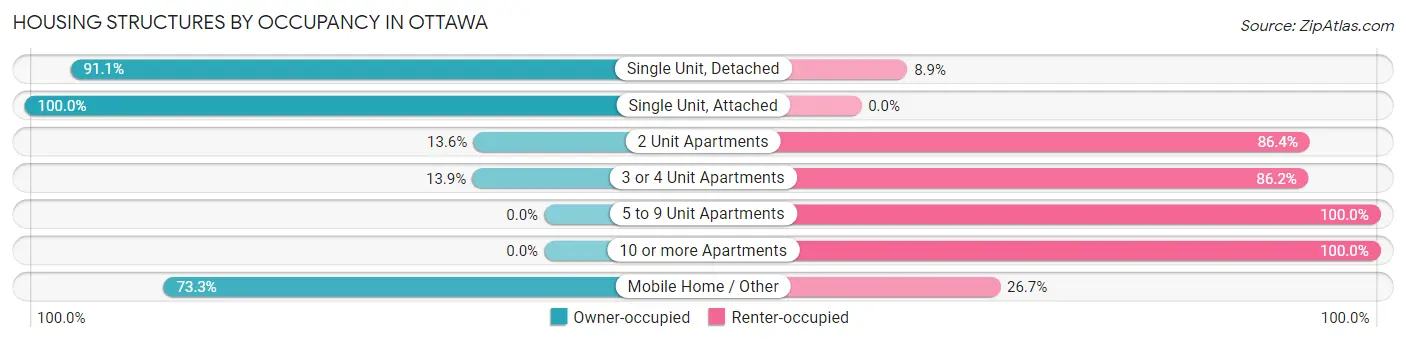
| Structure Type | Owner-occupied | Renter-occupied |
| Single Unit, Detached | 1,132 (91.1%) | 110 (8.9%) |
| Single Unit, Attached | 62 (100.0%) | 0 (0.0%) |
| 2 Unit Apartments | 15 (13.6%) | 95 (86.4%) |
| 3 or 4 Unit Apartments | 9 (13.9%) | 56 (86.2%) |
| 5 to 9 Unit Apartments | 0 (0.0%) | 99 (100.0%) |
| 10 or more Apartments | 0 (0.0%) | 86 (100.0%) |
| Mobile Home / Other | 63 (73.3%) | 23 (26.7%) |
| Total | 1,281 (73.2%) | 469 (26.8%) |
Housing Structures by Number of Rooms in Ottawa
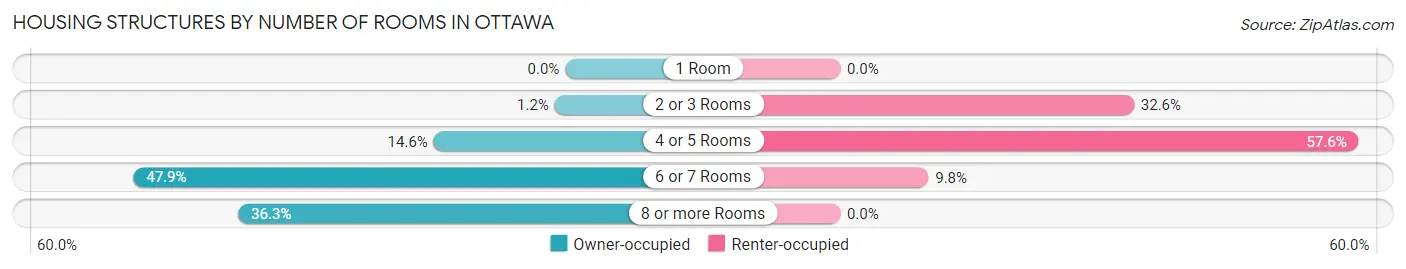
| Number of Rooms | Owner-occupied | Renter-occupied |
| 1 Room | 0 (0.0%) | 0 (0.0%) |
| 2 or 3 Rooms | 15 (1.2%) | 153 (32.6%) |
| 4 or 5 Rooms | 187 (14.6%) | 270 (57.6%) |
| 6 or 7 Rooms | 614 (47.9%) | 46 (9.8%) |
| 8 or more Rooms | 465 (36.3%) | 0 (0.0%) |
| Total | 1,281 (100.0%) | 469 (100.0%) |
Housing Structure by Heating Type in Ottawa
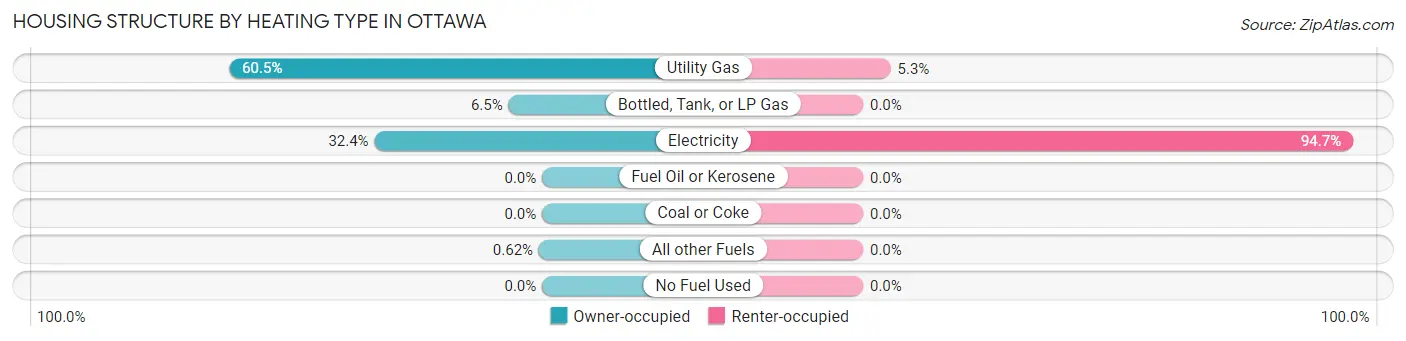
| Heating Type | Owner-occupied | Renter-occupied |
| Utility Gas | 775 (60.5%) | 25 (5.3%) |
| Bottled, Tank, or LP Gas | 83 (6.5%) | 0 (0.0%) |
| Electricity | 415 (32.4%) | 444 (94.7%) |
| Fuel Oil or Kerosene | 0 (0.0%) | 0 (0.0%) |
| Coal or Coke | 0 (0.0%) | 0 (0.0%) |
| All other Fuels | 8 (0.6%) | 0 (0.0%) |
| No Fuel Used | 0 (0.0%) | 0 (0.0%) |
| Total | 1,281 (100.0%) | 469 (100.0%) |
Household Vehicle Usage in Ottawa
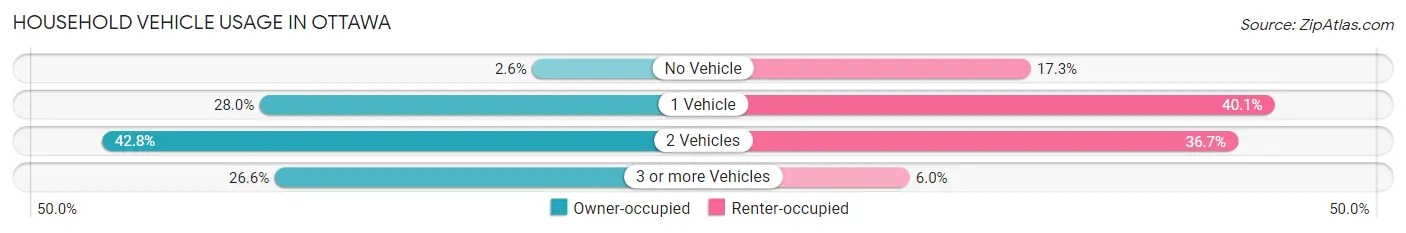
| Vehicles per Household | Owner-occupied | Renter-occupied |
| No Vehicle | 33 (2.6%) | 81 (17.3%) |
| 1 Vehicle | 359 (28.0%) | 188 (40.1%) |
| 2 Vehicles | 548 (42.8%) | 172 (36.7%) |
| 3 or more Vehicles | 341 (26.6%) | 28 (6.0%) |
| Total | 1,281 (100.0%) | 469 (100.0%) |
Real Estate & Mortgages in Ottawa
Real Estate and Mortgage Overview in Ottawa
| Characteristic | Without Mortgage | With Mortgage |
| Housing Units | 593 | 688 |
| Median Property Value | $146,400 | $190,500 |
| Median Household Income | $44,028 | $245 |
| Monthly Housing Costs | $470 | $53 |
| Real Estate Taxes | $1,492 | $11 |
Property Value by Mortgage Status in Ottawa

| Property Value | Without Mortgage | With Mortgage |
| Less than $50,000 | 24 (4.1%) | 71 (10.3%) |
| $50,000 to $99,999 | 61 (10.3%) | 71 (10.3%) |
| $100,000 to $299,999 | 430 (72.5%) | 389 (56.5%) |
| $300,000 to $499,999 | 78 (13.2%) | 98 (14.2%) |
| $500,000 to $749,999 | 0 (0.0%) | 32 (4.6%) |
| $750,000 to $999,999 | 0 (0.0%) | 27 (3.9%) |
| $1,000,000 or more | 0 (0.0%) | 0 (0.0%) |
| Total | 593 (100.0%) | 688 (100.0%) |
Household Income by Mortgage Status in Ottawa
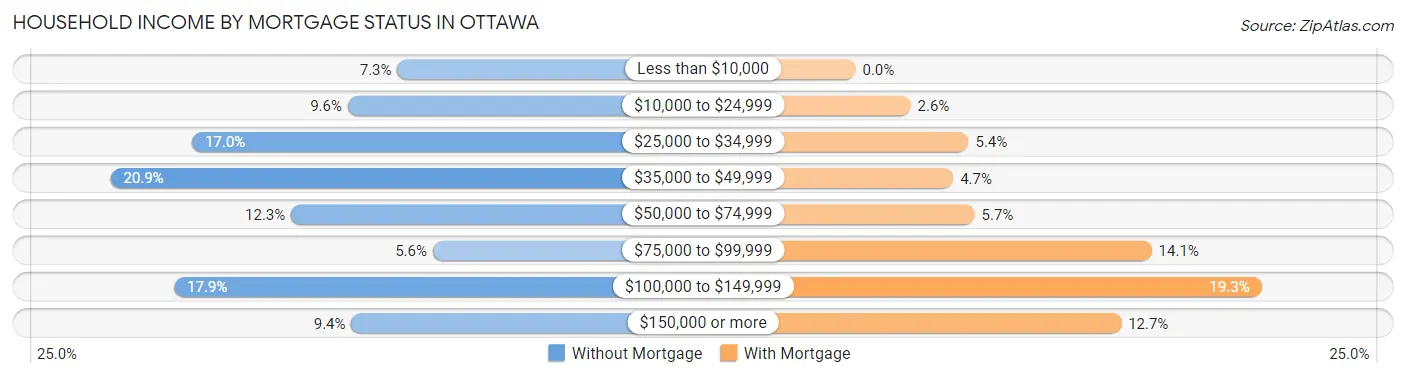
| Household Income | Without Mortgage | With Mortgage |
| Less than $10,000 | 43 (7.2%) | 0 (0.0%) |
| $10,000 to $24,999 | 57 (9.6%) | 18 (2.6%) |
| $25,000 to $34,999 | 101 (17.0%) | 37 (5.4%) |
| $35,000 to $49,999 | 124 (20.9%) | 32 (4.6%) |
| $50,000 to $74,999 | 73 (12.3%) | 39 (5.7%) |
| $75,000 to $99,999 | 33 (5.6%) | 97 (14.1%) |
| $100,000 to $149,999 | 106 (17.9%) | 133 (19.3%) |
| $150,000 or more | 56 (9.4%) | 87 (12.7%) |
| Total | 593 (100.0%) | 688 (100.0%) |
Property Value to Household Income Ratio in Ottawa
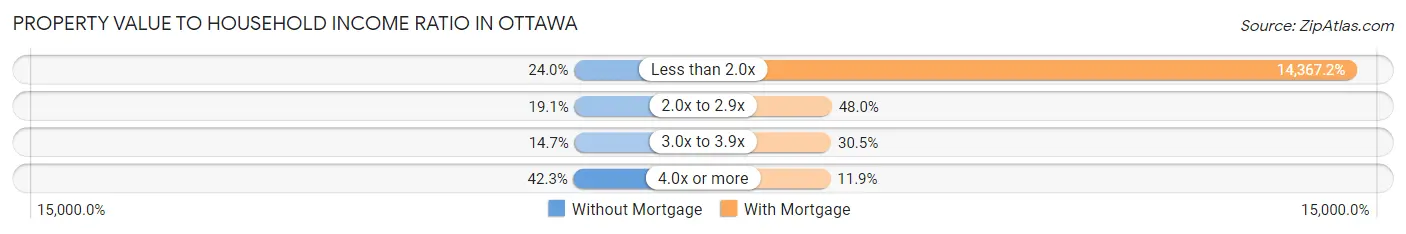
| Value-to-Income Ratio | Without Mortgage | With Mortgage |
| Less than 2.0x | 142 (23.9%) | 98,846 (14,367.2%) |
| 2.0x to 2.9x | 113 (19.1%) | 330 (48.0%) |
| 3.0x to 3.9x | 87 (14.7%) | 210 (30.5%) |
| 4.0x or more | 251 (42.3%) | 82 (11.9%) |
| Total | 593 (100.0%) | 688 (100.0%) |
Real Estate Taxes by Mortgage Status in Ottawa
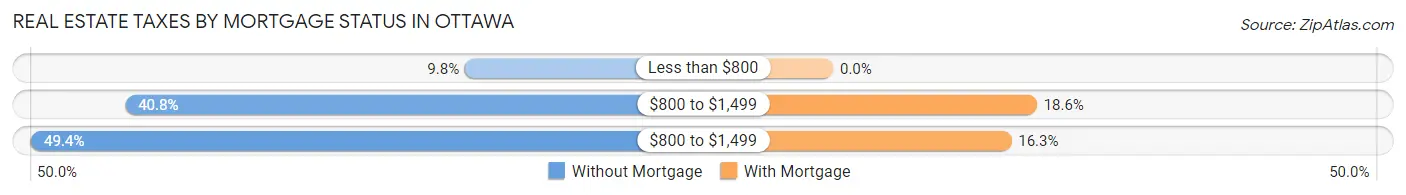
| Property Taxes | Without Mortgage | With Mortgage |
| Less than $800 | 58 (9.8%) | 0 (0.0%) |
| $800 to $1,499 | 242 (40.8%) | 128 (18.6%) |
| $800 to $1,499 | 293 (49.4%) | 112 (16.3%) |
| Total | 593 (100.0%) | 688 (100.0%) |
Health & Disability in Ottawa
Health Insurance Coverage by Age in Ottawa
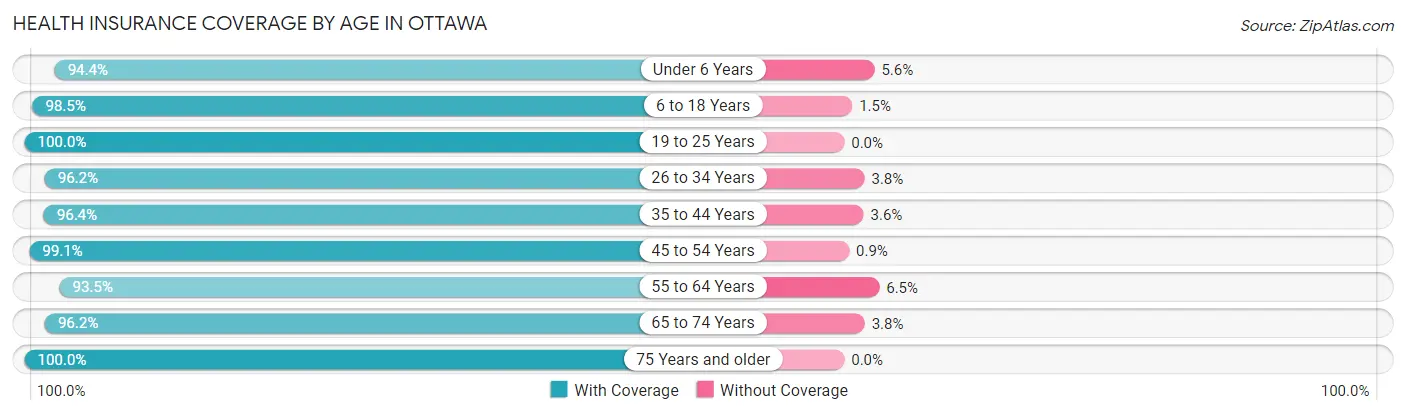
| Age Bracket | With Coverage | Without Coverage |
| Under 6 Years | 235 (94.4%) | 14 (5.6%) |
| 6 to 18 Years | 864 (98.5%) | 13 (1.5%) |
| 19 to 25 Years | 513 (100.0%) | 0 (0.0%) |
| 26 to 34 Years | 331 (96.2%) | 13 (3.8%) |
| 35 to 44 Years | 348 (96.4%) | 13 (3.6%) |
| 45 to 54 Years | 772 (99.1%) | 7 (0.9%) |
| 55 to 64 Years | 372 (93.5%) | 26 (6.5%) |
| 65 to 74 Years | 429 (96.2%) | 17 (3.8%) |
| 75 Years and older | 410 (100.0%) | 0 (0.0%) |
| Total | 4,274 (97.7%) | 103 (2.4%) |
Health Insurance Coverage by Citizenship Status in Ottawa
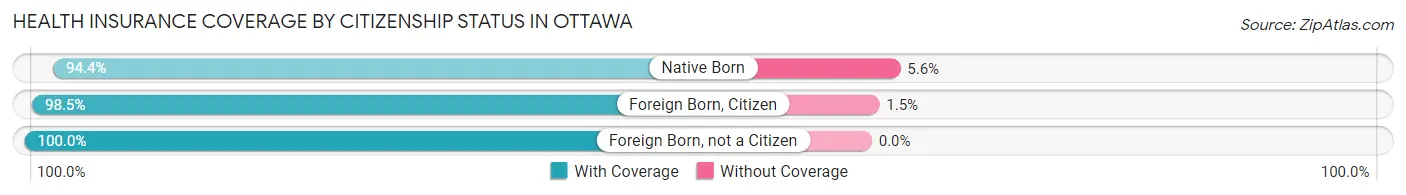
| Citizenship Status | With Coverage | Without Coverage |
| Native Born | 235 (94.4%) | 14 (5.6%) |
| Foreign Born, Citizen | 864 (98.5%) | 13 (1.5%) |
| Foreign Born, not a Citizen | 513 (100.0%) | 0 (0.0%) |
Health Insurance Coverage by Household Income in Ottawa
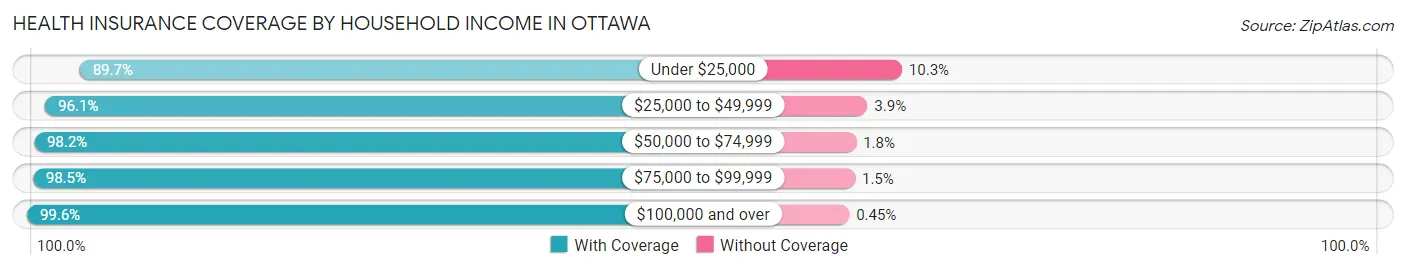
| Household Income | With Coverage | Without Coverage |
| Under $25,000 | 460 (89.7%) | 53 (10.3%) |
| $25,000 to $49,999 | 423 (96.1%) | 17 (3.9%) |
| $50,000 to $74,999 | 947 (98.2%) | 17 (1.8%) |
| $75,000 to $99,999 | 449 (98.5%) | 7 (1.5%) |
| $100,000 and over | 1,995 (99.6%) | 9 (0.4%) |
Public vs Private Health Insurance Coverage by Age in Ottawa
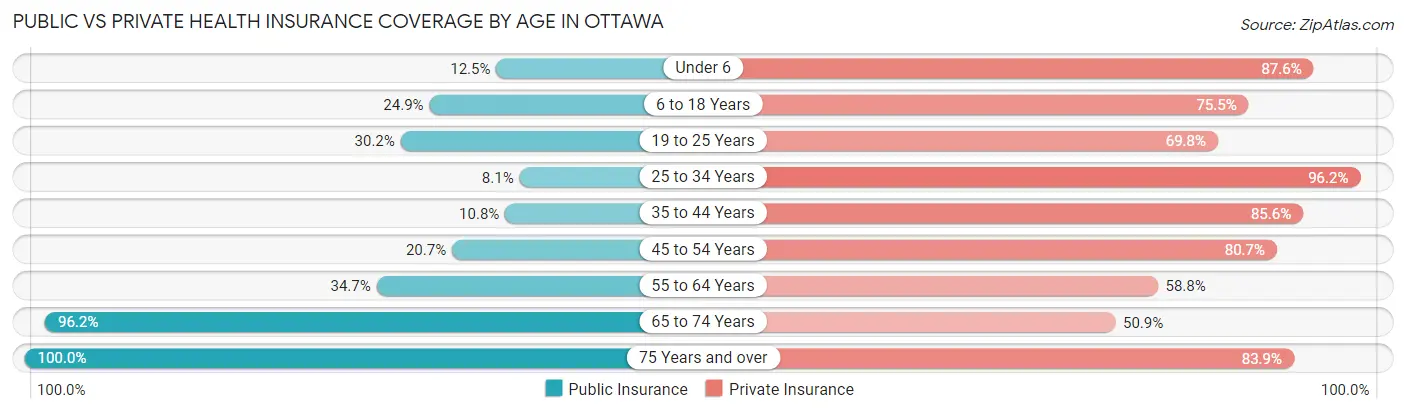
| Age Bracket | Public Insurance | Private Insurance |
| Under 6 | 31 (12.4%) | 218 (87.5%) |
| 6 to 18 Years | 218 (24.9%) | 662 (75.5%) |
| 19 to 25 Years | 155 (30.2%) | 358 (69.8%) |
| 25 to 34 Years | 28 (8.1%) | 331 (96.2%) |
| 35 to 44 Years | 39 (10.8%) | 309 (85.6%) |
| 45 to 54 Years | 161 (20.7%) | 629 (80.7%) |
| 55 to 64 Years | 138 (34.7%) | 234 (58.8%) |
| 65 to 74 Years | 429 (96.2%) | 227 (50.9%) |
| 75 Years and over | 410 (100.0%) | 344 (83.9%) |
| Total | 1,609 (36.8%) | 3,312 (75.7%) |
Disability Status by Sex by Age in Ottawa
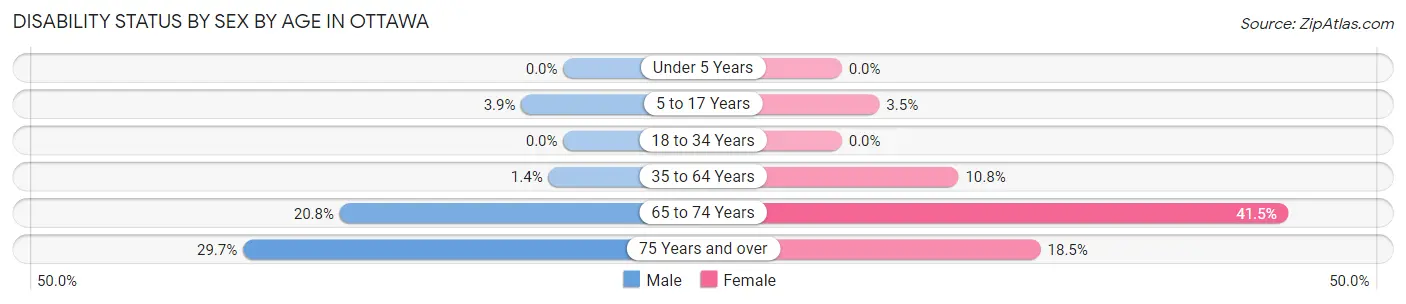
| Age Bracket | Male | Female |
| Under 5 Years | 0 (0.0%) | 0 (0.0%) |
| 5 to 17 Years | 16 (3.9%) | 16 (3.5%) |
| 18 to 34 Years | 0 (0.0%) | 0 (0.0%) |
| 35 to 64 Years | 11 (1.4%) | 80 (10.8%) |
| 65 to 74 Years | 33 (20.7%) | 119 (41.5%) |
| 75 Years and over | 22 (29.7%) | 62 (18.4%) |
Disability Class by Sex by Age in Ottawa
Disability Class: Hearing Difficulty
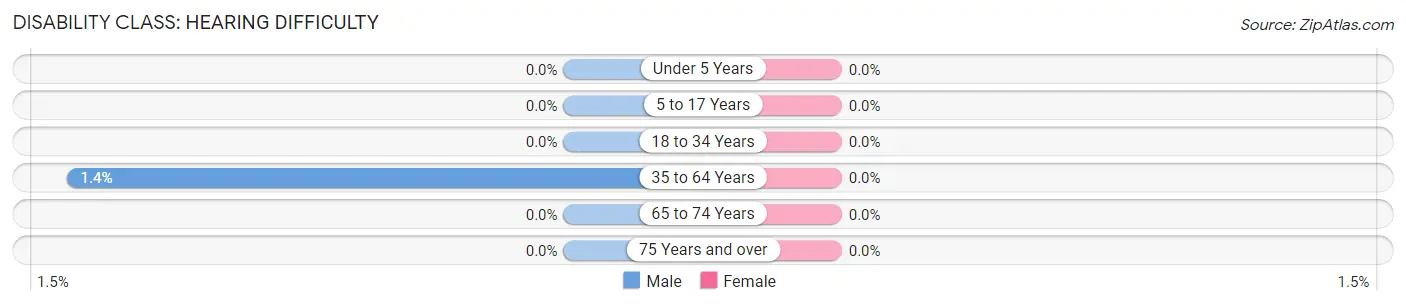
| Age Bracket | Male | Female |
| Under 5 Years | 0 (0.0%) | 0 (0.0%) |
| 5 to 17 Years | 0 (0.0%) | 0 (0.0%) |
| 18 to 34 Years | 0 (0.0%) | 0 (0.0%) |
| 35 to 64 Years | 11 (1.4%) | 0 (0.0%) |
| 65 to 74 Years | 0 (0.0%) | 0 (0.0%) |
| 75 Years and over | 0 (0.0%) | 0 (0.0%) |
Disability Class: Vision Difficulty
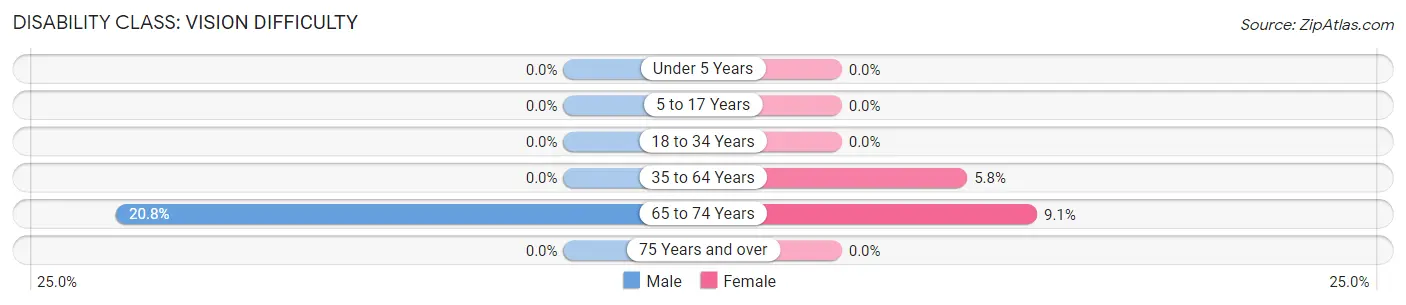
| Age Bracket | Male | Female |
| Under 5 Years | 0 (0.0%) | 0 (0.0%) |
| 5 to 17 Years | 0 (0.0%) | 0 (0.0%) |
| 18 to 34 Years | 0 (0.0%) | 0 (0.0%) |
| 35 to 64 Years | 0 (0.0%) | 43 (5.8%) |
| 65 to 74 Years | 33 (20.7%) | 26 (9.1%) |
| 75 Years and over | 0 (0.0%) | 0 (0.0%) |
Disability Class: Cognitive Difficulty
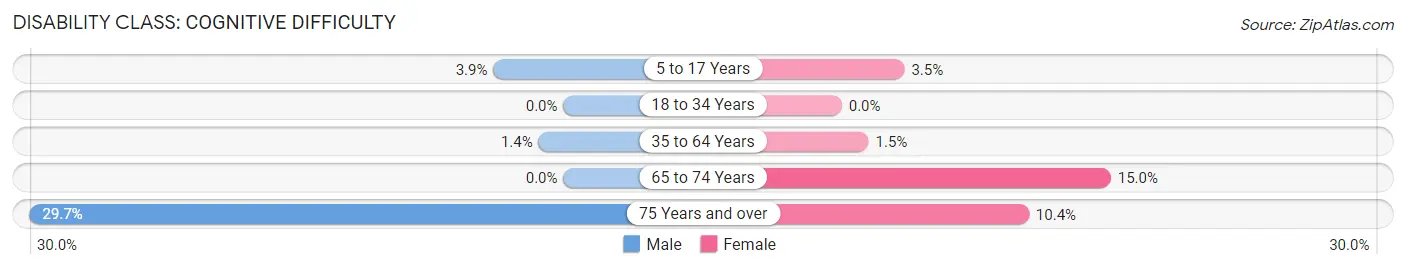
| Age Bracket | Male | Female |
| 5 to 17 Years | 16 (3.9%) | 16 (3.5%) |
| 18 to 34 Years | 0 (0.0%) | 0 (0.0%) |
| 35 to 64 Years | 11 (1.4%) | 11 (1.5%) |
| 65 to 74 Years | 0 (0.0%) | 43 (15.0%) |
| 75 Years and over | 22 (29.7%) | 35 (10.4%) |
Disability Class: Ambulatory Difficulty
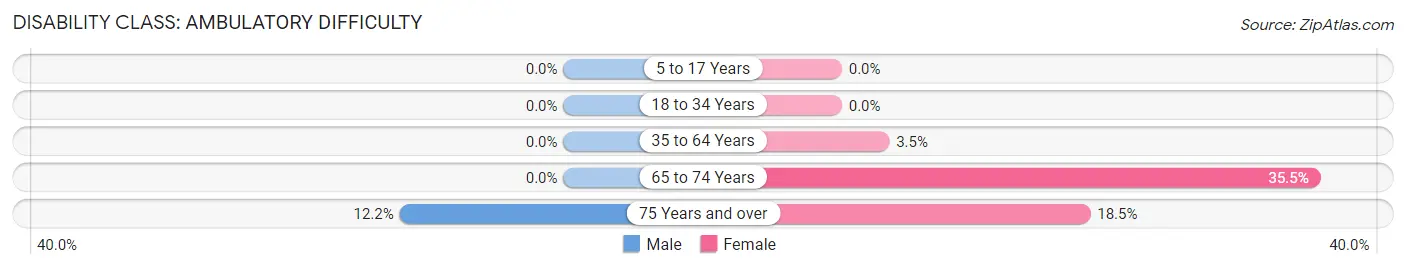
| Age Bracket | Male | Female |
| 5 to 17 Years | 0 (0.0%) | 0 (0.0%) |
| 18 to 34 Years | 0 (0.0%) | 0 (0.0%) |
| 35 to 64 Years | 0 (0.0%) | 26 (3.5%) |
| 65 to 74 Years | 0 (0.0%) | 102 (35.5%) |
| 75 Years and over | 9 (12.2%) | 62 (18.4%) |
Disability Class: Self-Care Difficulty
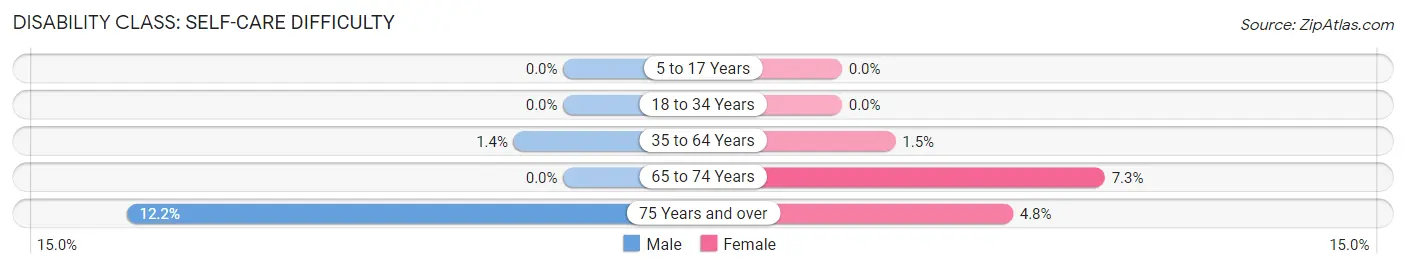
| Age Bracket | Male | Female |
| 5 to 17 Years | 0 (0.0%) | 0 (0.0%) |
| 18 to 34 Years | 0 (0.0%) | 0 (0.0%) |
| 35 to 64 Years | 11 (1.4%) | 11 (1.5%) |
| 65 to 74 Years | 0 (0.0%) | 21 (7.3%) |
| 75 Years and over | 9 (12.2%) | 16 (4.8%) |
Technology Access in Ottawa
Computing Device Access in Ottawa
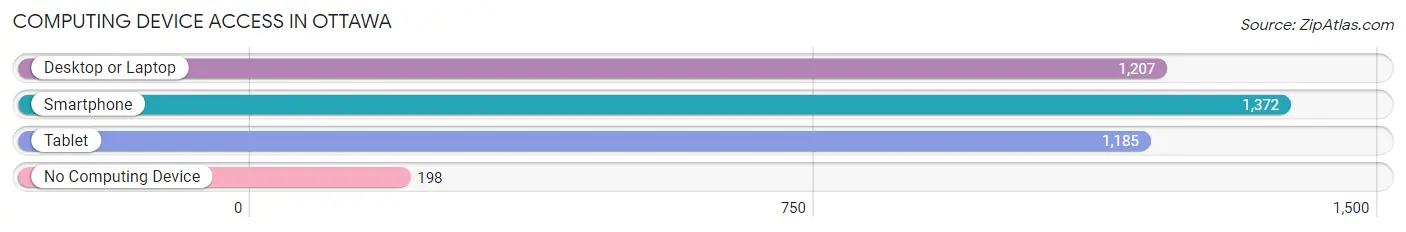
| Device Type | # Households | % Households |
| Desktop or Laptop | 1,207 | 69.0% |
| Smartphone | 1,372 | 78.4% |
| Tablet | 1,185 | 67.7% |
| No Computing Device | 198 | 11.3% |
| Total | 1,750 | 100.0% |
Internet Access in Ottawa
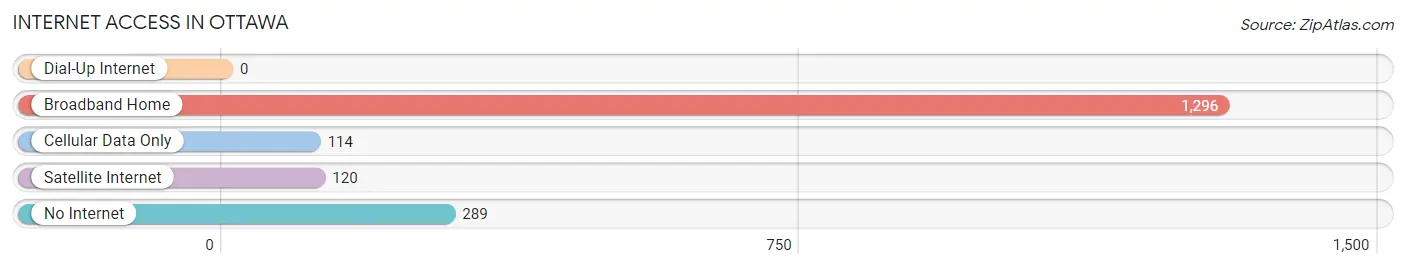
| Internet Type | # Households | % Households |
| Dial-Up Internet | 0 | 0.0% |
| Broadband Home | 1,296 | 74.1% |
| Cellular Data Only | 114 | 6.5% |
| Satellite Internet | 120 | 6.9% |
| No Internet | 289 | 16.5% |
| Total | 1,750 | 100.0% |
Ottawa Summary
Ottawa is a city located in Putnam County, Ohio, United States. It is the county seat of Putnam County and is located along the Auglaize River. The population was 5,098 at the 2010 census.
Geography
Ottawa is located at 41°02'N 84°14'W (41.037, -84.235). According to the United States Census Bureau, the city has a total area of 3.2 square miles (8.3 km2), all land.
History
The area that is now Ottawa was first settled in 1831 by a group of settlers from Pennsylvania. The town was originally named "Venedocia" after a nearby stream. In 1833, the name was changed to Ottawa after the Ottawa tribe of Native Americans who had lived in the area.
The town was incorporated in 1845 and became the county seat of Putnam County in 1848. The town grew rapidly in the late 19th century, and by 1900 had a population of over 3,000.
Economy
The economy of Ottawa is largely based on agriculture and manufacturing. The city is home to several large manufacturing companies, including the Ottawa Foundry, the Ottawa Machine Company, and the Ottawa Plastics Company.
Agriculture is also an important part of the local economy. The area is home to several large farms, including the Ottawa Dairy Farm, the Ottawa Grain Farm, and the Ottawa Fruit Farm.
Demographics
As of the census of 2010, there were 5,098 people, 2,068 households, and 1,323 families residing in the city. The population density was 1,588.3 people per square mile (613.7/km2). There were 2,269 housing units at an average density of 709.7 per square mile (274.2/km2). The racial makeup of the city was 97.2% White, 0.7% African American, 0.2% Native American, 0.3% Asian, 0.2% from other races, and 1.4% from two or more races. Hispanic or Latino of any race were 1.2% of the population.
There were 2,068 households, out of which 30.2% had children under the age of 18 living with them, 46.2% were married couples living together, 13.2% had a female householder with no husband present, and 36.2% were non-families. 32.2% of all households were made up of individuals, and 15.2% had someone living alone who was 65 years of age or older. The average household size was 2.37 and the average family size was 2.97.
In the city, the population was spread out, with 24.2% under the age of 18, 8.2% from 18 to 24, 25.7% from 25 to 44, 22.7% from 45 to 64, and 19.2% who were 65 years of age or older. The median age was 38 years. For every 100 females, there were 87.3 males. For every 100 females age 18 and over, there were 82.7 males.
The median income for a household in the city was $35,938, and the median income for a family was $45,938. Males had a median income of $35,938 versus $25,938 for females. The per capita income for the city was $18,938. About 8.2% of families and 10.2% of the population were below the poverty line, including 14.2% of those under age 18 and 8.2% of those age 65 or over.
Common Questions
What is Per Capita Income in Ottawa?
Per Capita income in Ottawa is $33,461.
What is the Median Family Income in Ottawa?
Median Family Income in Ottawa is $94,286.
What is the Median Household income in Ottawa?
Median Household Income in Ottawa is $61,379.
What is Income or Wage Gap in Ottawa?
Income or Wage Gap in Ottawa is 56.4%.
Women in Ottawa earn 43.6 cents for every dollar earned by a man.
What is Inequality or Gini Index in Ottawa?
Inequality or Gini Index in Ottawa is 0.47.
What is the Total Population of Ottawa?
Total Population of Ottawa is 4,447.
What is the Total Male Population of Ottawa?
Total Male Population of Ottawa is 2,114.
What is the Total Female Population of Ottawa?
Total Female Population of Ottawa is 2,333.
What is the Ratio of Males per 100 Females in Ottawa?
There are 90.61 Males per 100 Females in Ottawa.
What is the Ratio of Females per 100 Males in Ottawa?
There are 110.36 Females per 100 Males in Ottawa.
What is the Median Population Age in Ottawa?
Median Population Age in Ottawa is 42.2 Years.
What is the Average Family Size in Ottawa
Average Family Size in Ottawa is 3.5 People.
What is the Average Household Size in Ottawa
Average Household Size in Ottawa is 2.5 People.
How Large is the Labor Force in Ottawa?
There are 2,044 People in the Labor Forcein in Ottawa.
What is the Percentage of People in the Labor Force in Ottawa?
58.0% of People are in the Labor Force in Ottawa.