Lake Tomahawk, OH Map & Demographics
Lake Tomahawk Map
Lake Tomahawk Overview
$41,529
PER CAPITA INCOME
$180,107
AVG FAMILY INCOME
0.31
INEQUALITY / GINI INDEX
777
TOTAL POPULATION
412
MALE POPULATION
365
FEMALE POPULATION
112.88
MALES / 100 FEMALES
88.59
FEMALES / 100 MALES
42.0
MEDIAN AGE
2.7
AVG FAMILY SIZE
2.4
AVG HOUSEHOLD SIZE
500
LABOR FORCE [ PEOPLE ]
72.3%
PERCENT IN LABOR FORCE
9.0%
UNEMPLOYMENT RATE
Income in Lake Tomahawk
Income Overview in Lake Tomahawk
| Characteristic | Number | Measure |
| Per Capita Income | 777 | $41,529 |
| Median Family Income | 256 | $180,107 |
| Mean Family Income | 256 | $138,965 |
| Median Household Income | 325 | $0 |
| Mean Household Income | 325 | $115,287 |
| Income Deficit | 256 | $0 |
| Wage / Income Gap (%) | 777 | 0.00% |
| Wage / Income Gap ($) | 777 | 100.00¢ per $1 |
| Gini / Inequality Index | 777 | 0.31 |
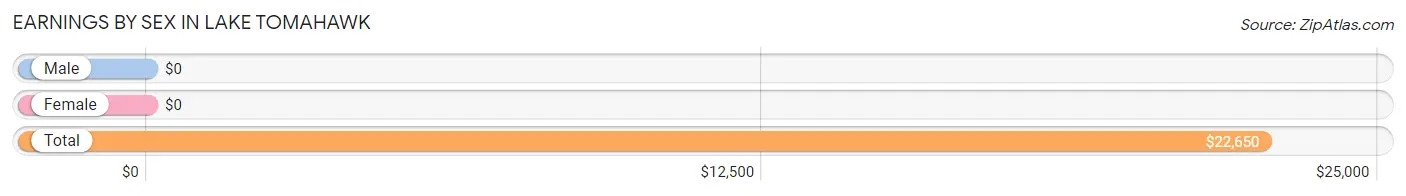
Earnings by Sex in Lake Tomahawk
| Sex | Number | Average Earnings |
| Male | 340 (65.9%) | $0 |
| Female | 176 (34.1%) | $0 |
| Total | 516 (100.0%) | $22,650 |
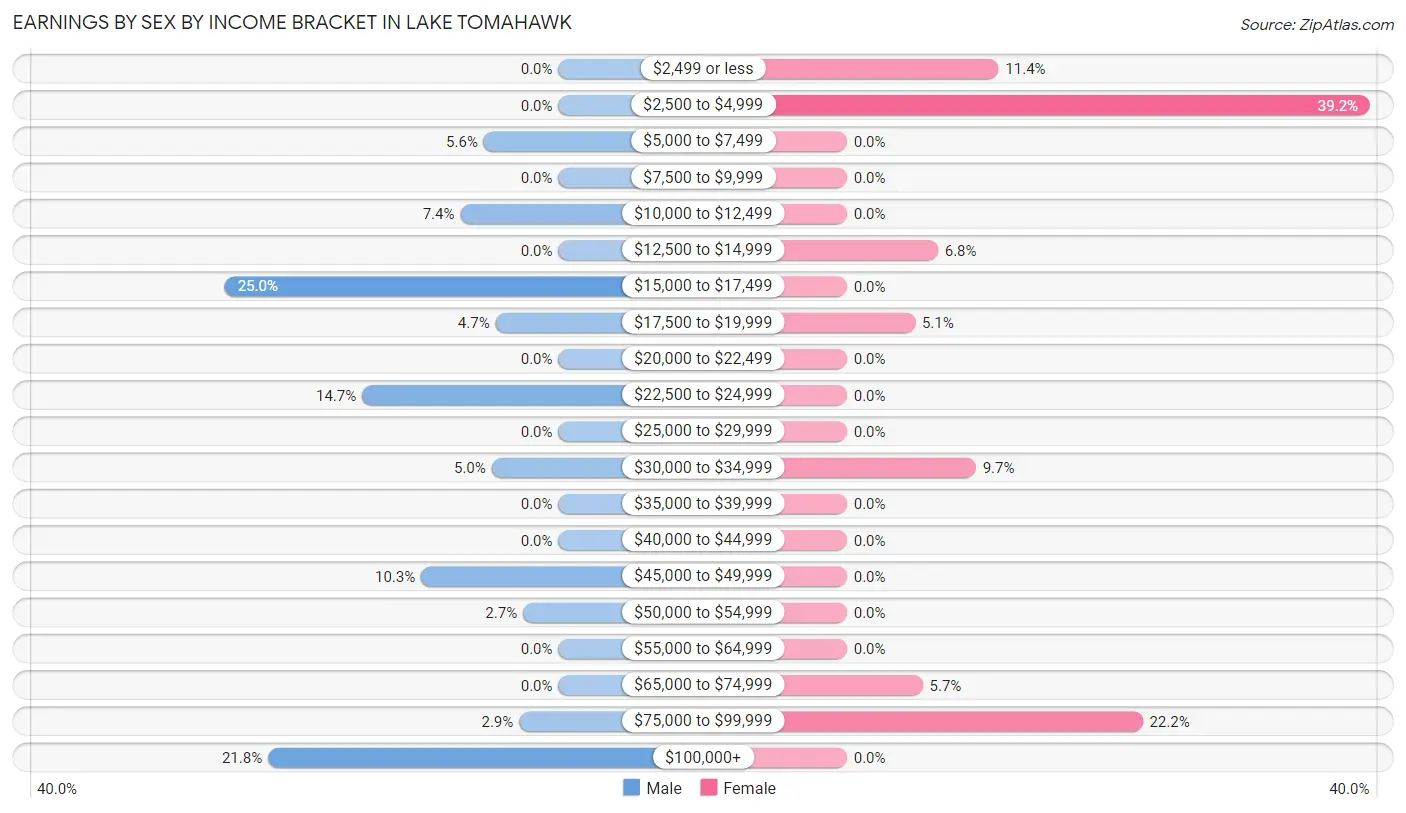
Earnings by Sex by Income Bracket in Lake Tomahawk
The most common earnings brackets in Lake Tomahawk are $15,000 to $17,499 for men (85 | 25.0%) and $2,500 to $4,999 for women (69 | 39.2%).
| Income | Male | Female |
| $2,499 or less | 0 (0.0%) | 20 (11.4%) |
| $2,500 to $4,999 | 0 (0.0%) | 69 (39.2%) |
| $5,000 to $7,499 | 19 (5.6%) | 0 (0.0%) |
| $7,500 to $9,999 | 0 (0.0%) | 0 (0.0%) |
| $10,000 to $12,499 | 25 (7.3%) | 0 (0.0%) |
| $12,500 to $14,999 | 0 (0.0%) | 12 (6.8%) |
| $15,000 to $17,499 | 85 (25.0%) | 0 (0.0%) |
| $17,500 to $19,999 | 16 (4.7%) | 9 (5.1%) |
| $20,000 to $22,499 | 0 (0.0%) | 0 (0.0%) |
| $22,500 to $24,999 | 50 (14.7%) | 0 (0.0%) |
| $25,000 to $29,999 | 0 (0.0%) | 0 (0.0%) |
| $30,000 to $34,999 | 17 (5.0%) | 17 (9.7%) |
| $35,000 to $39,999 | 0 (0.0%) | 0 (0.0%) |
| $40,000 to $44,999 | 0 (0.0%) | 0 (0.0%) |
| $45,000 to $49,999 | 35 (10.3%) | 0 (0.0%) |
| $50,000 to $54,999 | 9 (2.6%) | 0 (0.0%) |
| $55,000 to $64,999 | 0 (0.0%) | 0 (0.0%) |
| $65,000 to $74,999 | 0 (0.0%) | 10 (5.7%) |
| $75,000 to $99,999 | 10 (2.9%) | 39 (22.2%) |
| $100,000+ | 74 (21.8%) | 0 (0.0%) |
| Total | 340 (100.0%) | 176 (100.0%) |
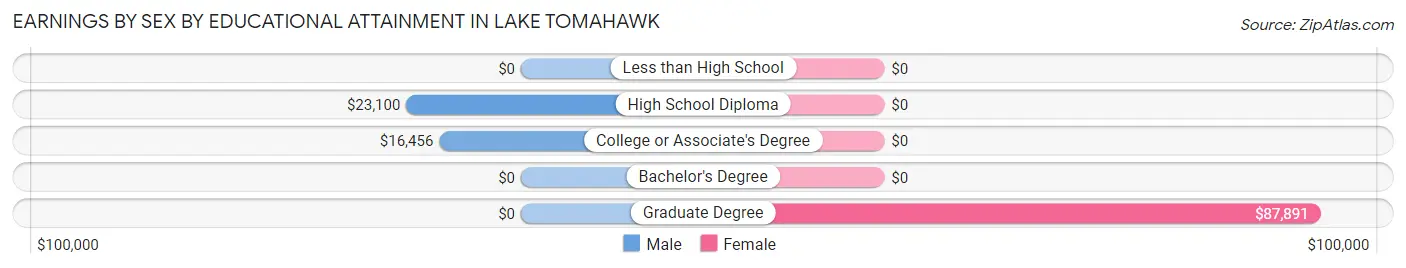
Earnings by Sex by Educational Attainment in Lake Tomahawk
| Educational Attainment | Male Income | Female Income |
| Less than High School | - | - |
| High School Diploma | $23,100 | $0 |
| College or Associate's Degree | $16,456 | $0 |
| Bachelor's Degree | - | - |
| Graduate Degree | - | - |
| Total | - | - |
Family Income in Lake Tomahawk
Family Income Brackets in Lake Tomahawk
According to the Lake Tomahawk family income data, there are 154 families falling into the $150,000 to $199,999 income range, which is the most common income bracket and makes up 60.2% of all families.
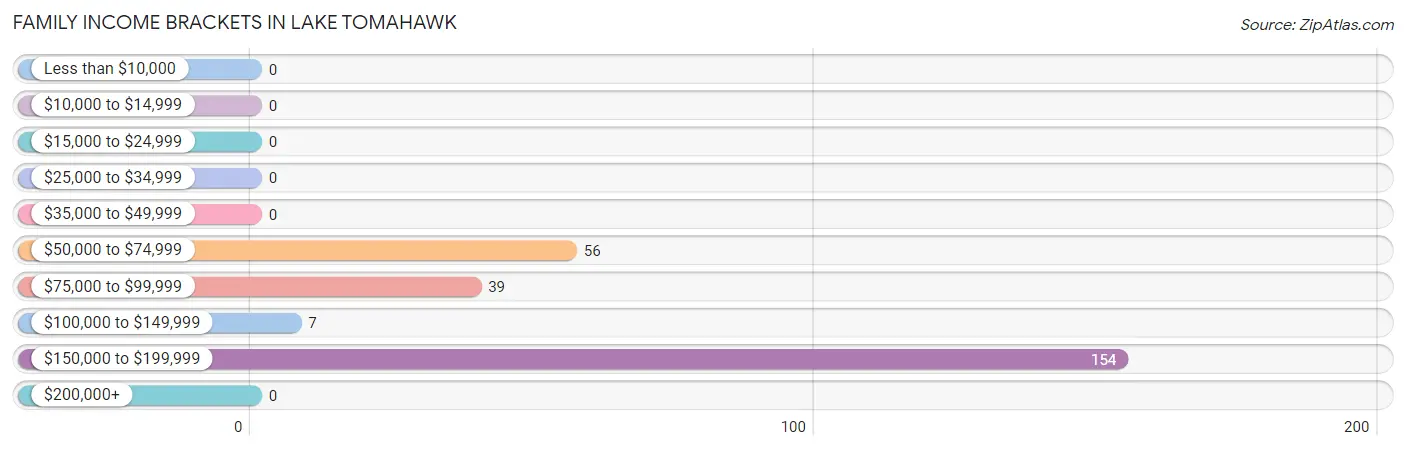
| Income Bracket | # Families | % Families |
| Less than $10,000 | 0 | 0.0% |
| $10,000 to $14,999 | 0 | 0.0% |
| $15,000 to $24,999 | 0 | 0.0% |
| $25,000 to $34,999 | 0 | 0.0% |
| $35,000 to $49,999 | 0 | 0.0% |
| $50,000 to $74,999 | 56 | 21.9% |
| $75,000 to $99,999 | 39 | 15.2% |
| $100,000 to $149,999 | 7 | 2.7% |
| $150,000 to $199,999 | 154 | 60.2% |
| $200,000+ | 0 | 0.0% |
Family Income by Famaliy Size in Lake Tomahawk
4-person families (92 | 35.9%) account for the highest median family income in Lake Tomahawk with $180,857 per family, while 4-person families (92 | 35.9%) have the highest median income of $45,214 per family member.
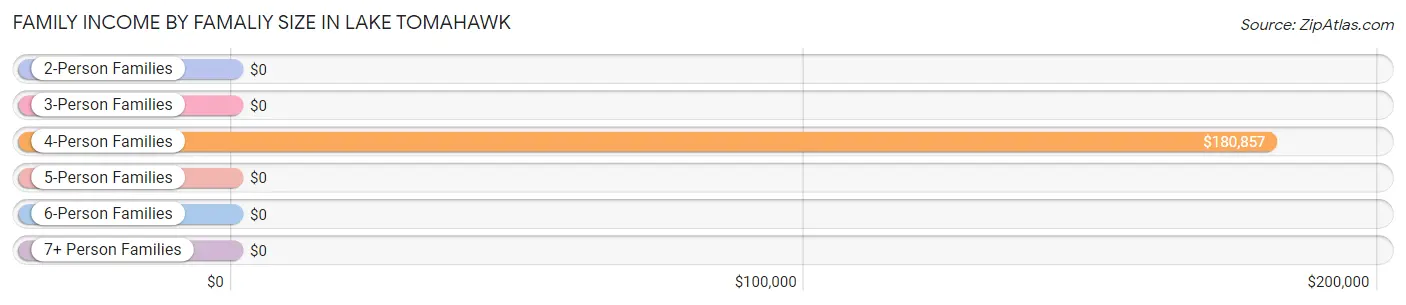
| Income Bracket | # Families | Median Income |
| 2-Person Families | 129 (50.4%) | $0 |
| 3-Person Families | 22 (8.6%) | $0 |
| 4-Person Families | 92 (35.9%) | $180,857 |
| 5-Person Families | 0 (0.0%) | $0 |
| 6-Person Families | 0 (0.0%) | $0 |
| 7+ Person Families | 13 (5.1%) | $0 |
| Total | 256 (100.0%) | $180,107 |
Family Income by Number of Earners in Lake Tomahawk
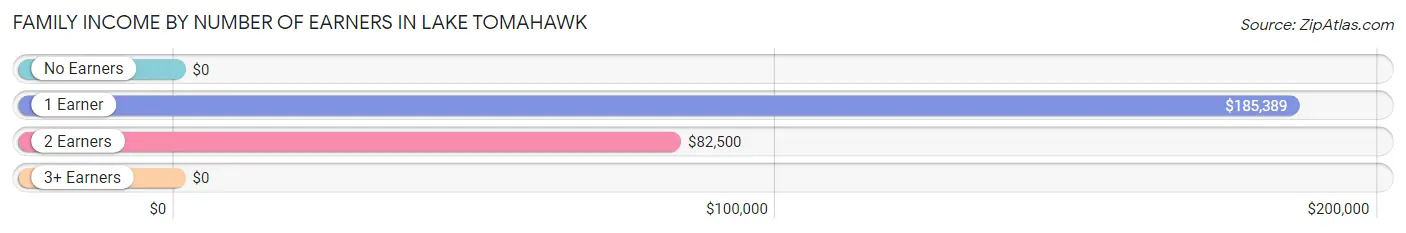
| Number of Earners | # Families | Median Income |
| No Earners | 15 (5.9%) | $0 |
| 1 Earner | 103 (40.2%) | $185,389 |
| 2 Earners | 58 (22.7%) | $82,500 |
| 3+ Earners | 80 (31.2%) | $0 |
| Total | 256 (100.0%) | $180,107 |
Household Income in Lake Tomahawk
Household Income Brackets in Lake Tomahawk
With 154 households falling in the category, the $150,000 to $199,999 income range is the most frequent in Lake Tomahawk, accounting for 47.4% of all households.
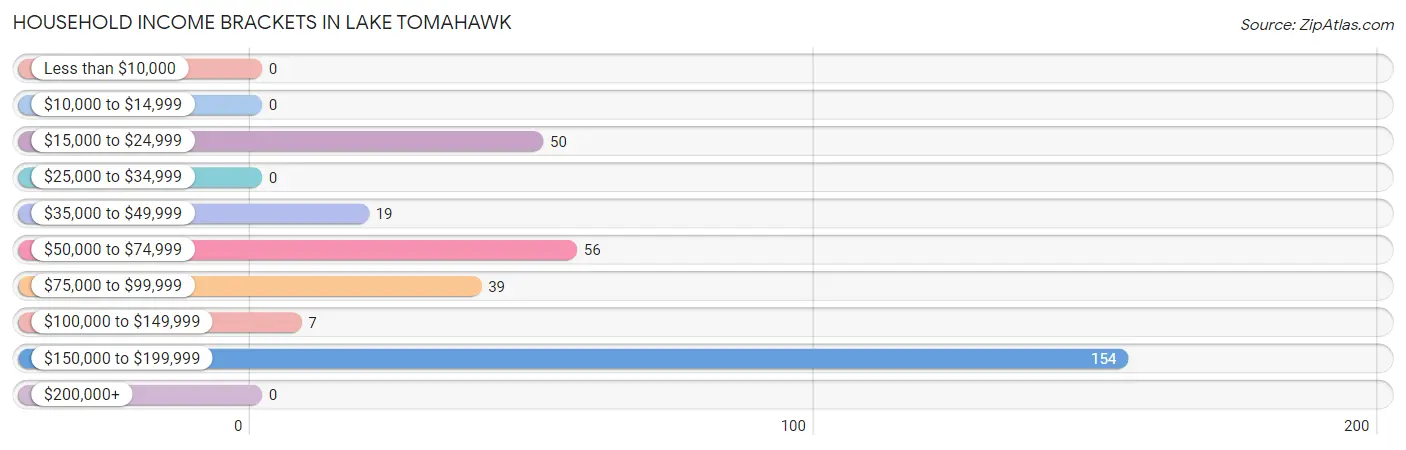
| Income Bracket | # Households | % Households |
| Less than $10,000 | 0 | 0.0% |
| $10,000 to $14,999 | 0 | 0.0% |
| $15,000 to $24,999 | 50 | 15.4% |
| $25,000 to $34,999 | 0 | 0.0% |
| $35,000 to $49,999 | 19 | 5.8% |
| $50,000 to $74,999 | 56 | 17.2% |
| $75,000 to $99,999 | 39 | 12.0% |
| $100,000 to $149,999 | 7 | 2.2% |
| $150,000 to $199,999 | 154 | 47.4% |
| $200,000+ | 0 | 0.0% |
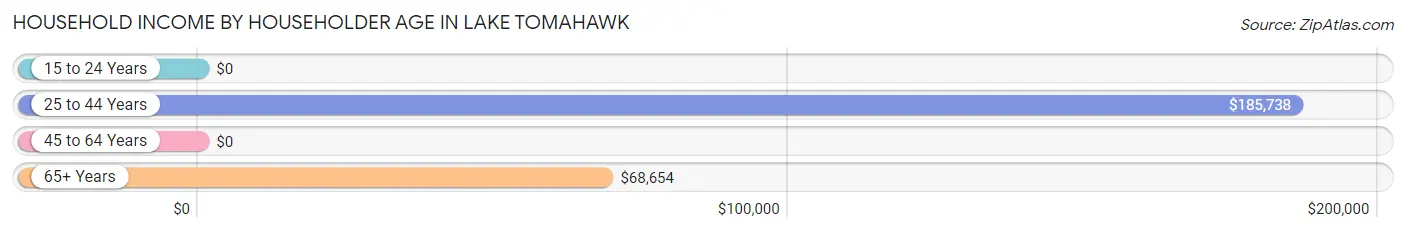
Household Income by Householder Age in Lake Tomahawk
The median household income in Lake Tomahawk is $0, with the highest median household income of $185,738 found in the 25 to 44 years age bracket for the primary householder. A total of 86 households (26.5%) fall into this category.
| Income Bracket | # Households | Median Income |
| 15 to 24 Years | 0 (0.0%) | $0 |
| 25 to 44 Years | 86 (26.5%) | $185,738 |
| 45 to 64 Years | 195 (60.0%) | $0 |
| 65+ Years | 44 (13.5%) | $68,654 |
| Total | 325 (100.0%) | $0 |
Poverty in Lake Tomahawk
Income Below Poverty by Sex and Age in Lake Tomahawk
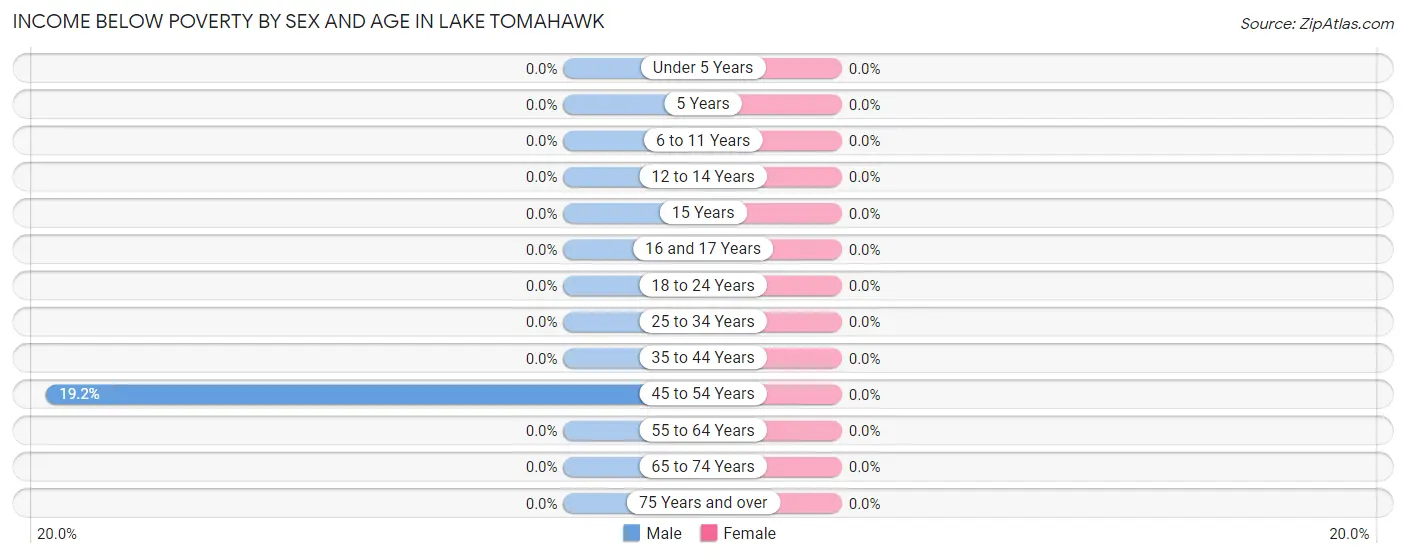
| Age Bracket | Male | Female |
| Under 5 Years | 0 (0.0%) | 0 (0.0%) |
| 5 Years | 0 (0.0%) | 0 (0.0%) |
| 6 to 11 Years | 0 (0.0%) | 0 (0.0%) |
| 12 to 14 Years | 0 (0.0%) | 0 (0.0%) |
| 15 Years | 0 (0.0%) | 0 (0.0%) |
| 16 and 17 Years | 0 (0.0%) | 0 (0.0%) |
| 18 to 24 Years | 0 (0.0%) | 0 (0.0%) |
| 25 to 34 Years | 0 (0.0%) | 0 (0.0%) |
| 35 to 44 Years | 0 (0.0%) | 0 (0.0%) |
| 45 to 54 Years | 19 (19.2%) | 0 (0.0%) |
| 55 to 64 Years | 0 (0.0%) | 0 (0.0%) |
| 65 to 74 Years | 0 (0.0%) | 0 (0.0%) |
| 75 Years and over | 0 (0.0%) | 0 (0.0%) |
| Total | 19 (4.6%) | 0 (0.0%) |
Income Above Poverty by Sex and Age in Lake Tomahawk
According to the poverty statistics in Lake Tomahawk, males aged 6 to 11 years and females aged under 5 years are the age groups that are most secure financially, with 100.0% of males and 100.0% of females in these age groups living above the poverty line.
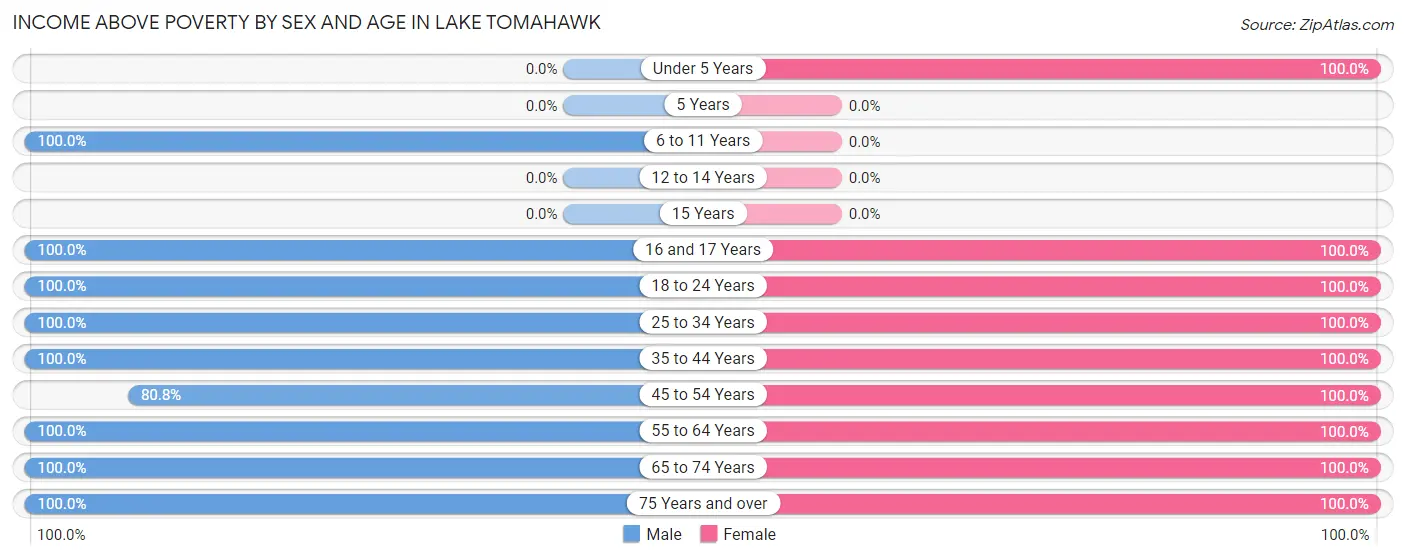
| Age Bracket | Male | Female |
| Under 5 Years | 0 (0.0%) | 59 (100.0%) |
| 5 Years | 0 (0.0%) | 0 (0.0%) |
| 6 to 11 Years | 26 (100.0%) | 0 (0.0%) |
| 12 to 14 Years | 0 (0.0%) | 0 (0.0%) |
| 15 Years | 0 (0.0%) | 0 (0.0%) |
| 16 and 17 Years | 16 (100.0%) | 36 (100.0%) |
| 18 to 24 Years | 39 (100.0%) | 92 (100.0%) |
| 25 to 34 Years | 15 (100.0%) | 32 (100.0%) |
| 35 to 44 Years | 85 (100.0%) | 25 (100.0%) |
| 45 to 54 Years | 80 (80.8%) | 26 (100.0%) |
| 55 to 64 Years | 86 (100.0%) | 63 (100.0%) |
| 65 to 74 Years | 33 (100.0%) | 15 (100.0%) |
| 75 Years and over | 13 (100.0%) | 17 (100.0%) |
| Total | 393 (95.4%) | 365 (100.0%) |
Income Below Poverty Among Married-Couple Families in Lake Tomahawk
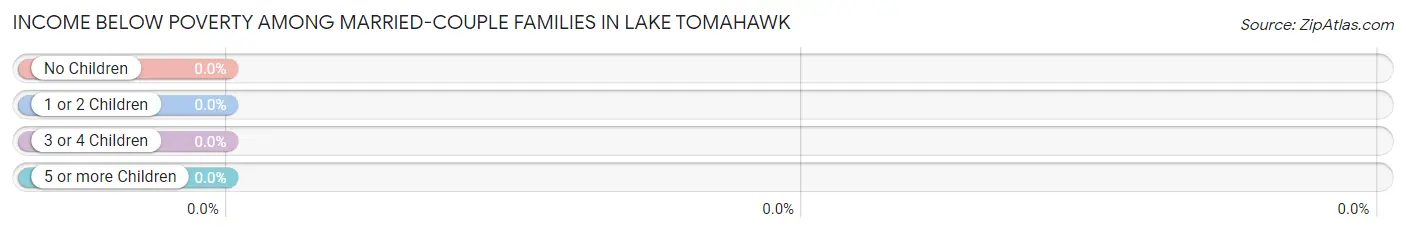
| Children | Above Poverty | Below Poverty |
| No Children | 148 (100.0%) | 0 (0.0%) |
| 1 or 2 Children | 22 (100.0%) | 0 (0.0%) |
| 3 or 4 Children | 13 (100.0%) | 0 (0.0%) |
| 5 or more Children | 0 (0.0%) | 0 (0.0%) |
| Total | 183 (100.0%) | 0 (0.0%) |
Income Below Poverty Among Single-Parent Households in Lake Tomahawk
| Children | Single Father | Single Mother |
| No Children | 0 (0.0%) | 0 (0.0%) |
| 1 or 2 Children | 0 (0.0%) | 0 (0.0%) |
| 3 or 4 Children | 0 (0.0%) | 0 (0.0%) |
| 5 or more Children | 0 (0.0%) | 0 (0.0%) |
| Total | 0 (0.0%) | 0 (0.0%) |
Income Below Poverty Among Married-Couple vs Single-Parent Households in Lake Tomahawk
| Children | Married-Couple Families | Single-Parent Households |
| No Children | 0 (0.0%) | 0 (0.0%) |
| 1 or 2 Children | 0 (0.0%) | 0 (0.0%) |
| 3 or 4 Children | 0 (0.0%) | 0 (0.0%) |
| 5 or more Children | 0 (0.0%) | 0 (0.0%) |
| Total | 0 (0.0%) | 0 (0.0%) |
Race in Lake Tomahawk
The most populous races in Lake Tomahawk are White / Caucasian (637 | 82.0%), and Two or more Races (140 | 18.0%).
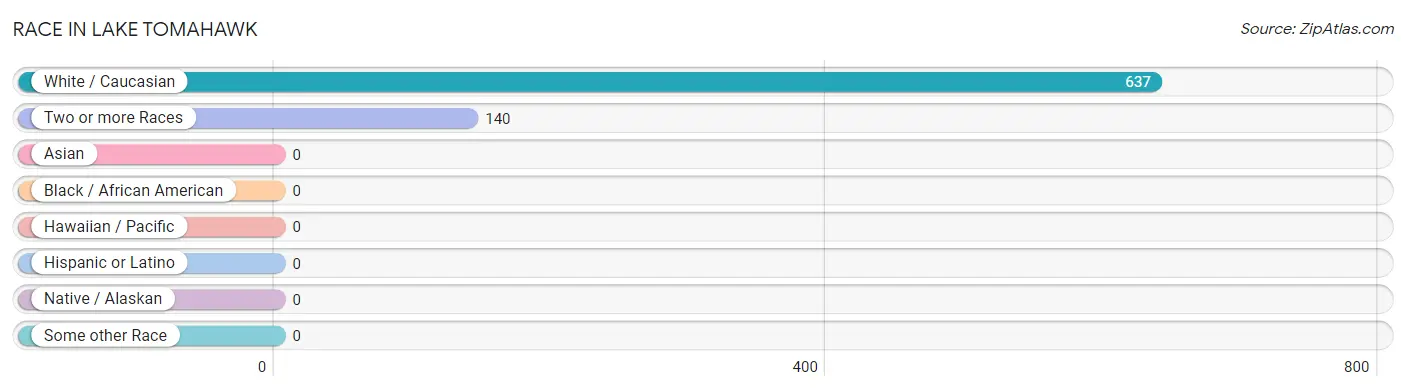
| Race | # Population | % Population |
| Asian | 0 | 0.0% |
| Black / African American | 0 | 0.0% |
| Hawaiian / Pacific | 0 | 0.0% |
| Hispanic or Latino | 0 | 0.0% |
| Native / Alaskan | 0 | 0.0% |
| White / Caucasian | 637 | 82.0% |
| Two or more Races | 140 | 18.0% |
| Some other Race | 0 | 0.0% |
| Total | 777 | 100.0% |
Ancestry in Lake Tomahawk
The most populous ancestries reported in Lake Tomahawk are German (275 | 35.4%), Italian (154 | 19.8%), English (153 | 19.7%), Scottish (116 | 14.9%), and Hungarian (56 | 7.2%), together accounting for 97.0% of all Lake Tomahawk residents.
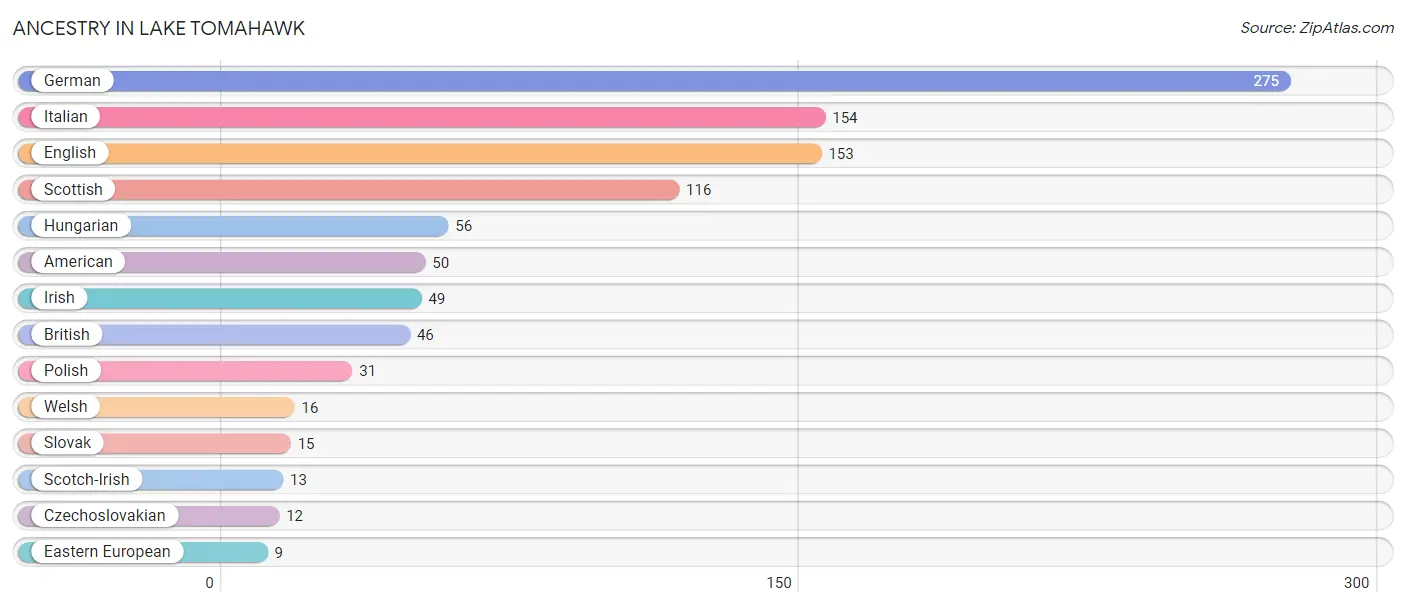
| Ancestry | # Population | % Population |
| American | 50 | 6.4% |
| British | 46 | 5.9% |
| Czechoslovakian | 12 | 1.5% |
| Eastern European | 9 | 1.2% |
| English | 153 | 19.7% |
| German | 275 | 35.4% |
| Hungarian | 56 | 7.2% |
| Irish | 49 | 6.3% |
| Italian | 154 | 19.8% |
| Polish | 31 | 4.0% |
| Scotch-Irish | 13 | 1.7% |
| Scottish | 116 | 14.9% |
| Slovak | 15 | 1.9% |
| Welsh | 16 | 2.1% | View All 14 Rows |
Immigrants in Lake Tomahawk

| Immigration Origin | # Population | % Population | View All 0 Rows |
Sex and Age in Lake Tomahawk
Sex and Age in Lake Tomahawk
The most populous age groups in Lake Tomahawk are 50 to 54 Years (99 | 24.0%) for men and 15 to 19 Years (91 | 24.9%) for women.
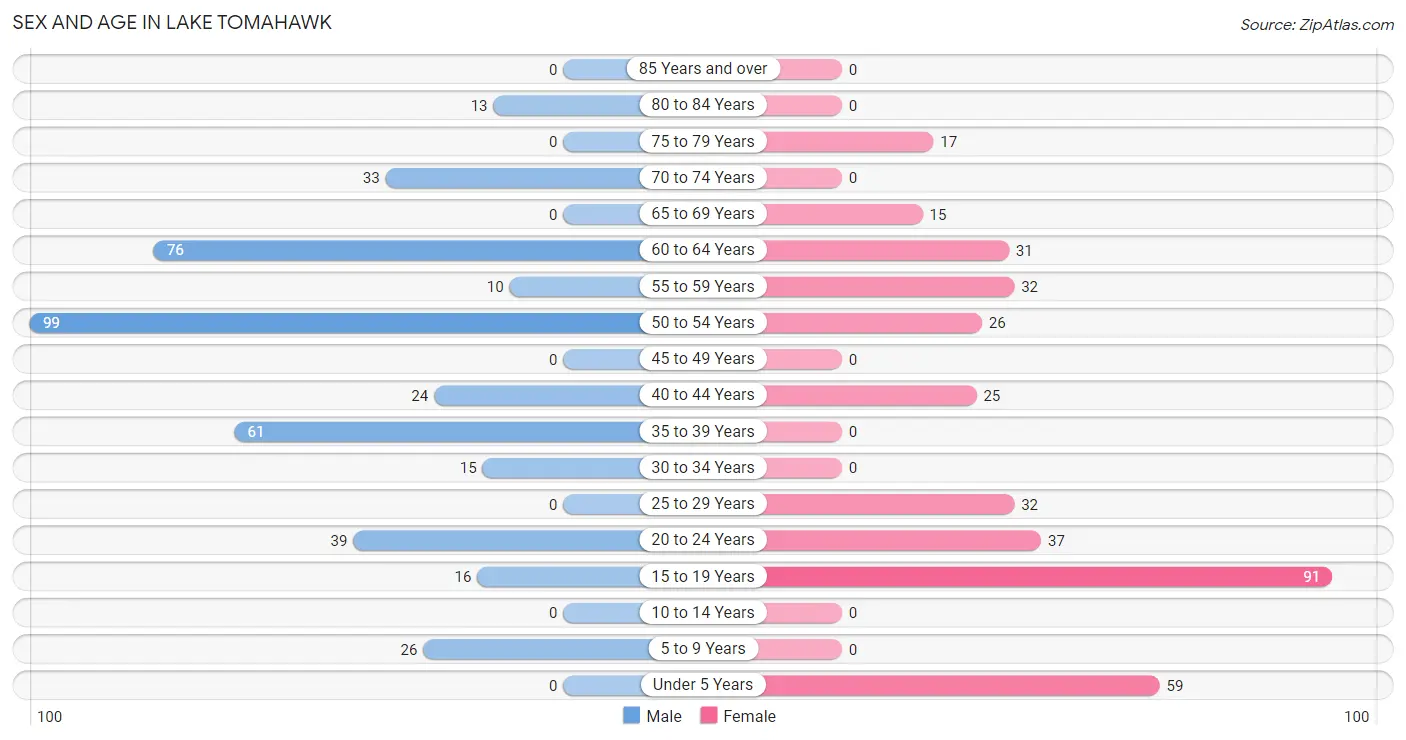
| Age Bracket | Male | Female |
| Under 5 Years | 0 (0.0%) | 59 (16.2%) |
| 5 to 9 Years | 26 (6.3%) | 0 (0.0%) |
| 10 to 14 Years | 0 (0.0%) | 0 (0.0%) |
| 15 to 19 Years | 16 (3.9%) | 91 (24.9%) |
| 20 to 24 Years | 39 (9.5%) | 37 (10.1%) |
| 25 to 29 Years | 0 (0.0%) | 32 (8.8%) |
| 30 to 34 Years | 15 (3.6%) | 0 (0.0%) |
| 35 to 39 Years | 61 (14.8%) | 0 (0.0%) |
| 40 to 44 Years | 24 (5.8%) | 25 (6.9%) |
| 45 to 49 Years | 0 (0.0%) | 0 (0.0%) |
| 50 to 54 Years | 99 (24.0%) | 26 (7.1%) |
| 55 to 59 Years | 10 (2.4%) | 32 (8.8%) |
| 60 to 64 Years | 76 (18.4%) | 31 (8.5%) |
| 65 to 69 Years | 0 (0.0%) | 15 (4.1%) |
| 70 to 74 Years | 33 (8.0%) | 0 (0.0%) |
| 75 to 79 Years | 0 (0.0%) | 17 (4.7%) |
| 80 to 84 Years | 13 (3.2%) | 0 (0.0%) |
| 85 Years and over | 0 (0.0%) | 0 (0.0%) |
| Total | 412 (100.0%) | 365 (100.0%) |
Families and Households in Lake Tomahawk
Median Family Size in Lake Tomahawk
The median family size in Lake Tomahawk is 2.69 persons per family, with single female/mother families (12 | 4.7%) accounting for the largest median family size of 3 persons per family. On the other hand, single male/father families (61 | 23.8%) represent the smallest median family size with 1.80 persons per family.
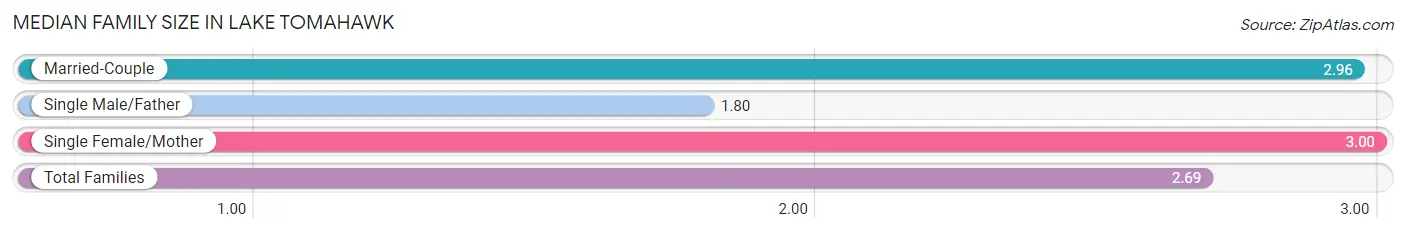
| Family Type | # Families | Family Size |
| Married-Couple | 183 (71.5%) | 2.96 |
| Single Male/Father | 61 (23.8%) | 1.80 |
| Single Female/Mother | 12 (4.7%) | 3.00 |
| Total Families | 256 (100.0%) | 2.69 |
Median Household Size in Lake Tomahawk
The median household size in Lake Tomahawk is 2.39 persons per household, with single female/mother households (12 | 3.7%) accounting for the largest median household size of 3 persons per household. non-family households (69 | 21.2%) represent the smallest median household size with 1.29 persons per household.
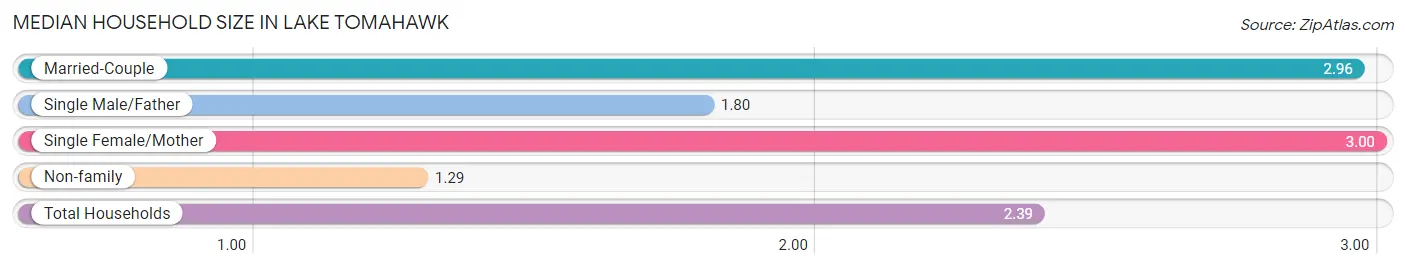
| Household Type | # Households | Household Size |
| Married-Couple | 183 (56.3%) | 2.96 |
| Single Male/Father | 61 (18.8%) | 1.80 |
| Single Female/Mother | 12 (3.7%) | 3.00 |
| Non-family | 69 (21.2%) | 1.29 |
| Total Households | 325 (100.0%) | 2.39 |
Household Size by Marriage Status in Lake Tomahawk
Out of a total of 325 households in Lake Tomahawk, 256 (78.8%) are family households, while 69 (21.2%) are nonfamily households. The most numerous type of family households are 2-person households, comprising 129, and the most common type of nonfamily households are 1-person households, comprising 50.
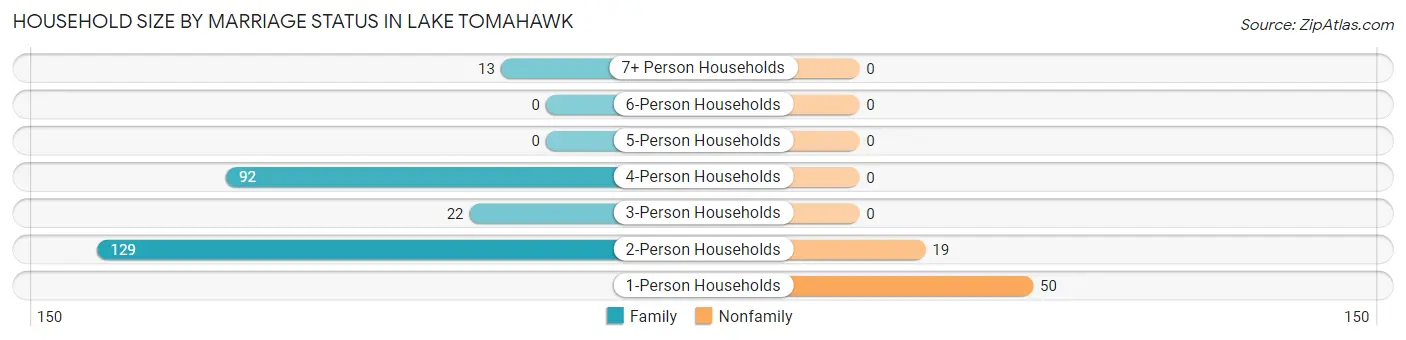
| Household Size | Family Households | Nonfamily Households |
| 1-Person Households | - | 50 (15.4%) |
| 2-Person Households | 129 (39.7%) | 19 (5.9%) |
| 3-Person Households | 22 (6.8%) | 0 (0.0%) |
| 4-Person Households | 92 (28.3%) | 0 (0.0%) |
| 5-Person Households | 0 (0.0%) | 0 (0.0%) |
| 6-Person Households | 0 (0.0%) | 0 (0.0%) |
| 7+ Person Households | 13 (4.0%) | 0 (0.0%) |
| Total | 256 (78.8%) | 69 (21.2%) |
Female Fertility in Lake Tomahawk
Fertility by Age in Lake Tomahawk
| Age Bracket | Women with Births | Births / 1,000 Women |
| 15 to 19 years | 0 (0.0%) | 0.0 |
| 20 to 34 years | 0 (0.0%) | 0.0 |
| 35 to 50 years | 0 (0.0%) | 0.0 |
| Total | 0 (0.0%) | 0.0 |
Fertility by Age by Marriage Status in Lake Tomahawk
| Age Bracket | Married | Unmarried |
| 15 to 19 years | 0 (0.0%) | 0 (0.0%) |
| 20 to 34 years | 0 (0.0%) | 0 (0.0%) |
| 35 to 50 years | 0 (0.0%) | 0 (0.0%) |
| Total | 0 (0.0%) | 0 (0.0%) |
Fertility by Education in Lake Tomahawk
| Educational Attainment | Women with Births | Births / 1,000 Women |
| Less than High School | 0 (0.0%) | 0.0 |
| High School Diploma | 0 (0.0%) | 0.0 |
| College or Associate's Degree | 0 (0.0%) | 0.0 |
| Bachelor's Degree | 0 (0.0%) | 0.0 |
| Graduate Degree | 0 (0.0%) | 0.0 |
| Total | 0 (0.0%) | 0.0 |
Fertility by Education by Marriage Status in Lake Tomahawk
| Educational Attainment | Married | Unmarried |
| Less than High School | 0 (0.0%) | 0 (0.0%) |
| High School Diploma | 0 (0.0%) | 0 (0.0%) |
| College or Associate's Degree | 0 (0.0%) | 0 (0.0%) |
| Bachelor's Degree | 0 (0.0%) | 0 (0.0%) |
| Graduate Degree | 0 (0.0%) | 0 (0.0%) |
| Total | 0 (0.0%) | 0 (0.0%) |
Employment Characteristics in Lake Tomahawk
Employment by Class of Employer in Lake Tomahawk
Among the 455 employed individuals in Lake Tomahawk, private company employees (173 | 38.0%), not-for-profit organizations (110 | 24.2%), and self-employed (incorporated) (61 | 13.4%) make up the most common classes of employment.
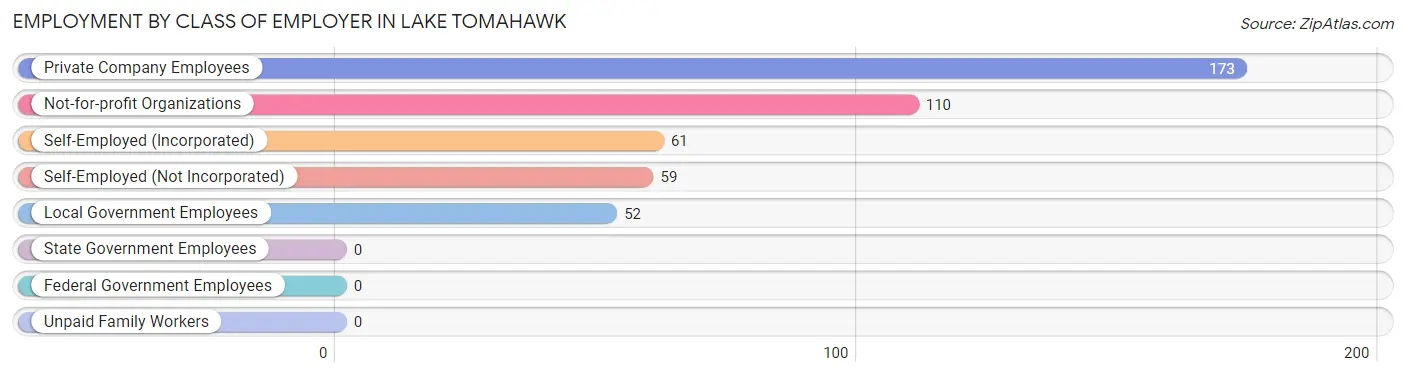
| Employer Class | # Employees | % Employees |
| Private Company Employees | 173 | 38.0% |
| Self-Employed (Incorporated) | 61 | 13.4% |
| Self-Employed (Not Incorporated) | 59 | 13.0% |
| Not-for-profit Organizations | 110 | 24.2% |
| Local Government Employees | 52 | 11.4% |
| State Government Employees | 0 | 0.0% |
| Federal Government Employees | 0 | 0.0% |
| Unpaid Family Workers | 0 | 0.0% |
| Total | 455 | 100.0% |
Employment Status by Age in Lake Tomahawk
According to the labor force statistics for Lake Tomahawk, out of the total population over 16 years of age (692), 72.3% or 500 individuals are in the labor force, with 9.0% or 45 of them unemployed. The age group with the highest labor force participation rate is 25 to 29 years, with 100.0% or 32 individuals in the labor force. Within the labor force, the 55 to 59 years age range has the highest percentage of unemployed individuals, with 66.7% or 20 of them being unemployed.
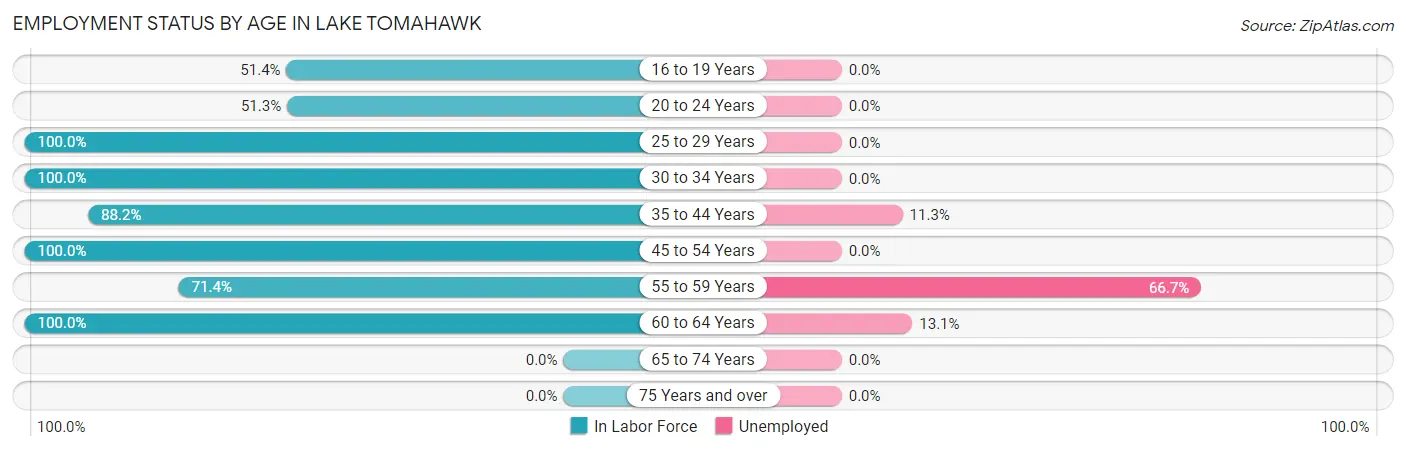
| Age Bracket | In Labor Force | Unemployed |
| 16 to 19 Years | 55 (51.4%) | 0 (0.0%) |
| 20 to 24 Years | 39 (51.3%) | 0 (0.0%) |
| 25 to 29 Years | 32 (100.0%) | 0 (0.0%) |
| 30 to 34 Years | 15 (100.0%) | 0 (0.0%) |
| 35 to 44 Years | 97 (88.2%) | 11 (11.3%) |
| 45 to 54 Years | 125 (100.0%) | 0 (0.0%) |
| 55 to 59 Years | 30 (71.4%) | 20 (66.7%) |
| 60 to 64 Years | 107 (100.0%) | 14 (13.1%) |
| 65 to 74 Years | 0 (0.0%) | 0 (0.0%) |
| 75 Years and over | 0 (0.0%) | 0 (0.0%) |
| Total | 500 (72.3%) | 45 (9.0%) |
Employment Status by Educational Attainment in Lake Tomahawk
According to labor force statistics for Lake Tomahawk, 94.2% of individuals (406) out of the total population between 25 and 64 years of age (431) are in the labor force, with 11.1% or 45 of them being unemployed. The group with the highest labor force participation rate are those with the educational attainment of high school diploma, with 100.0% or 97 individuals in the labor force. Within the labor force, individuals with high school diploma education have the highest percentage of unemployment, with 20.6% or 20 of them being unemployed.
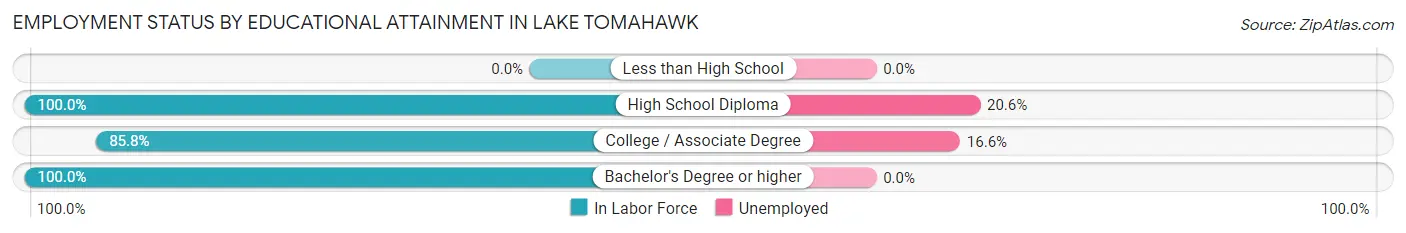
| Educational Attainment | In Labor Force | Unemployed |
| Less than High School | 0 (0.0%) | 0 (0.0%) |
| High School Diploma | 97 (100.0%) | 20 (20.6%) |
| College / Associate Degree | 151 (85.8%) | 29 (16.6%) |
| Bachelor's Degree or higher | 158 (100.0%) | 0 (0.0%) |
| Total | 406 (94.2%) | 48 (11.1%) |
Employment Occupations by Sex in Lake Tomahawk
Management, Business, Science and Arts Occupations
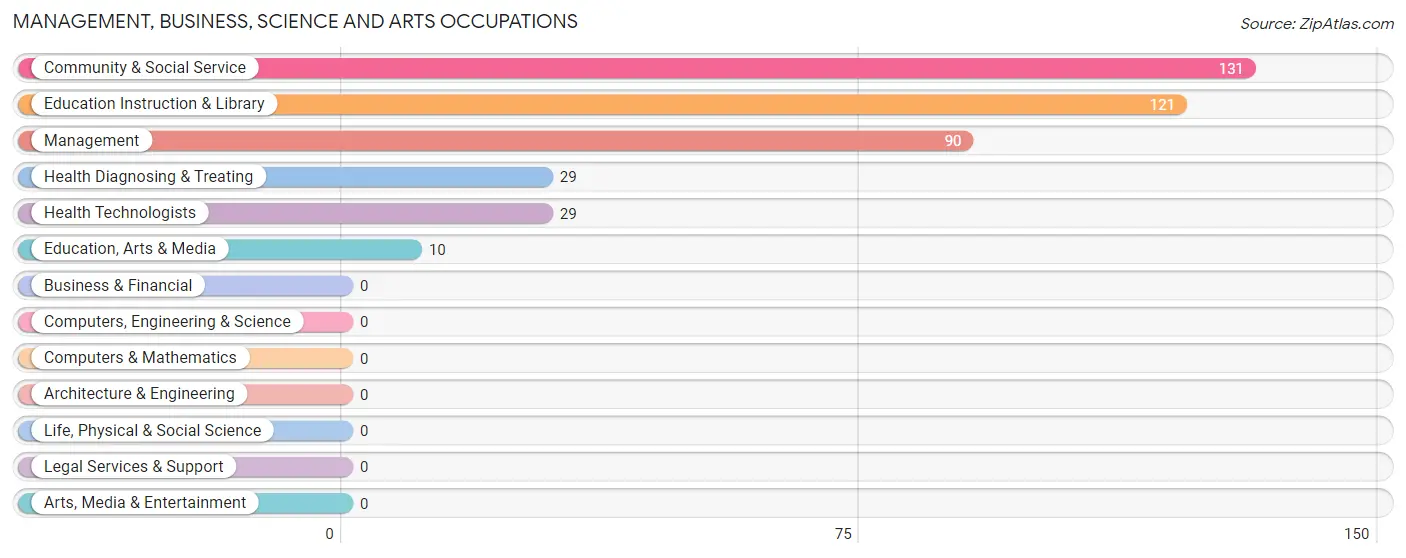
The most common Management, Business, Science and Arts occupations in Lake Tomahawk are Community & Social Service (131 | 28.8%), Education Instruction & Library (121 | 26.6%), Management (90 | 19.8%), Health Diagnosing & Treating (29 | 6.4%), and Health Technologists (29 | 6.4%).
Management, Business, Science and Arts Occupations by Sex
Within the Management, Business, Science and Arts occupations in Lake Tomahawk, the most male-oriented occupations are Management (100.0%), Education, Arts & Media (100.0%), and Community & Social Service (61.1%), while the most female-oriented occupations are Education Instruction & Library (42.1%), Health Diagnosing & Treating (41.4%), and Health Technologists (41.4%).
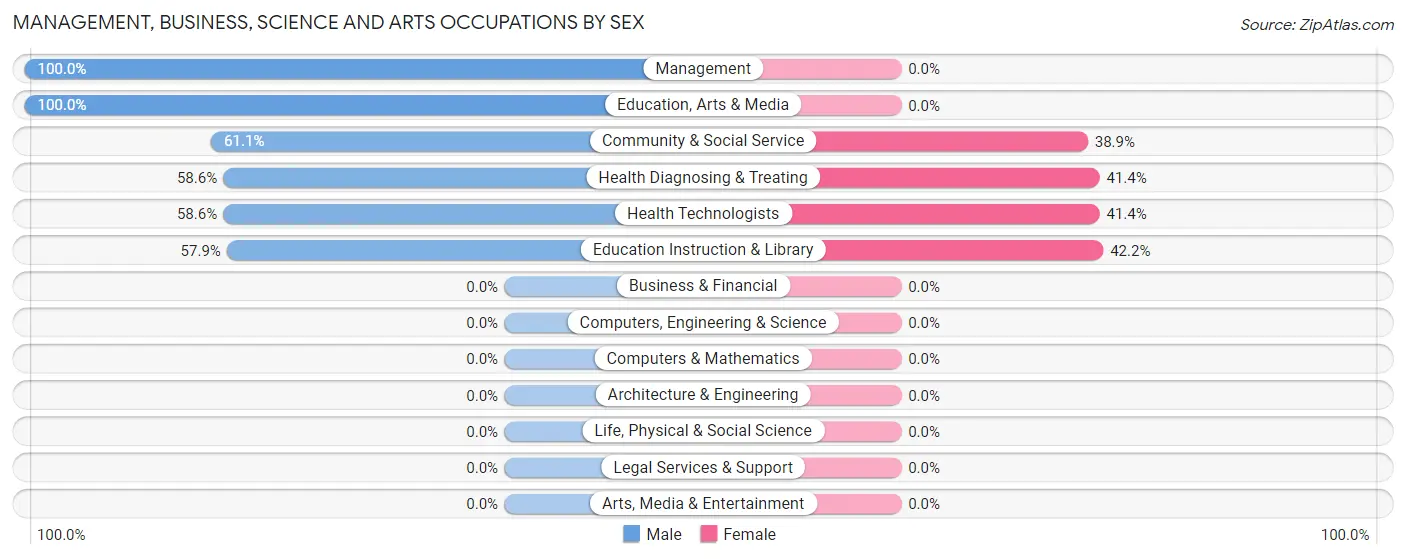
| Occupation | Male | Female |
| Management | 90 (100.0%) | 0 (0.0%) |
| Business & Financial | 0 (0.0%) | 0 (0.0%) |
| Computers, Engineering & Science | 0 (0.0%) | 0 (0.0%) |
| Computers & Mathematics | 0 (0.0%) | 0 (0.0%) |
| Architecture & Engineering | 0 (0.0%) | 0 (0.0%) |
| Life, Physical & Social Science | 0 (0.0%) | 0 (0.0%) |
| Community & Social Service | 80 (61.1%) | 51 (38.9%) |
| Education, Arts & Media | 10 (100.0%) | 0 (0.0%) |
| Legal Services & Support | 0 (0.0%) | 0 (0.0%) |
| Education Instruction & Library | 70 (57.9%) | 51 (42.1%) |
| Arts, Media & Entertainment | 0 (0.0%) | 0 (0.0%) |
| Health Diagnosing & Treating | 17 (58.6%) | 12 (41.4%) |
| Health Technologists | 17 (58.6%) | 12 (41.4%) |
| Total (Category) | 187 (74.8%) | 63 (25.2%) |
| Total (Overall) | 313 (68.8%) | 142 (31.2%) |
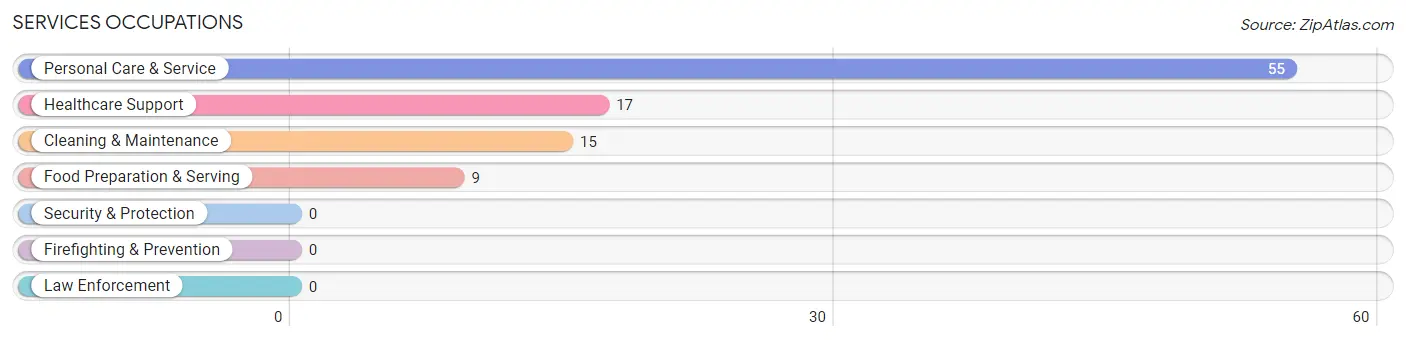
Services Occupations
The most common Services occupations in Lake Tomahawk are Personal Care & Service (55 | 12.1%), Healthcare Support (17 | 3.7%), Cleaning & Maintenance (15 | 3.3%), and Food Preparation & Serving (9 | 2.0%).
Services Occupations by Sex
Within the Services occupations in Lake Tomahawk, the most male-oriented occupations are Cleaning & Maintenance (100.0%), and Personal Care & Service (16.4%), while the most female-oriented occupations are Healthcare Support (100.0%), Food Preparation & Serving (100.0%), and Personal Care & Service (83.6%).
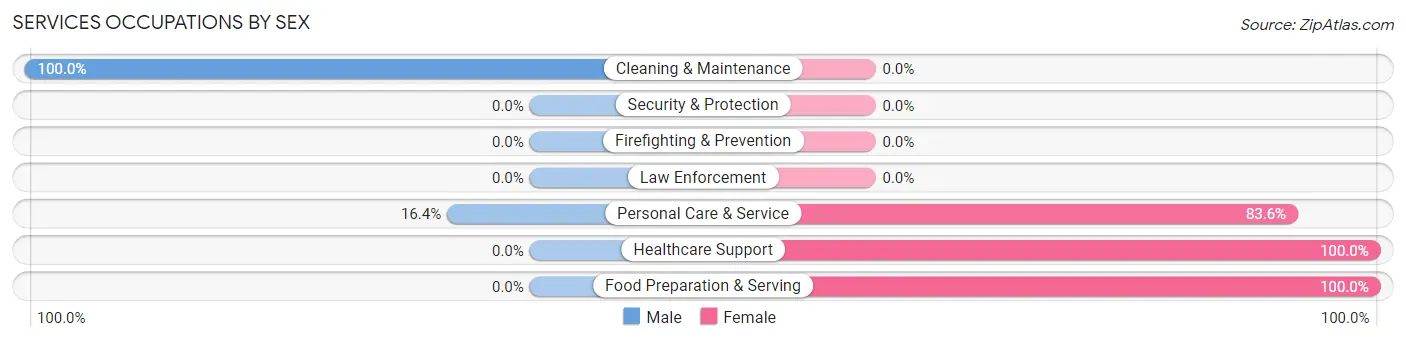
| Occupation | Male | Female |
| Healthcare Support | 0 (0.0%) | 17 (100.0%) |
| Security & Protection | 0 (0.0%) | 0 (0.0%) |
| Firefighting & Prevention | 0 (0.0%) | 0 (0.0%) |
| Law Enforcement | 0 (0.0%) | 0 (0.0%) |
| Food Preparation & Serving | 0 (0.0%) | 9 (100.0%) |
| Cleaning & Maintenance | 15 (100.0%) | 0 (0.0%) |
| Personal Care & Service | 9 (16.4%) | 46 (83.6%) |
| Total (Category) | 24 (25.0%) | 72 (75.0%) |
| Total (Overall) | 313 (68.8%) | 142 (31.2%) |
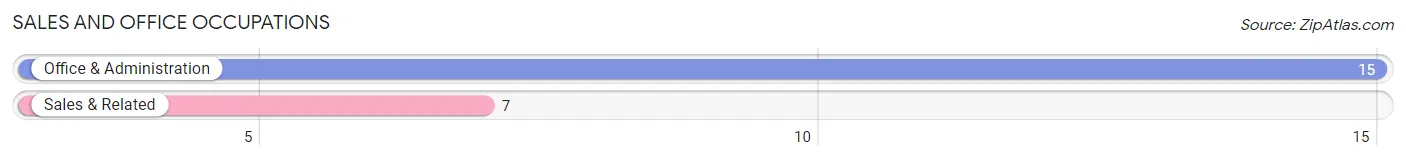
Sales and Office Occupations
The most common Sales and Office occupations in Lake Tomahawk are Office & Administration (15 | 3.3%), and Sales & Related (7 | 1.5%).
Sales and Office Occupations by Sex
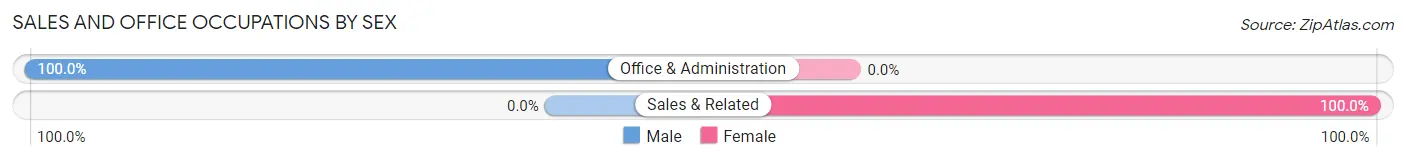
| Occupation | Male | Female |
| Sales & Related | 0 (0.0%) | 7 (100.0%) |
| Office & Administration | 15 (100.0%) | 0 (0.0%) |
| Total (Category) | 15 (68.2%) | 7 (31.8%) |
| Total (Overall) | 313 (68.8%) | 142 (31.2%) |
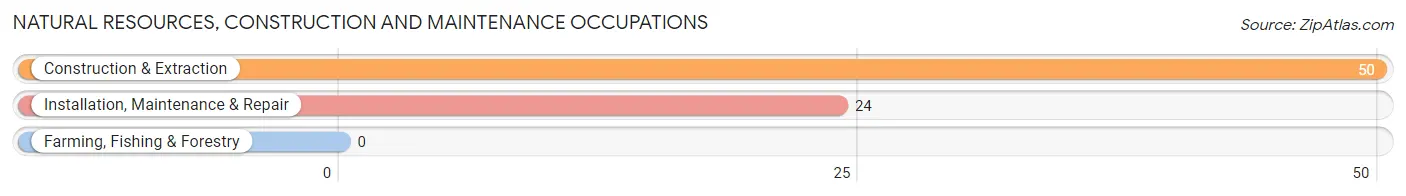
Natural Resources, Construction and Maintenance Occupations
The most common Natural Resources, Construction and Maintenance occupations in Lake Tomahawk are Construction & Extraction (50 | 11.0%), and Installation, Maintenance & Repair (24 | 5.3%).
Natural Resources, Construction and Maintenance Occupations by Sex
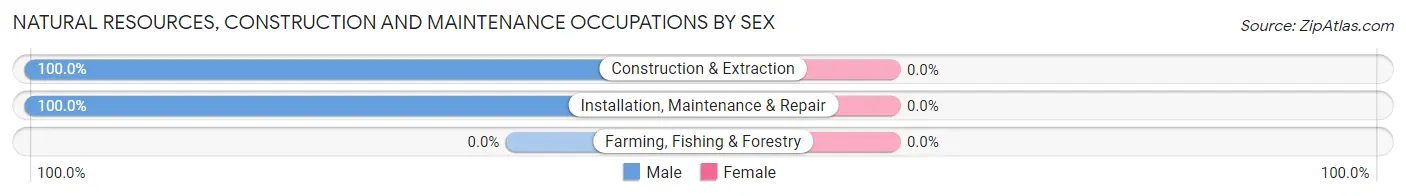
| Occupation | Male | Female |
| Farming, Fishing & Forestry | 0 (0.0%) | 0 (0.0%) |
| Construction & Extraction | 50 (100.0%) | 0 (0.0%) |
| Installation, Maintenance & Repair | 24 (100.0%) | 0 (0.0%) |
| Total (Category) | 74 (100.0%) | 0 (0.0%) |
| Total (Overall) | 313 (68.8%) | 142 (31.2%) |
Production, Transportation and Moving Occupations
The most common Production, Transportation and Moving occupations in Lake Tomahawk are , and Production (13 | 2.9%).
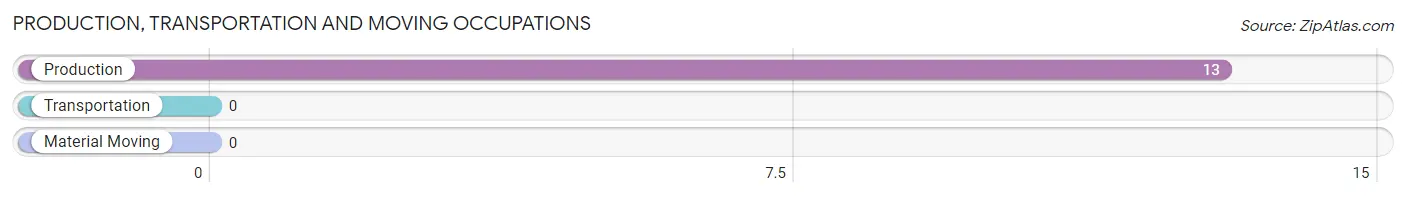
Production, Transportation and Moving Occupations by Sex
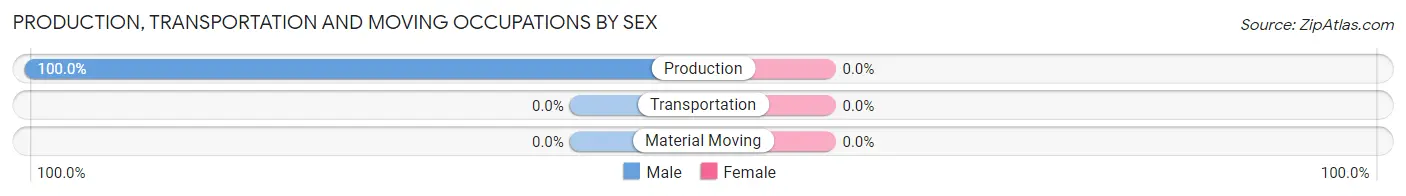
| Occupation | Male | Female |
| Production | 13 (100.0%) | 0 (0.0%) |
| Transportation | 0 (0.0%) | 0 (0.0%) |
| Material Moving | 0 (0.0%) | 0 (0.0%) |
| Total (Category) | 13 (100.0%) | 0 (0.0%) |
| Total (Overall) | 313 (68.8%) | 142 (31.2%) |
Employment Industries by Sex in Lake Tomahawk
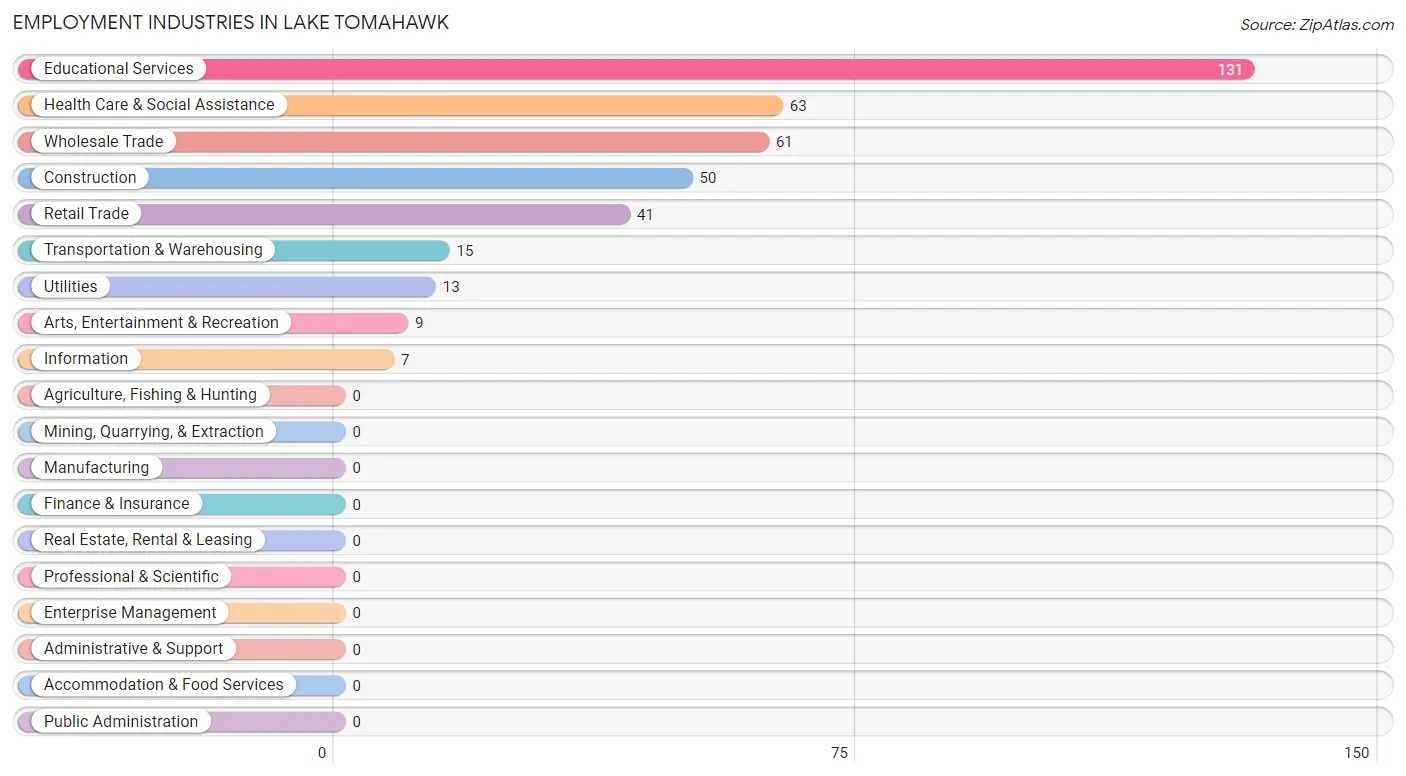
Employment Industries in Lake Tomahawk
The major employment industries in Lake Tomahawk include Educational Services (131 | 28.8%), Health Care & Social Assistance (63 | 13.9%), Wholesale Trade (61 | 13.4%), Construction (50 | 11.0%), and Retail Trade (41 | 9.0%).
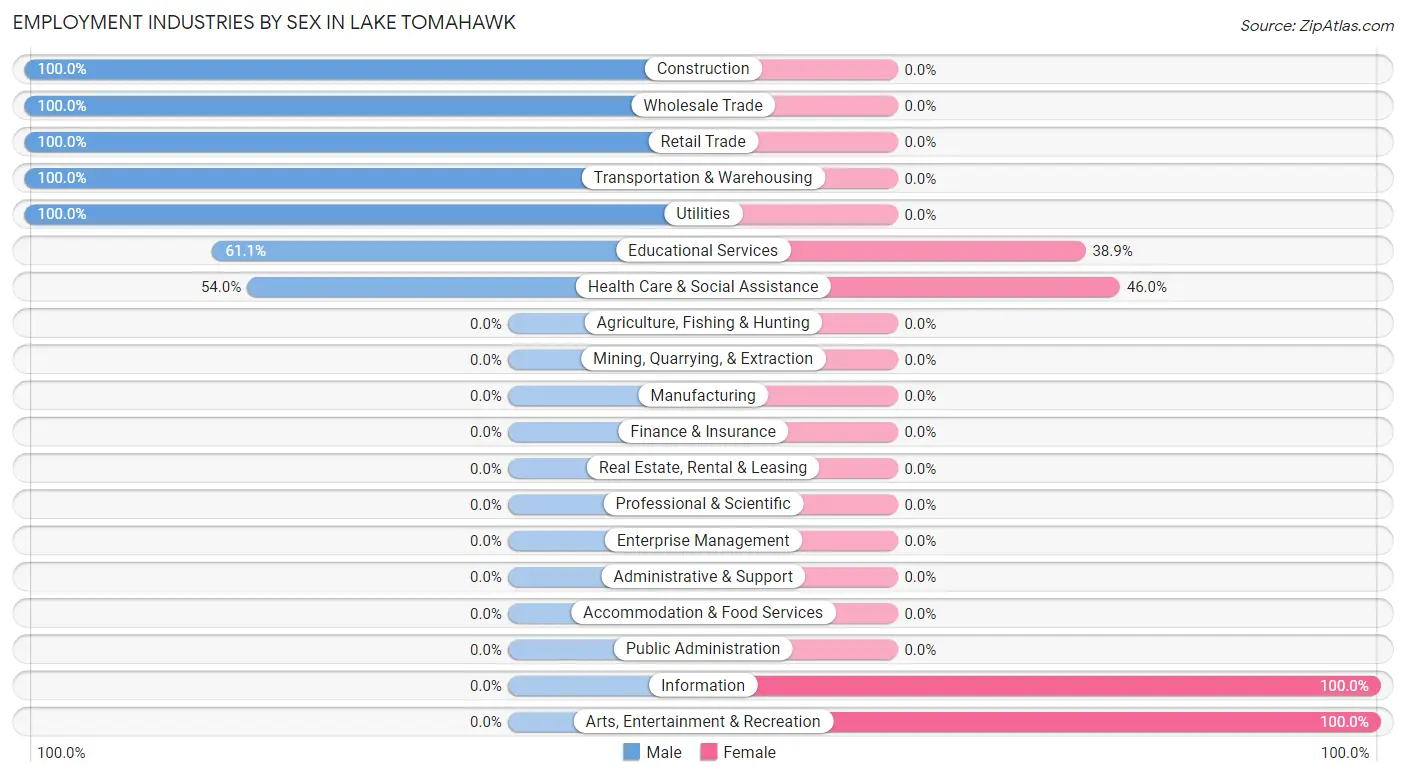
Employment Industries by Sex in Lake Tomahawk
The Lake Tomahawk industries that see more men than women are Construction (100.0%), Wholesale Trade (100.0%), and Retail Trade (100.0%), whereas the industries that tend to have a higher number of women are Information (100.0%), Arts, Entertainment & Recreation (100.0%), and Health Care & Social Assistance (46.0%).
| Industry | Male | Female |
| Agriculture, Fishing & Hunting | 0 (0.0%) | 0 (0.0%) |
| Mining, Quarrying, & Extraction | 0 (0.0%) | 0 (0.0%) |
| Construction | 50 (100.0%) | 0 (0.0%) |
| Manufacturing | 0 (0.0%) | 0 (0.0%) |
| Wholesale Trade | 61 (100.0%) | 0 (0.0%) |
| Retail Trade | 41 (100.0%) | 0 (0.0%) |
| Transportation & Warehousing | 15 (100.0%) | 0 (0.0%) |
| Utilities | 13 (100.0%) | 0 (0.0%) |
| Information | 0 (0.0%) | 7 (100.0%) |
| Finance & Insurance | 0 (0.0%) | 0 (0.0%) |
| Real Estate, Rental & Leasing | 0 (0.0%) | 0 (0.0%) |
| Professional & Scientific | 0 (0.0%) | 0 (0.0%) |
| Enterprise Management | 0 (0.0%) | 0 (0.0%) |
| Administrative & Support | 0 (0.0%) | 0 (0.0%) |
| Educational Services | 80 (61.1%) | 51 (38.9%) |
| Health Care & Social Assistance | 34 (54.0%) | 29 (46.0%) |
| Arts, Entertainment & Recreation | 0 (0.0%) | 9 (100.0%) |
| Accommodation & Food Services | 0 (0.0%) | 0 (0.0%) |
| Public Administration | 0 (0.0%) | 0 (0.0%) |
| Total | 313 (68.8%) | 142 (31.2%) |
Education in Lake Tomahawk
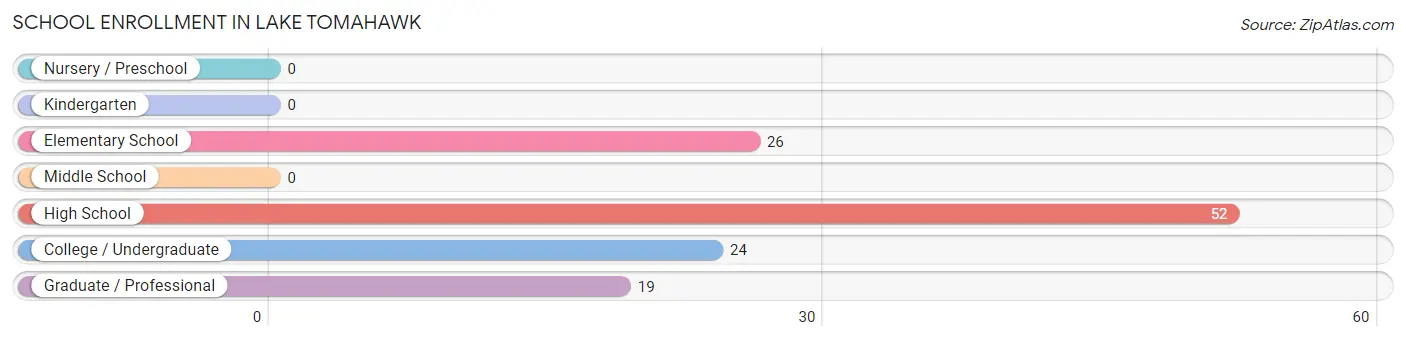
School Enrollment in Lake Tomahawk
The most common levels of schooling among the 121 students in Lake Tomahawk are high school (52 | 43.0%), elementary school (26 | 21.5%), and college / undergraduate (24 | 19.8%).
| School Level | # Students | % Students |
| Nursery / Preschool | 0 | 0.0% |
| Kindergarten | 0 | 0.0% |
| Elementary School | 26 | 21.5% |
| Middle School | 0 | 0.0% |
| High School | 52 | 43.0% |
| College / Undergraduate | 24 | 19.8% |
| Graduate / Professional | 19 | 15.7% |
| Total | 121 | 100.0% |
School Enrollment by Age by Funding Source in Lake Tomahawk
Out of a total of 121 students who are enrolled in schools in Lake Tomahawk, 50 (41.3%) attend a private institution, while the remaining 71 (58.7%) are enrolled in public schools. The age group of 18 to 19 year olds has the highest likelihood of being enrolled in private schools, with 9 (100.0% in the age bracket) enrolled. Conversely, the age group of 5 to 9 year old has the lowest likelihood of being enrolled in a private school, with 26 (100.0% in the age bracket) attending a public institution.
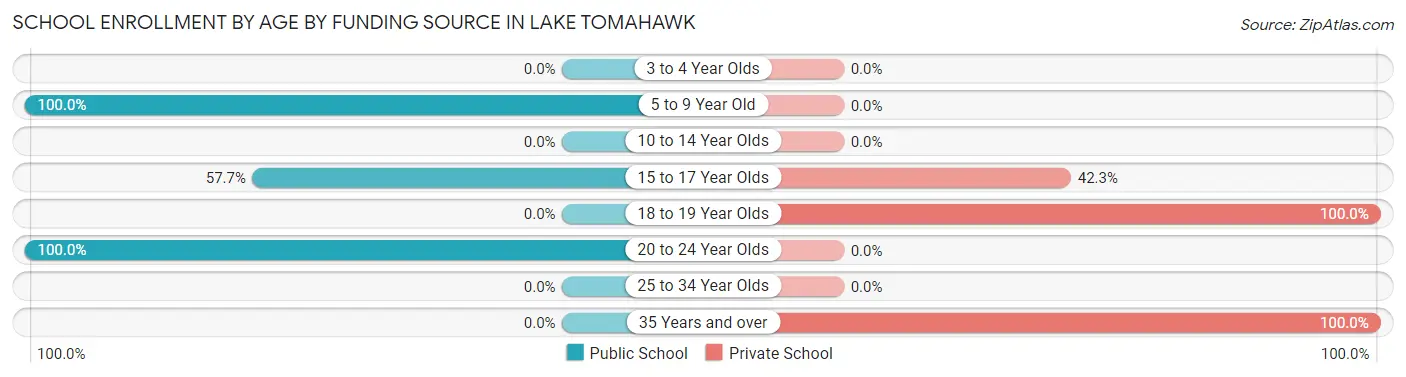
| Age Bracket | Public School | Private School |
| 3 to 4 Year Olds | 0 (0.0%) | 0 (0.0%) |
| 5 to 9 Year Old | 26 (100.0%) | 0 (0.0%) |
| 10 to 14 Year Olds | 0 (0.0%) | 0 (0.0%) |
| 15 to 17 Year Olds | 30 (57.7%) | 22 (42.3%) |
| 18 to 19 Year Olds | 0 (0.0%) | 9 (100.0%) |
| 20 to 24 Year Olds | 15 (100.0%) | 0 (0.0%) |
| 25 to 34 Year Olds | 0 (0.0%) | 0 (0.0%) |
| 35 Years and over | 0 (0.0%) | 19 (100.0%) |
| Total | 71 (58.7%) | 50 (41.3%) |
Educational Attainment by Field of Study in Lake Tomahawk
Education (93 | 37.0%), business (68 | 27.1%), social sciences (61 | 24.3%), and science & technology (29 | 11.6%) are the most common fields of study among 251 individuals in Lake Tomahawk who have obtained a bachelor's degree or higher.
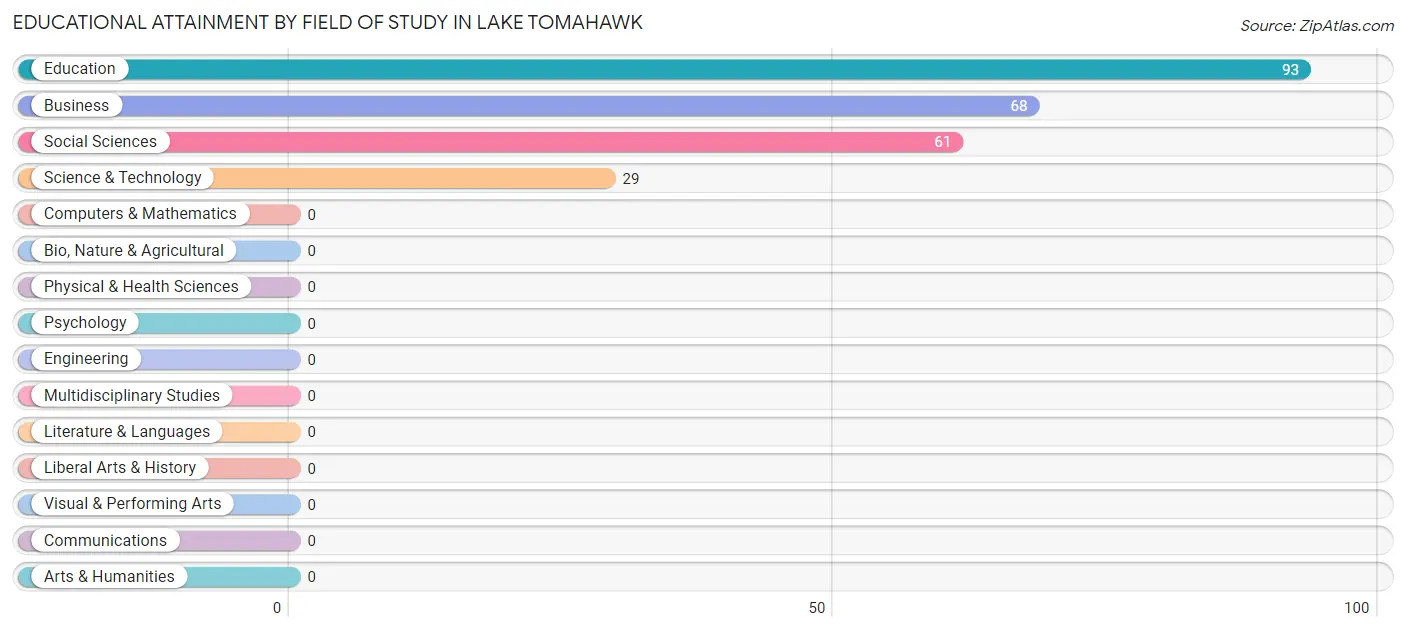
| Field of Study | # Graduates | % Graduates |
| Computers & Mathematics | 0 | 0.0% |
| Bio, Nature & Agricultural | 0 | 0.0% |
| Physical & Health Sciences | 0 | 0.0% |
| Psychology | 0 | 0.0% |
| Social Sciences | 61 | 24.3% |
| Engineering | 0 | 0.0% |
| Multidisciplinary Studies | 0 | 0.0% |
| Science & Technology | 29 | 11.6% |
| Business | 68 | 27.1% |
| Education | 93 | 37.0% |
| Literature & Languages | 0 | 0.0% |
| Liberal Arts & History | 0 | 0.0% |
| Visual & Performing Arts | 0 | 0.0% |
| Communications | 0 | 0.0% |
| Arts & Humanities | 0 | 0.0% |
| Total | 251 | 100.0% |
Transportation & Commute in Lake Tomahawk
Vehicle Availability by Sex in Lake Tomahawk
The most prevalent vehicle ownership categories in Lake Tomahawk are males with 5 or more vehicles (168, accounting for 53.7%) and females with 5 or more vehicles (78, making up 118.3%).
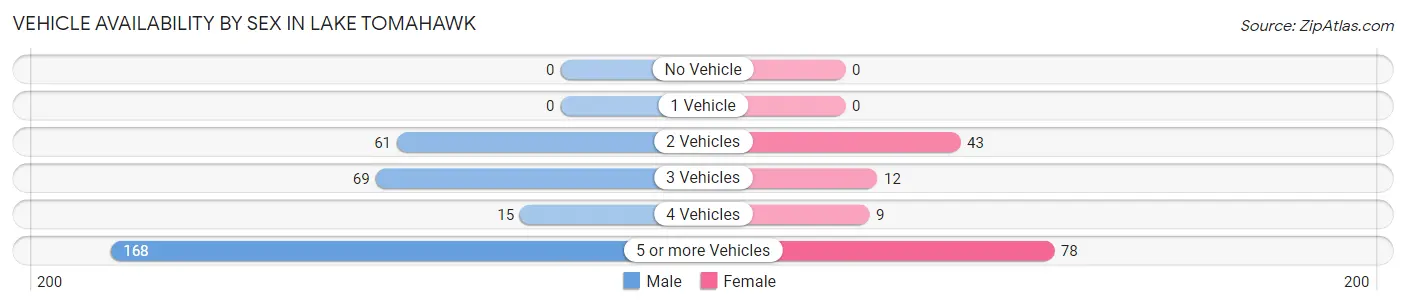
| Vehicles Available | Male | Female |
| No Vehicle | 0 (0.0%) | 0 (0.0%) |
| 1 Vehicle | 0 (0.0%) | 0 (0.0%) |
| 2 Vehicles | 61 (19.5%) | 43 (30.3%) |
| 3 Vehicles | 69 (22.0%) | 12 (8.5%) |
| 4 Vehicles | 15 (4.8%) | 9 (6.3%) |
| 5 or more Vehicles | 168 (53.7%) | 78 (54.9%) |
| Total | 313 (100.0%) | 142 (100.0%) |
Commute Time in Lake Tomahawk
The most frequently occuring commute durations in Lake Tomahawk are 45 to 59 minutes (109 commuters, 24.5%), 35 to 39 minutes (80 commuters, 18.0%), and 20 to 24 minutes (70 commuters, 15.7%).
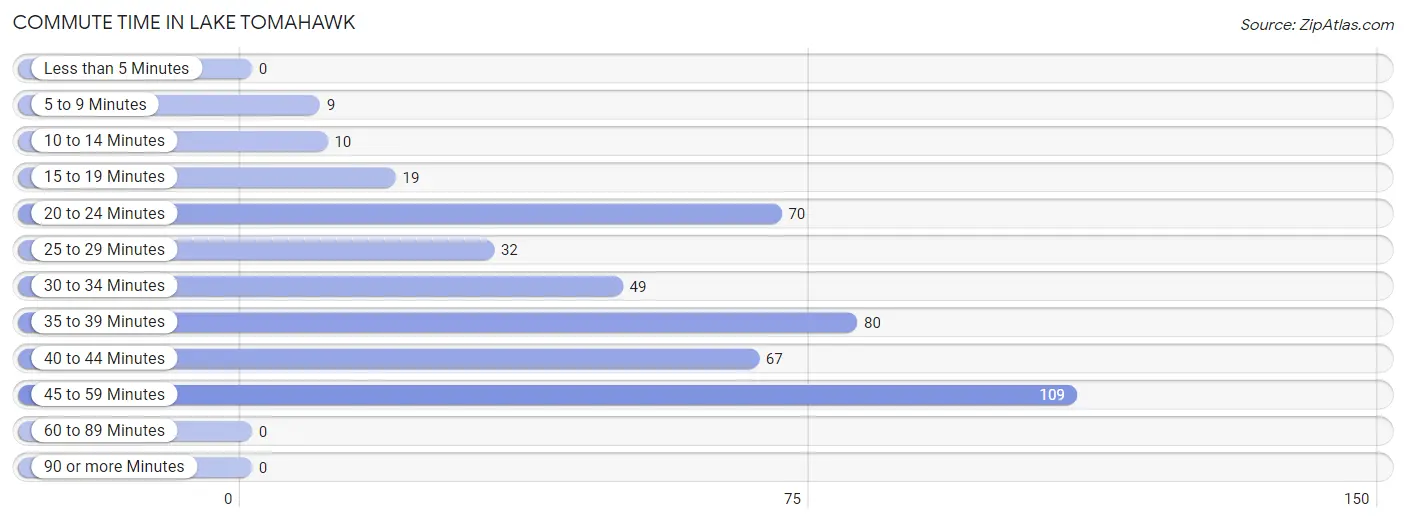
| Commute Time | # Commuters | % Commuters |
| Less than 5 Minutes | 0 | 0.0% |
| 5 to 9 Minutes | 9 | 2.0% |
| 10 to 14 Minutes | 10 | 2.2% |
| 15 to 19 Minutes | 19 | 4.3% |
| 20 to 24 Minutes | 70 | 15.7% |
| 25 to 29 Minutes | 32 | 7.2% |
| 30 to 34 Minutes | 49 | 11.0% |
| 35 to 39 Minutes | 80 | 18.0% |
| 40 to 44 Minutes | 67 | 15.1% |
| 45 to 59 Minutes | 109 | 24.5% |
| 60 to 89 Minutes | 0 | 0.0% |
| 90 or more Minutes | 0 | 0.0% |
Commute Time by Sex in Lake Tomahawk
The most common commute times in Lake Tomahawk are 45 to 59 minutes (70 commuters, 23.1%) for males and 35 to 39 minutes (46 commuters, 32.4%) for females.
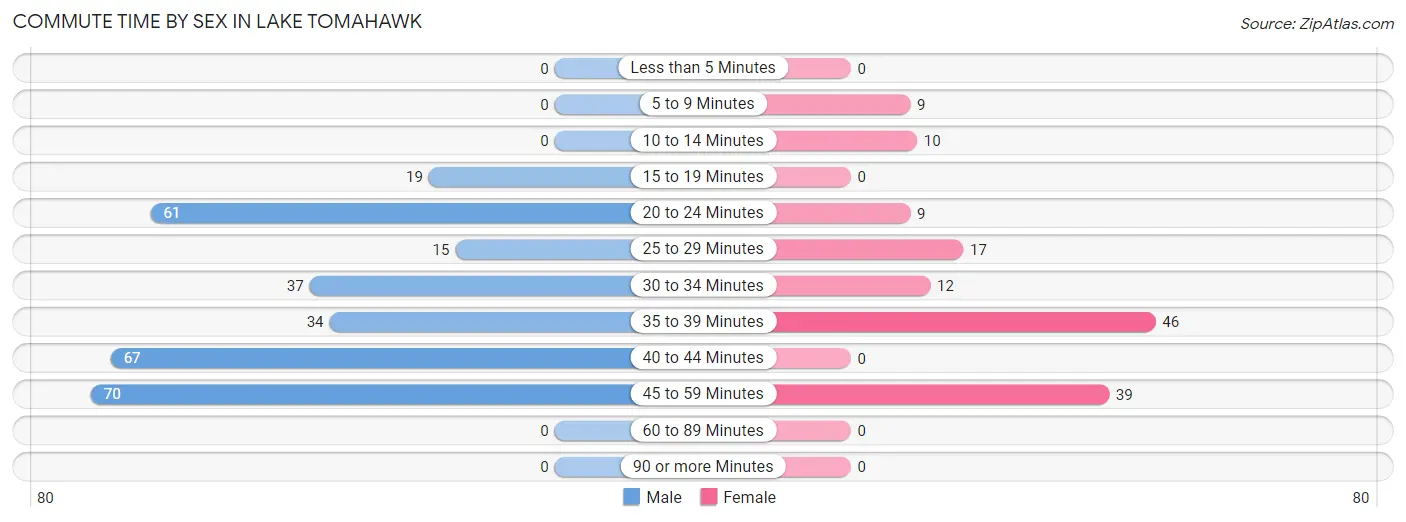
| Commute Time | Male | Female |
| Less than 5 Minutes | 0 (0.0%) | 0 (0.0%) |
| 5 to 9 Minutes | 0 (0.0%) | 9 (6.3%) |
| 10 to 14 Minutes | 0 (0.0%) | 10 (7.0%) |
| 15 to 19 Minutes | 19 (6.3%) | 0 (0.0%) |
| 20 to 24 Minutes | 61 (20.1%) | 9 (6.3%) |
| 25 to 29 Minutes | 15 (5.0%) | 17 (12.0%) |
| 30 to 34 Minutes | 37 (12.2%) | 12 (8.5%) |
| 35 to 39 Minutes | 34 (11.2%) | 46 (32.4%) |
| 40 to 44 Minutes | 67 (22.1%) | 0 (0.0%) |
| 45 to 59 Minutes | 70 (23.1%) | 39 (27.5%) |
| 60 to 89 Minutes | 0 (0.0%) | 0 (0.0%) |
| 90 or more Minutes | 0 (0.0%) | 0 (0.0%) |
Time of Departure to Work by Sex in Lake Tomahawk
The most frequent times of departure to work in Lake Tomahawk are 7:30 AM to 7:59 AM (153, 50.5%) for males and 6:30 AM to 6:59 AM (88, 62.0%) for females.
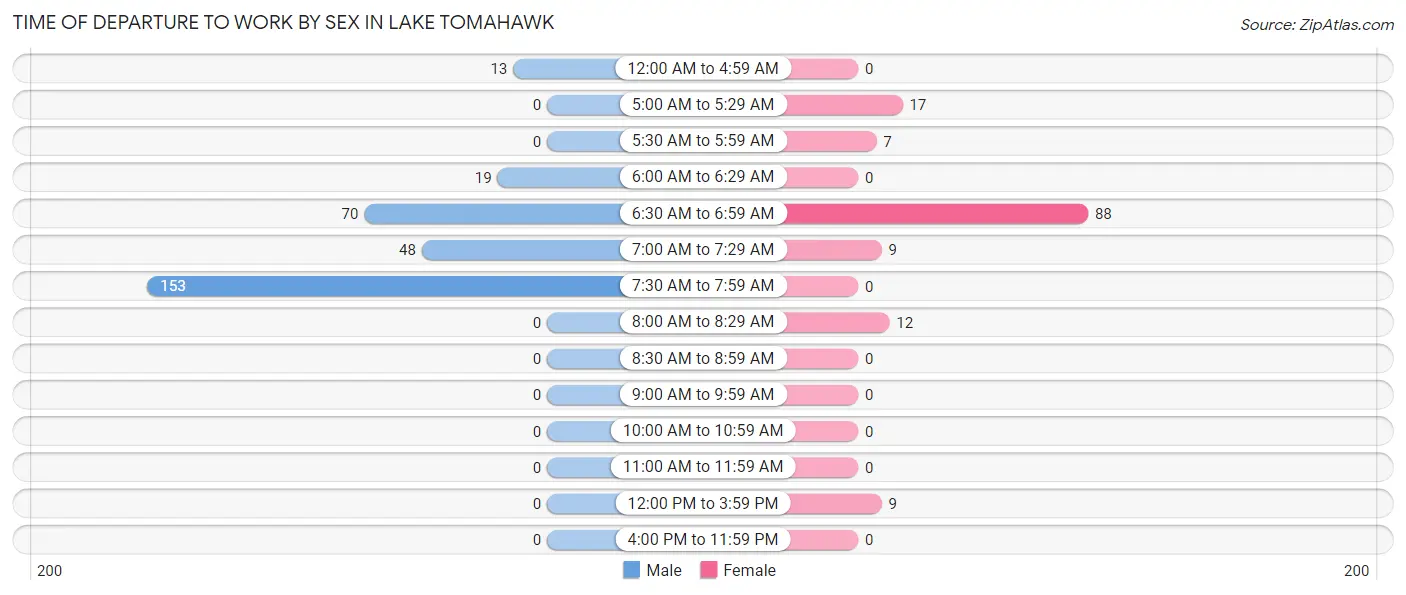
| Time of Departure | Male | Female |
| 12:00 AM to 4:59 AM | 13 (4.3%) | 0 (0.0%) |
| 5:00 AM to 5:29 AM | 0 (0.0%) | 17 (12.0%) |
| 5:30 AM to 5:59 AM | 0 (0.0%) | 7 (4.9%) |
| 6:00 AM to 6:29 AM | 19 (6.3%) | 0 (0.0%) |
| 6:30 AM to 6:59 AM | 70 (23.1%) | 88 (62.0%) |
| 7:00 AM to 7:29 AM | 48 (15.8%) | 9 (6.3%) |
| 7:30 AM to 7:59 AM | 153 (50.5%) | 0 (0.0%) |
| 8:00 AM to 8:29 AM | 0 (0.0%) | 12 (8.5%) |
| 8:30 AM to 8:59 AM | 0 (0.0%) | 0 (0.0%) |
| 9:00 AM to 9:59 AM | 0 (0.0%) | 0 (0.0%) |
| 10:00 AM to 10:59 AM | 0 (0.0%) | 0 (0.0%) |
| 11:00 AM to 11:59 AM | 0 (0.0%) | 0 (0.0%) |
| 12:00 PM to 3:59 PM | 0 (0.0%) | 9 (6.3%) |
| 4:00 PM to 11:59 PM | 0 (0.0%) | 0 (0.0%) |
| Total | 303 (100.0%) | 142 (100.0%) |
Housing Occupancy in Lake Tomahawk
Occupancy by Ownership in Lake Tomahawk
Of the total 325 dwellings in Lake Tomahawk, owner-occupied units account for 325 (100.0%), while renter-occupied units make up 0 (0.0%).
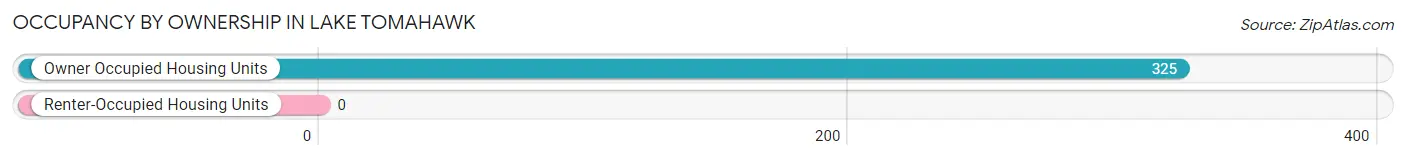
| Occupancy | # Housing Units | % Housing Units |
| Owner Occupied Housing Units | 325 | 100.0% |
| Renter-Occupied Housing Units | 0 | 0.0% |
| Total Occupied Housing Units | 325 | 100.0% |
Occupancy by Household Size in Lake Tomahawk
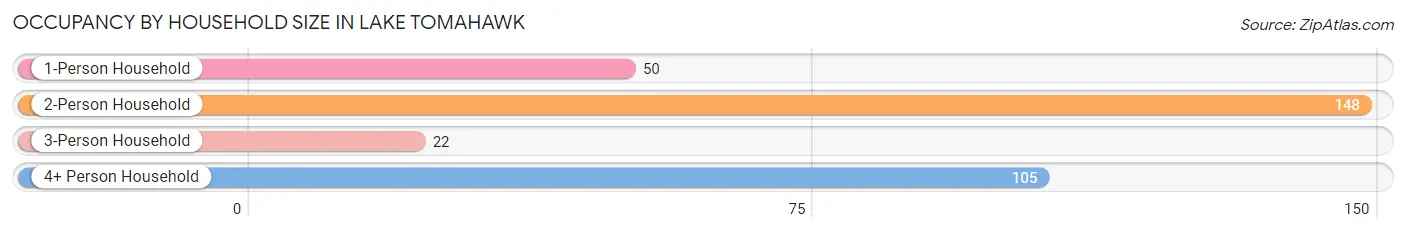
| Household Size | # Housing Units | % Housing Units |
| 1-Person Household | 50 | 15.4% |
| 2-Person Household | 148 | 45.5% |
| 3-Person Household | 22 | 6.8% |
| 4+ Person Household | 105 | 32.3% |
| Total Housing Units | 325 | 100.0% |
Occupancy by Ownership by Household Size in Lake Tomahawk
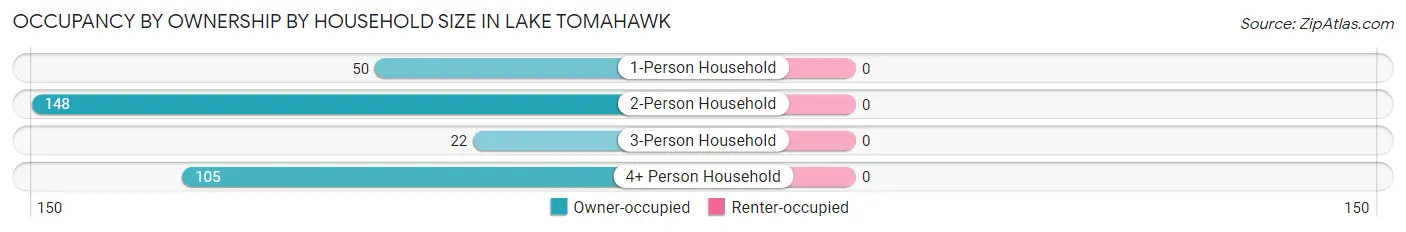
| Household Size | Owner-occupied | Renter-occupied |
| 1-Person Household | 50 (100.0%) | 0 (0.0%) |
| 2-Person Household | 148 (100.0%) | 0 (0.0%) |
| 3-Person Household | 22 (100.0%) | 0 (0.0%) |
| 4+ Person Household | 105 (100.0%) | 0 (0.0%) |
| Total Housing Units | 325 (100.0%) | 0 (0.0%) |
Occupancy by Educational Attainment in Lake Tomahawk
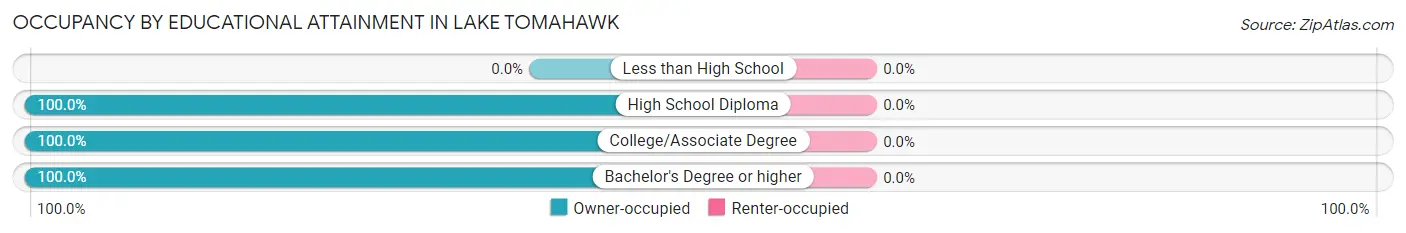
| Household Size | Owner-occupied | Renter-occupied |
| Less than High School | 0 (0.0%) | 0 (0.0%) |
| High School Diploma | 89 (100.0%) | 0 (0.0%) |
| College/Associate Degree | 114 (100.0%) | 0 (0.0%) |
| Bachelor's Degree or higher | 122 (100.0%) | 0 (0.0%) |
Occupancy by Age of Householder in Lake Tomahawk
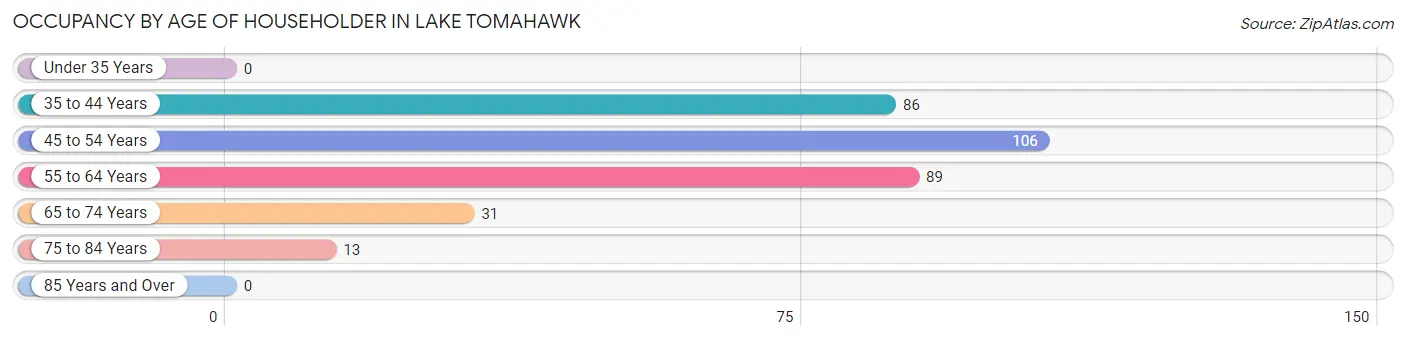
| Age Bracket | # Households | % Households |
| Under 35 Years | 0 | 0.0% |
| 35 to 44 Years | 86 | 26.5% |
| 45 to 54 Years | 106 | 32.6% |
| 55 to 64 Years | 89 | 27.4% |
| 65 to 74 Years | 31 | 9.5% |
| 75 to 84 Years | 13 | 4.0% |
| 85 Years and Over | 0 | 0.0% |
| Total | 325 | 100.0% |
Housing Finances in Lake Tomahawk
Median Income by Occupancy in Lake Tomahawk
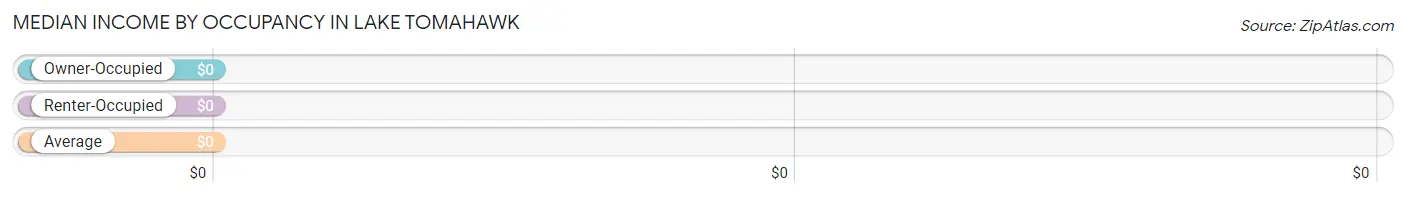
| Occupancy Type | # Households | Median Income |
| Owner-Occupied | 325 (100.0%) | $0 |
| Renter-Occupied | 0 (0.0%) | $0 |
| Average | 325 (100.0%) | $0 |
Occupancy by Householder Income Bracket in Lake Tomahawk
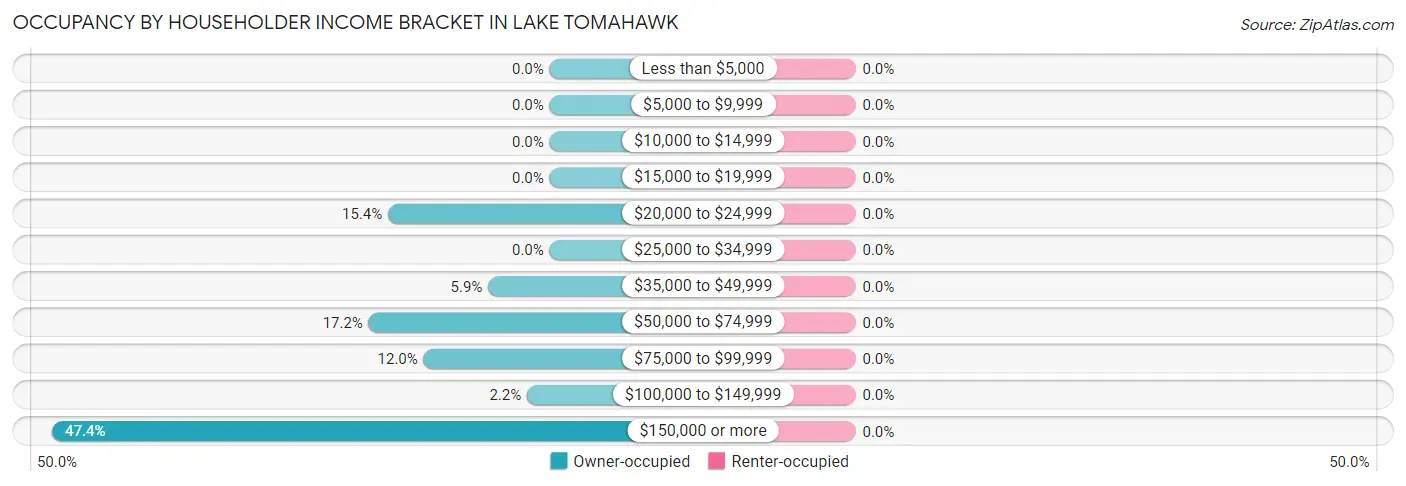
| Income Bracket | Owner-occupied | Renter-occupied |
| Less than $5,000 | 0 (0.0%) | 0 (0.0%) |
| $5,000 to $9,999 | 0 (0.0%) | 0 (0.0%) |
| $10,000 to $14,999 | 0 (0.0%) | 0 (0.0%) |
| $15,000 to $19,999 | 0 (0.0%) | 0 (0.0%) |
| $20,000 to $24,999 | 50 (15.4%) | 0 (0.0%) |
| $25,000 to $34,999 | 0 (0.0%) | 0 (0.0%) |
| $35,000 to $49,999 | 19 (5.9%) | 0 (0.0%) |
| $50,000 to $74,999 | 56 (17.2%) | 0 (0.0%) |
| $75,000 to $99,999 | 39 (12.0%) | 0 (0.0%) |
| $100,000 to $149,999 | 7 (2.1%) | 0 (0.0%) |
| $150,000 or more | 154 (47.4%) | 0 (0.0%) |
| Total | 325 (100.0%) | 0 (0.0%) |
Monthly Housing Cost Tiers in Lake Tomahawk
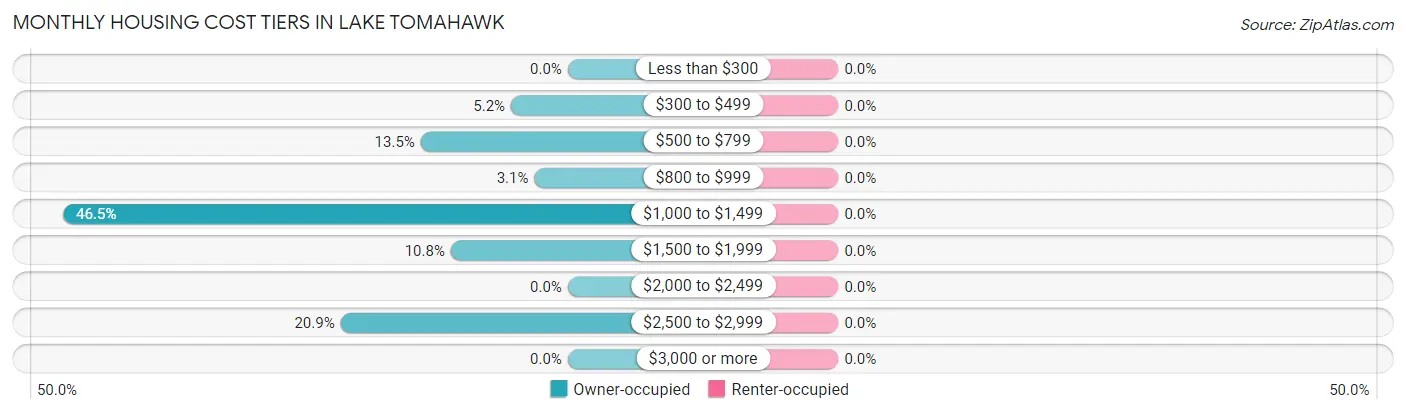
| Monthly Cost | Owner-occupied | Renter-occupied |
| Less than $300 | 0 (0.0%) | 0 (0.0%) |
| $300 to $499 | 17 (5.2%) | 0 (0.0%) |
| $500 to $799 | 44 (13.5%) | 0 (0.0%) |
| $800 to $999 | 10 (3.1%) | 0 (0.0%) |
| $1,000 to $1,499 | 151 (46.5%) | 0 (0.0%) |
| $1,500 to $1,999 | 35 (10.8%) | 0 (0.0%) |
| $2,000 to $2,499 | 0 (0.0%) | 0 (0.0%) |
| $2,500 to $2,999 | 68 (20.9%) | 0 (0.0%) |
| $3,000 or more | 0 (0.0%) | 0 (0.0%) |
| Total | 325 (100.0%) | 0 (0.0%) |
Physical Housing Characteristics in Lake Tomahawk
Housing Structures in Lake Tomahawk
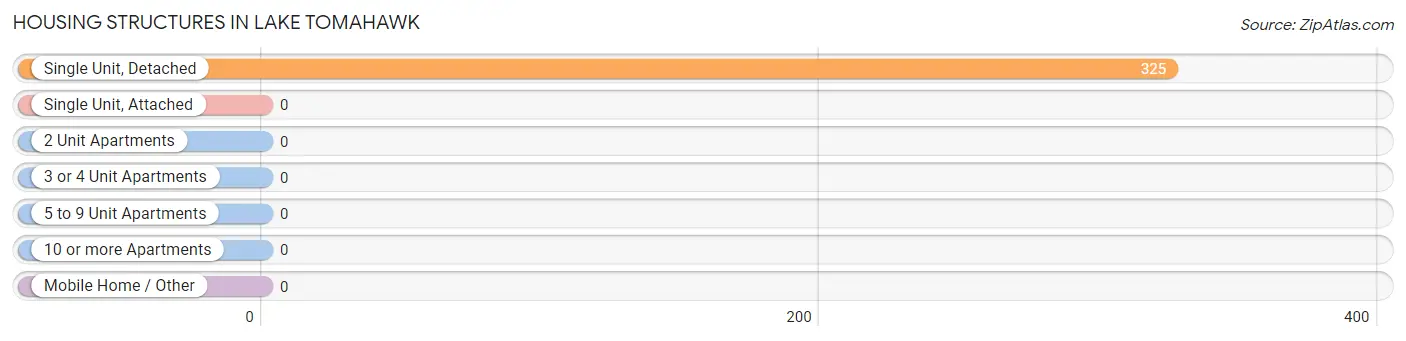
| Structure Type | # Housing Units | % Housing Units |
| Single Unit, Detached | 325 | 100.0% |
| Single Unit, Attached | 0 | 0.0% |
| 2 Unit Apartments | 0 | 0.0% |
| 3 or 4 Unit Apartments | 0 | 0.0% |
| 5 to 9 Unit Apartments | 0 | 0.0% |
| 10 or more Apartments | 0 | 0.0% |
| Mobile Home / Other | 0 | 0.0% |
| Total | 325 | 100.0% |
Housing Structures by Occupancy in Lake Tomahawk
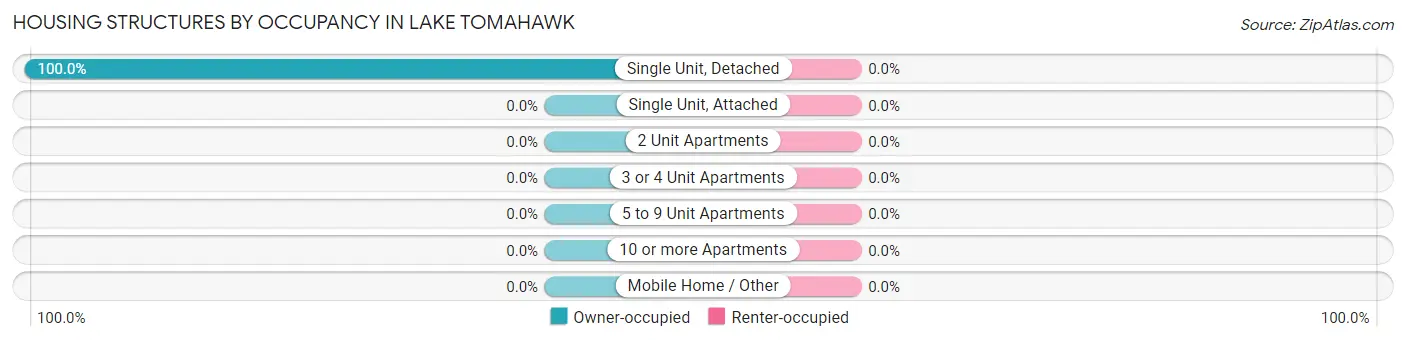
| Structure Type | Owner-occupied | Renter-occupied |
| Single Unit, Detached | 325 (100.0%) | 0 (0.0%) |
| Single Unit, Attached | 0 (0.0%) | 0 (0.0%) |
| 2 Unit Apartments | 0 (0.0%) | 0 (0.0%) |
| 3 or 4 Unit Apartments | 0 (0.0%) | 0 (0.0%) |
| 5 to 9 Unit Apartments | 0 (0.0%) | 0 (0.0%) |
| 10 or more Apartments | 0 (0.0%) | 0 (0.0%) |
| Mobile Home / Other | 0 (0.0%) | 0 (0.0%) |
| Total | 325 (100.0%) | 0 (0.0%) |
Housing Structures by Number of Rooms in Lake Tomahawk
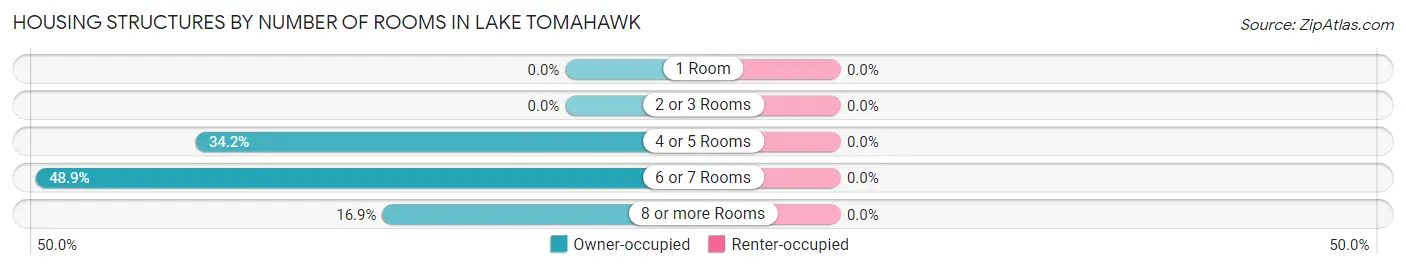
| Number of Rooms | Owner-occupied | Renter-occupied |
| 1 Room | 0 (0.0%) | 0 (0.0%) |
| 2 or 3 Rooms | 0 (0.0%) | 0 (0.0%) |
| 4 or 5 Rooms | 111 (34.2%) | 0 (0.0%) |
| 6 or 7 Rooms | 159 (48.9%) | 0 (0.0%) |
| 8 or more Rooms | 55 (16.9%) | 0 (0.0%) |
| Total | 325 (100.0%) | 0 (0.0%) |
Housing Structure by Heating Type in Lake Tomahawk
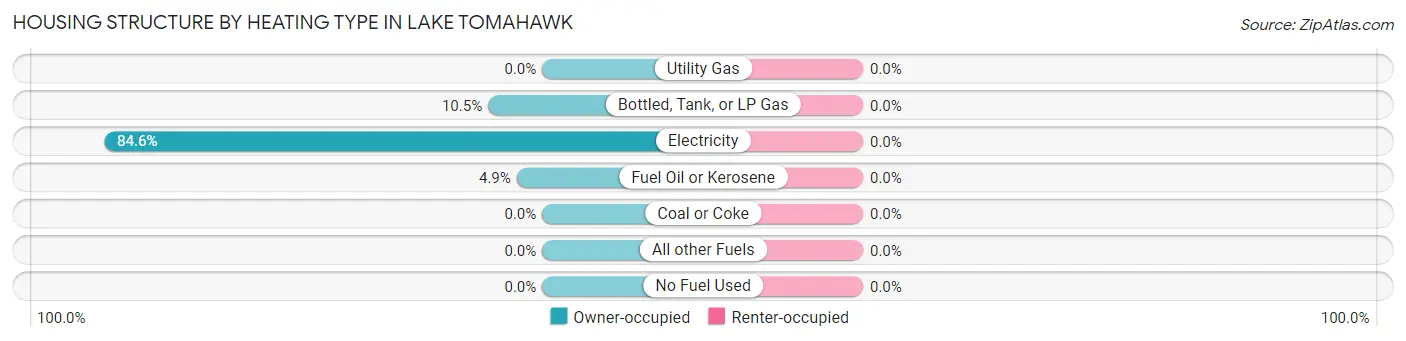
| Heating Type | Owner-occupied | Renter-occupied |
| Utility Gas | 0 (0.0%) | 0 (0.0%) |
| Bottled, Tank, or LP Gas | 34 (10.5%) | 0 (0.0%) |
| Electricity | 275 (84.6%) | 0 (0.0%) |
| Fuel Oil or Kerosene | 16 (4.9%) | 0 (0.0%) |
| Coal or Coke | 0 (0.0%) | 0 (0.0%) |
| All other Fuels | 0 (0.0%) | 0 (0.0%) |
| No Fuel Used | 0 (0.0%) | 0 (0.0%) |
| Total | 325 (100.0%) | 0 (0.0%) |
Household Vehicle Usage in Lake Tomahawk
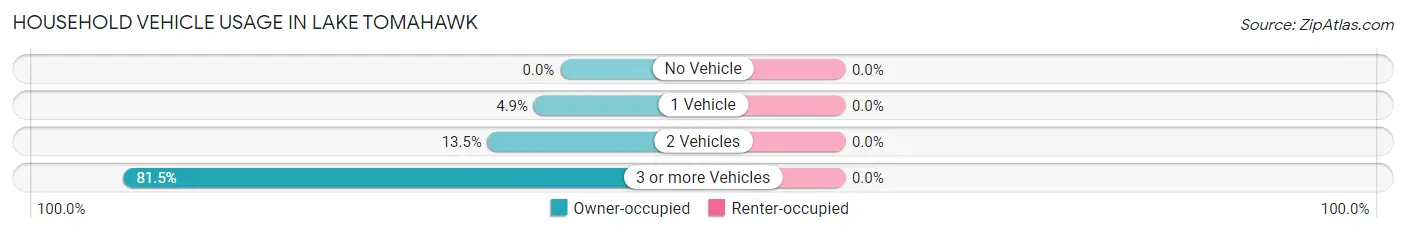
| Vehicles per Household | Owner-occupied | Renter-occupied |
| No Vehicle | 0 (0.0%) | 0 (0.0%) |
| 1 Vehicle | 16 (4.9%) | 0 (0.0%) |
| 2 Vehicles | 44 (13.5%) | 0 (0.0%) |
| 3 or more Vehicles | 265 (81.5%) | 0 (0.0%) |
| Total | 325 (100.0%) | 0 (0.0%) |
Real Estate & Mortgages in Lake Tomahawk
Real Estate and Mortgage Overview in Lake Tomahawk
| Characteristic | Without Mortgage | With Mortgage |
| Housing Units | 45 | 280 |
| Median Property Value | - | - |
| Median Household Income | $68,456 | $154 |
| Monthly Housing Costs | - | - |
| Real Estate Taxes | $1,841 | $0 |
Property Value by Mortgage Status in Lake Tomahawk
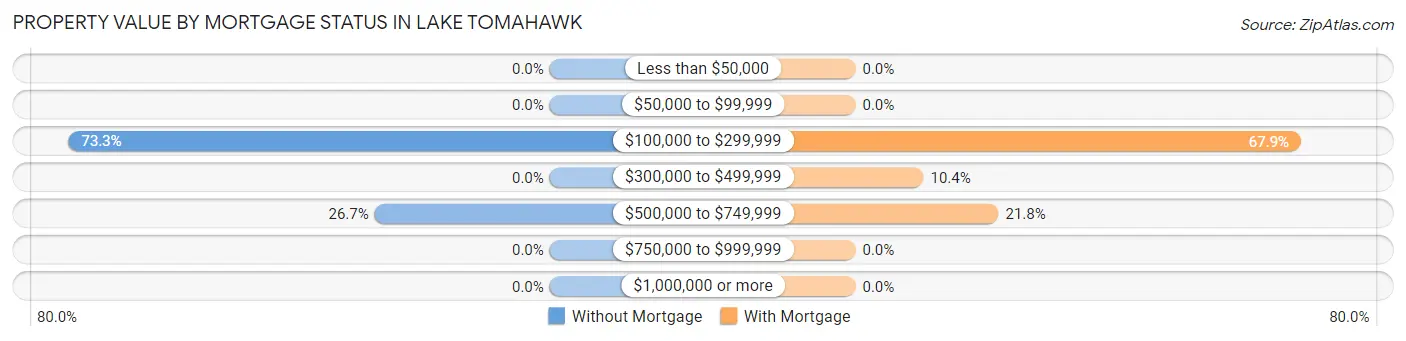
| Property Value | Without Mortgage | With Mortgage |
| Less than $50,000 | 0 (0.0%) | 0 (0.0%) |
| $50,000 to $99,999 | 0 (0.0%) | 0 (0.0%) |
| $100,000 to $299,999 | 33 (73.3%) | 190 (67.9%) |
| $300,000 to $499,999 | 0 (0.0%) | 29 (10.4%) |
| $500,000 to $749,999 | 12 (26.7%) | 61 (21.8%) |
| $750,000 to $999,999 | 0 (0.0%) | 0 (0.0%) |
| $1,000,000 or more | 0 (0.0%) | 0 (0.0%) |
| Total | 45 (100.0%) | 280 (100.0%) |
Household Income by Mortgage Status in Lake Tomahawk
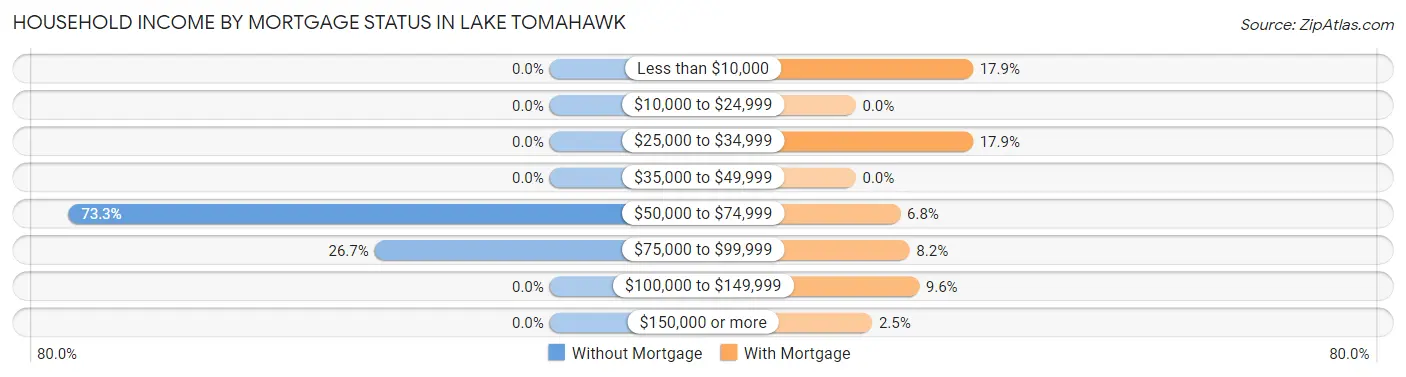
| Household Income | Without Mortgage | With Mortgage |
| Less than $10,000 | 0 (0.0%) | 50 (17.9%) |
| $10,000 to $24,999 | 0 (0.0%) | 0 (0.0%) |
| $25,000 to $34,999 | 0 (0.0%) | 50 (17.9%) |
| $35,000 to $49,999 | 0 (0.0%) | 0 (0.0%) |
| $50,000 to $74,999 | 33 (73.3%) | 19 (6.8%) |
| $75,000 to $99,999 | 12 (26.7%) | 23 (8.2%) |
| $100,000 to $149,999 | 0 (0.0%) | 27 (9.6%) |
| $150,000 or more | 0 (0.0%) | 7 (2.5%) |
| Total | 45 (100.0%) | 280 (100.0%) |
Property Value to Household Income Ratio in Lake Tomahawk
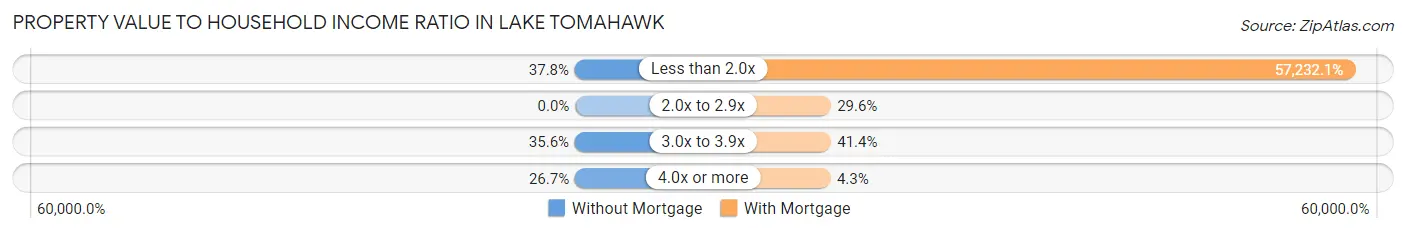
| Value-to-Income Ratio | Without Mortgage | With Mortgage |
| Less than 2.0x | 17 (37.8%) | 160,250 (57,232.1%) |
| 2.0x to 2.9x | 0 (0.0%) | 83 (29.6%) |
| 3.0x to 3.9x | 16 (35.6%) | 116 (41.4%) |
| 4.0x or more | 12 (26.7%) | 12 (4.3%) |
| Total | 45 (100.0%) | 280 (100.0%) |
Real Estate Taxes by Mortgage Status in Lake Tomahawk
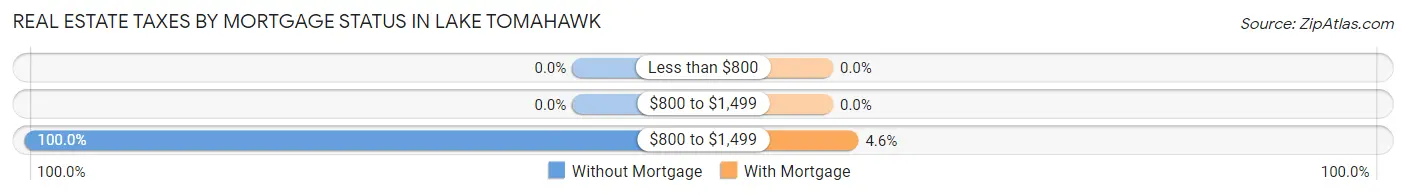
| Property Taxes | Without Mortgage | With Mortgage |
| Less than $800 | 0 (0.0%) | 0 (0.0%) |
| $800 to $1,499 | 0 (0.0%) | 0 (0.0%) |
| $800 to $1,499 | 45 (100.0%) | 13 (4.6%) |
| Total | 45 (100.0%) | 280 (100.0%) |
Health & Disability in Lake Tomahawk
Health Insurance Coverage by Age in Lake Tomahawk
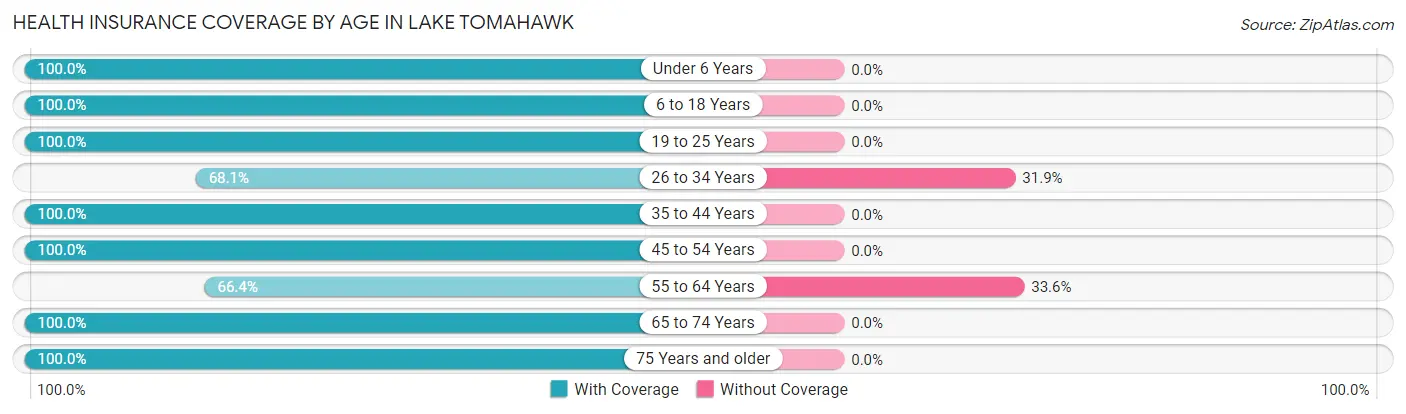
| Age Bracket | With Coverage | Without Coverage |
| Under 6 Years | 59 (100.0%) | 0 (0.0%) |
| 6 to 18 Years | 124 (100.0%) | 0 (0.0%) |
| 19 to 25 Years | 85 (100.0%) | 0 (0.0%) |
| 26 to 34 Years | 32 (68.1%) | 15 (31.9%) |
| 35 to 44 Years | 110 (100.0%) | 0 (0.0%) |
| 45 to 54 Years | 125 (100.0%) | 0 (0.0%) |
| 55 to 64 Years | 99 (66.4%) | 50 (33.6%) |
| 65 to 74 Years | 48 (100.0%) | 0 (0.0%) |
| 75 Years and older | 30 (100.0%) | 0 (0.0%) |
| Total | 712 (91.6%) | 65 (8.4%) |
Health Insurance Coverage by Citizenship Status in Lake Tomahawk
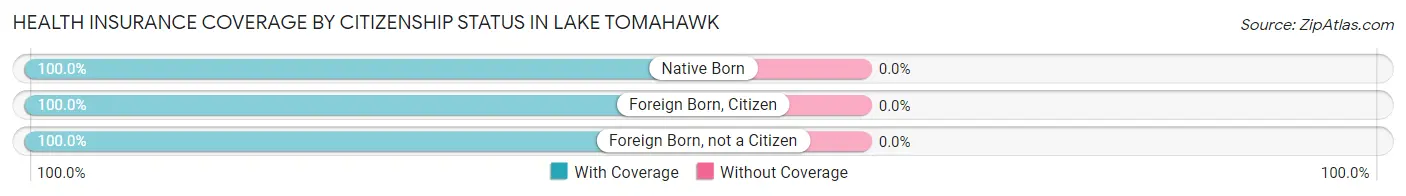
| Citizenship Status | With Coverage | Without Coverage |
| Native Born | 59 (100.0%) | 0 (0.0%) |
| Foreign Born, Citizen | 124 (100.0%) | 0 (0.0%) |
| Foreign Born, not a Citizen | 85 (100.0%) | 0 (0.0%) |
Health Insurance Coverage by Household Income in Lake Tomahawk
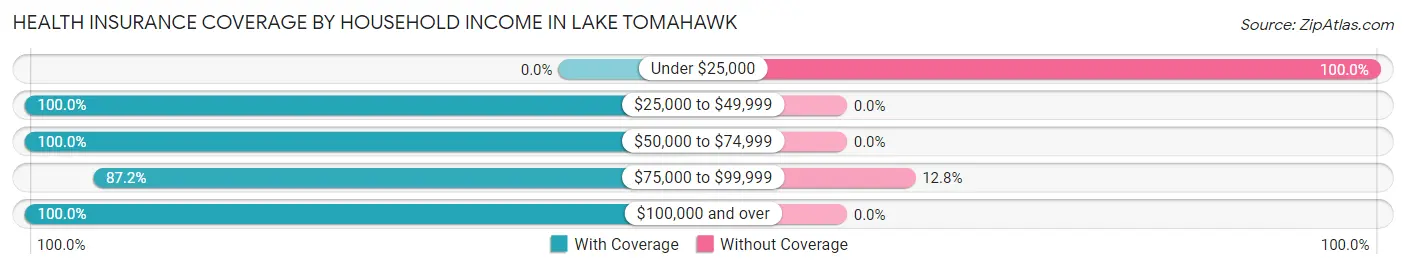
| Household Income | With Coverage | Without Coverage |
| Under $25,000 | 0 (0.0%) | 50 (100.0%) |
| $25,000 to $49,999 | 39 (100.0%) | 0 (0.0%) |
| $50,000 to $74,999 | 128 (100.0%) | 0 (0.0%) |
| $75,000 to $99,999 | 102 (87.2%) | 15 (12.8%) |
| $100,000 and over | 443 (100.0%) | 0 (0.0%) |
Public vs Private Health Insurance Coverage by Age in Lake Tomahawk
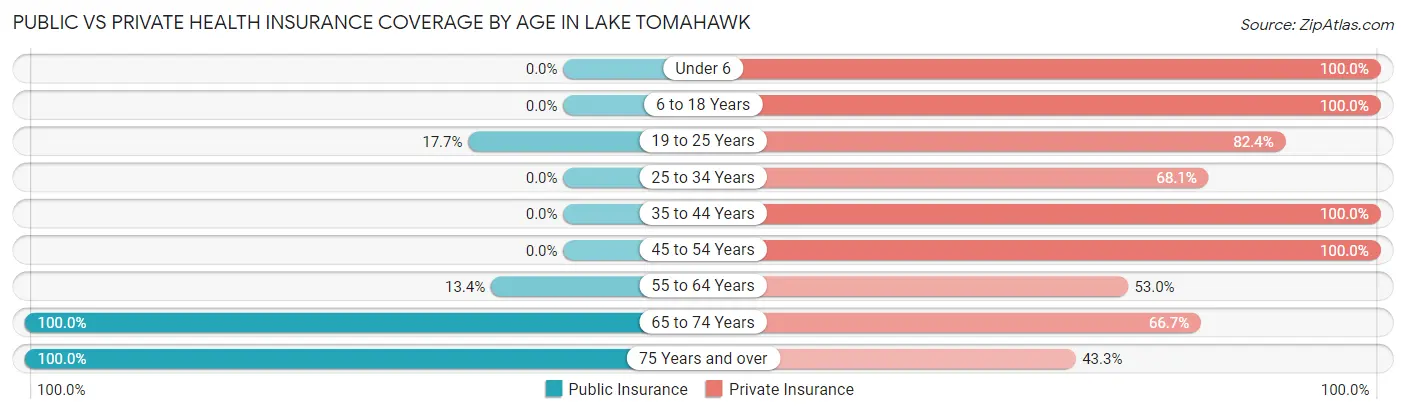
| Age Bracket | Public Insurance | Private Insurance |
| Under 6 | 0 (0.0%) | 59 (100.0%) |
| 6 to 18 Years | 0 (0.0%) | 124 (100.0%) |
| 19 to 25 Years | 15 (17.6%) | 70 (82.4%) |
| 25 to 34 Years | 0 (0.0%) | 32 (68.1%) |
| 35 to 44 Years | 0 (0.0%) | 110 (100.0%) |
| 45 to 54 Years | 0 (0.0%) | 125 (100.0%) |
| 55 to 64 Years | 20 (13.4%) | 79 (53.0%) |
| 65 to 74 Years | 48 (100.0%) | 32 (66.7%) |
| 75 Years and over | 30 (100.0%) | 13 (43.3%) |
| Total | 113 (14.5%) | 644 (82.9%) |
Disability Status by Sex by Age in Lake Tomahawk
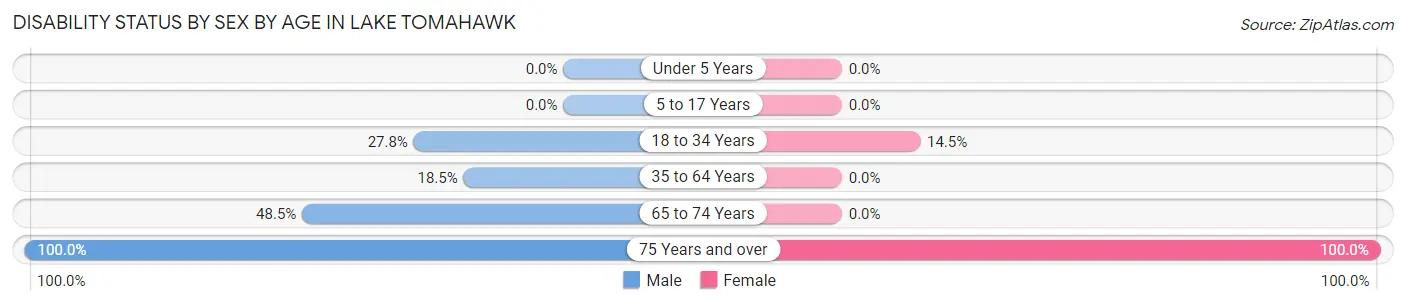
| Age Bracket | Male | Female |
| Under 5 Years | 0 (0.0%) | 0 (0.0%) |
| 5 to 17 Years | 0 (0.0%) | 0 (0.0%) |
| 18 to 34 Years | 15 (27.8%) | 18 (14.5%) |
| 35 to 64 Years | 50 (18.5%) | 0 (0.0%) |
| 65 to 74 Years | 16 (48.5%) | 0 (0.0%) |
| 75 Years and over | 13 (100.0%) | 17 (100.0%) |
Disability Class by Sex by Age in Lake Tomahawk
Disability Class: Hearing Difficulty
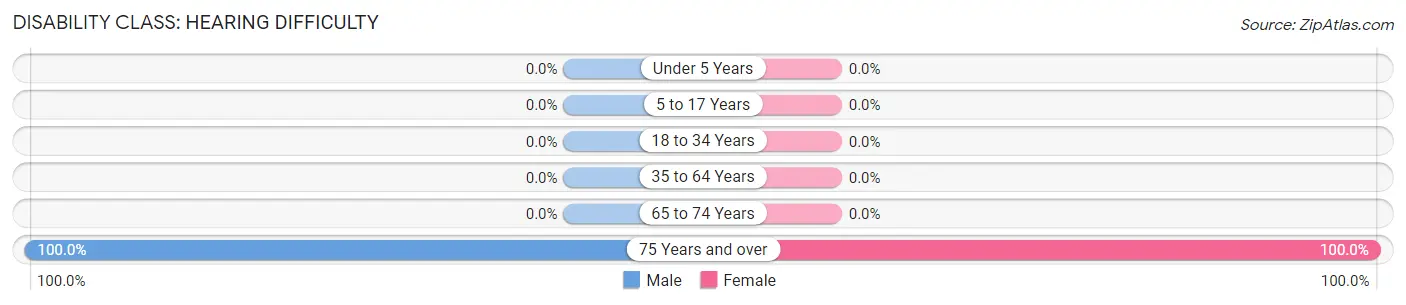
| Age Bracket | Male | Female |
| Under 5 Years | 0 (0.0%) | 0 (0.0%) |
| 5 to 17 Years | 0 (0.0%) | 0 (0.0%) |
| 18 to 34 Years | 0 (0.0%) | 0 (0.0%) |
| 35 to 64 Years | 0 (0.0%) | 0 (0.0%) |
| 65 to 74 Years | 0 (0.0%) | 0 (0.0%) |
| 75 Years and over | 13 (100.0%) | 17 (100.0%) |
Disability Class: Vision Difficulty
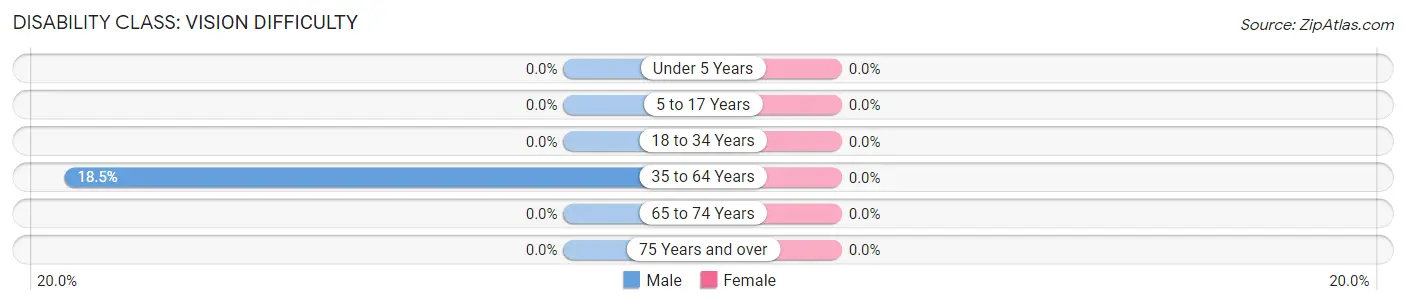
| Age Bracket | Male | Female |
| Under 5 Years | 0 (0.0%) | 0 (0.0%) |
| 5 to 17 Years | 0 (0.0%) | 0 (0.0%) |
| 18 to 34 Years | 0 (0.0%) | 0 (0.0%) |
| 35 to 64 Years | 50 (18.5%) | 0 (0.0%) |
| 65 to 74 Years | 0 (0.0%) | 0 (0.0%) |
| 75 Years and over | 0 (0.0%) | 0 (0.0%) |
Disability Class: Cognitive Difficulty
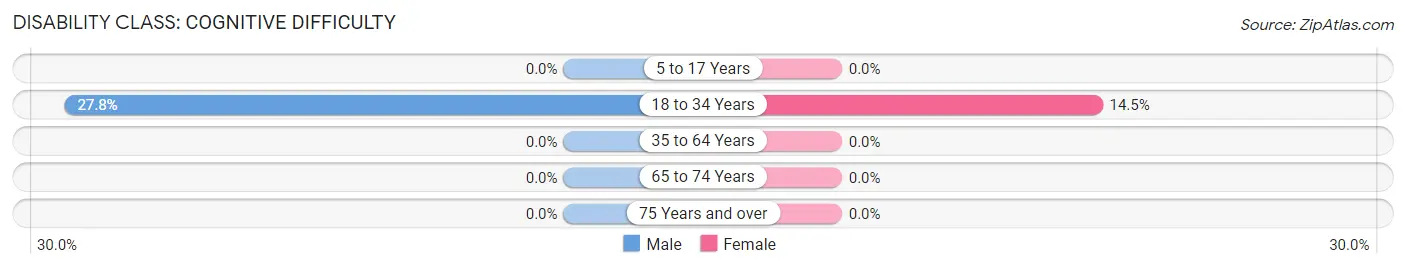
| Age Bracket | Male | Female |
| 5 to 17 Years | 0 (0.0%) | 0 (0.0%) |
| 18 to 34 Years | 15 (27.8%) | 18 (14.5%) |
| 35 to 64 Years | 0 (0.0%) | 0 (0.0%) |
| 65 to 74 Years | 0 (0.0%) | 0 (0.0%) |
| 75 Years and over | 0 (0.0%) | 0 (0.0%) |
Disability Class: Ambulatory Difficulty
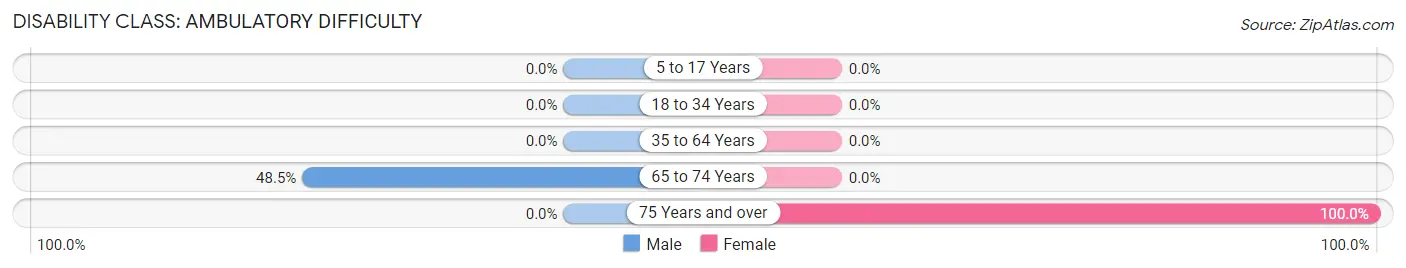
| Age Bracket | Male | Female |
| 5 to 17 Years | 0 (0.0%) | 0 (0.0%) |
| 18 to 34 Years | 0 (0.0%) | 0 (0.0%) |
| 35 to 64 Years | 0 (0.0%) | 0 (0.0%) |
| 65 to 74 Years | 16 (48.5%) | 0 (0.0%) |
| 75 Years and over | 0 (0.0%) | 17 (100.0%) |
Disability Class: Self-Care Difficulty
| Age Bracket | Male | Female |
| 5 to 17 Years | 0 (0.0%) | 0 (0.0%) |
| 18 to 34 Years | 0 (0.0%) | 0 (0.0%) |
| 35 to 64 Years | 0 (0.0%) | 0 (0.0%) |
| 65 to 74 Years | 0 (0.0%) | 0 (0.0%) |
| 75 Years and over | 0 (0.0%) | 0 (0.0%) |
Technology Access in Lake Tomahawk
Computing Device Access in Lake Tomahawk
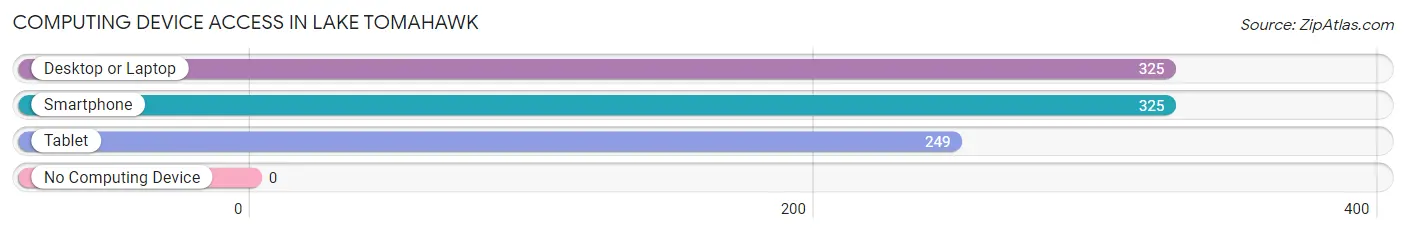
| Device Type | # Households | % Households |
| Desktop or Laptop | 325 | 100.0% |
| Smartphone | 325 | 100.0% |
| Tablet | 249 | 76.6% |
| No Computing Device | 0 | 0.0% |
| Total | 325 | 100.0% |
Internet Access in Lake Tomahawk
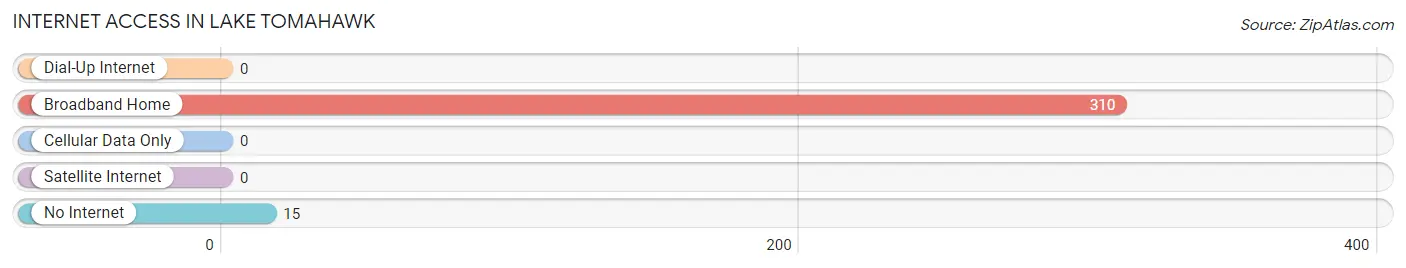
| Internet Type | # Households | % Households |
| Dial-Up Internet | 0 | 0.0% |
| Broadband Home | 310 | 95.4% |
| Cellular Data Only | 0 | 0.0% |
| Satellite Internet | 0 | 0.0% |
| No Internet | 15 | 4.6% |
| Total | 325 | 100.0% |
Lake Tomahawk Summary
Tomahawk Lake is a small unincorporated community located in the southeastern corner of Ohio, in the United States. It is situated in the Appalachian foothills of the Appalachian Mountains, in the Hocking Hills region of the state. The community is located in the southeastern corner of Hocking County, and is bordered by the townships of Falls, Salt Creek, and Starr.
History
Tomahawk Lake was first settled in the early 1800s by a group of settlers from Pennsylvania. The settlers were attracted to the area by the abundance of natural resources, including timber, coal, and limestone. The settlers built a small village around the lake, which was named Tomahawk Lake after the Native American tomahawk weapon. The village grew slowly, and by the mid-1800s, it had become a thriving community with a population of around 500 people.
The village was home to a variety of businesses, including a sawmill, a gristmill, a blacksmith shop, and a general store. The village also had a school, a post office, and a church. The village was connected to the outside world by a stagecoach line, which ran from Columbus to Tomahawk Lake.
In the late 1800s, the village began to decline as the timber and coal resources were depleted. The population began to decline, and by the early 1900s, the village had become a ghost town. In the 1950s, the village was revived when a group of investors purchased the land and began to develop it as a recreational area. The investors built a marina, a campground, and a lodge, and the area became a popular destination for fishing, boating, and camping.
Geography
Tomahawk Lake is located in the southeastern corner of Ohio, in the Appalachian foothills of the Appalachian Mountains. The community is situated in the Hocking Hills region of the state, and is bordered by the townships of Falls, Salt Creek, and Starr. The lake itself is a small, shallow lake, approximately one mile in diameter. The lake is fed by several small streams, and is surrounded by a variety of trees, including oak, maple, and hickory.
Economy
Tomahawk Lake is a small, unincorporated community, and does not have a large economy. The primary industry in the area is tourism, as the area is a popular destination for fishing, boating, and camping. The village also has a few small businesses, including a general store, a marina, and a campground.
Demographics
Tomahawk Lake is a small, unincorporated community, and does not have a large population. According to the 2010 census, the population of the village was just over 200 people. The population is primarily white, with a small percentage of African Americans and Native Americans. The median household income in the village is just over $30,000, and the median age is just over 40 years old.
Common Questions
What is Per Capita Income in Lake Tomahawk?
Per Capita income in Lake Tomahawk is $41,529.
What is the Median Family Income in Lake Tomahawk?
Median Family Income in Lake Tomahawk is $180,107.
What is Inequality or Gini Index in Lake Tomahawk?
Inequality or Gini Index in Lake Tomahawk is 0.31.
What is the Total Population of Lake Tomahawk?
Total Population of Lake Tomahawk is 777.
What is the Total Male Population of Lake Tomahawk?
Total Male Population of Lake Tomahawk is 412.
What is the Total Female Population of Lake Tomahawk?
Total Female Population of Lake Tomahawk is 365.
What is the Ratio of Males per 100 Females in Lake Tomahawk?
There are 112.88 Males per 100 Females in Lake Tomahawk.
What is the Ratio of Females per 100 Males in Lake Tomahawk?
There are 88.59 Females per 100 Males in Lake Tomahawk.
What is the Median Population Age in Lake Tomahawk?
Median Population Age in Lake Tomahawk is 42.0 Years.
What is the Average Family Size in Lake Tomahawk
Average Family Size in Lake Tomahawk is 2.7 People.
What is the Average Household Size in Lake Tomahawk
Average Household Size in Lake Tomahawk is 2.4 People.
How Large is the Labor Force in Lake Tomahawk?
There are 500 People in the Labor Forcein in Lake Tomahawk.
What is the Percentage of People in the Labor Force in Lake Tomahawk?
72.3% of People are in the Labor Force in Lake Tomahawk.
What is the Unemployment Rate in Lake Tomahawk?
Unemployment Rate in Lake Tomahawk is 9.0%.