McDonald, OH Map & Demographics
McDonald Map
McDonald Overview
$35,671
PER CAPITA INCOME
$82,333
AVG FAMILY INCOME
$75,315
AVG HOUSEHOLD INCOME
10.6%
WAGE / INCOME GAP [ % ]
89.4¢/ $1
WAGE / INCOME GAP [ $ ]
0.39
INEQUALITY / GINI INDEX
3,160
TOTAL POPULATION
1,440
MALE POPULATION
1,720
FEMALE POPULATION
83.72
MALES / 100 FEMALES
119.44
FEMALES / 100 MALES
43.7
MEDIAN AGE
2.9
AVG FAMILY SIZE
2.3
AVG HOUSEHOLD SIZE
1,577
LABOR FORCE [ PEOPLE ]
59.5%
PERCENT IN LABOR FORCE
2.5%
UNEMPLOYMENT RATE
Income in McDonald
Income Overview in McDonald
Per Capita Income in McDonald is $35,671, while median incomes of families and households are $82,333 and $75,315 respectively.
| Characteristic | Number | Measure |
| Per Capita Income | 3,160 | $35,671 |
| Median Family Income | 928 | $82,333 |
| Mean Family Income | 928 | $94,544 |
| Median Household Income | 1,350 | $75,315 |
| Mean Household Income | 1,350 | $83,652 |
| Income Deficit | 928 | $0 |
| Wage / Income Gap (%) | 3,160 | 10.62% |
| Wage / Income Gap ($) | 3,160 | 89.38¢ per $1 |
| Gini / Inequality Index | 3,160 | 0.39 |
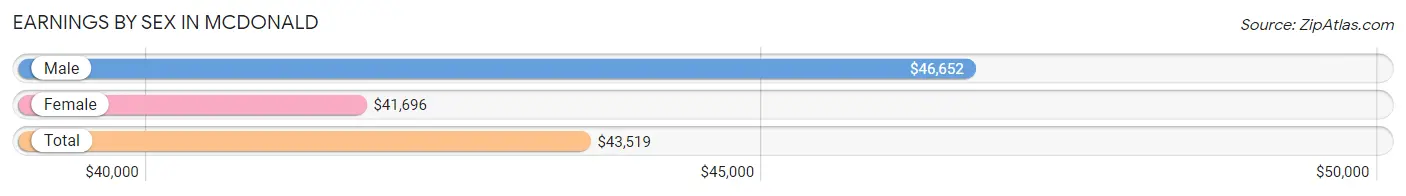
Earnings by Sex in McDonald
Average Earnings in McDonald are $43,519, $46,652 for men and $41,696 for women, a difference of 10.6%.
| Sex | Number | Average Earnings |
| Male | 787 (48.5%) | $46,652 |
| Female | 834 (51.4%) | $41,696 |
| Total | 1,621 (100.0%) | $43,519 |
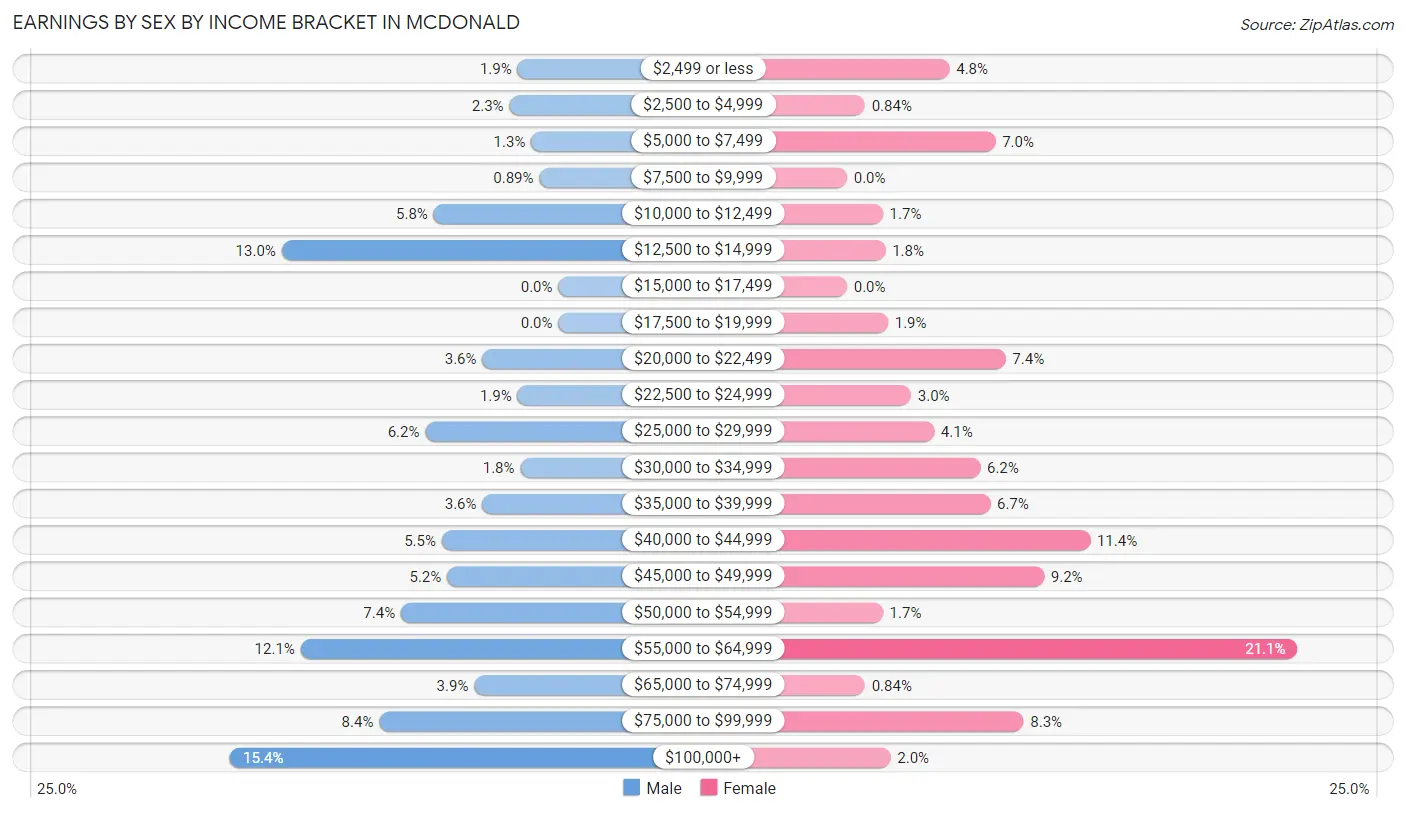
Earnings by Sex by Income Bracket in McDonald
The most common earnings brackets in McDonald are $100,000+ for men (121 | 15.4%) and $55,000 to $64,999 for women (176 | 21.1%).
| Income | Male | Female |
| $2,499 or less | 15 (1.9%) | 40 (4.8%) |
| $2,500 to $4,999 | 18 (2.3%) | 7 (0.8%) |
| $5,000 to $7,499 | 10 (1.3%) | 58 (7.0%) |
| $7,500 to $9,999 | 7 (0.9%) | 0 (0.0%) |
| $10,000 to $12,499 | 46 (5.8%) | 14 (1.7%) |
| $12,500 to $14,999 | 102 (13.0%) | 15 (1.8%) |
| $15,000 to $17,499 | 0 (0.0%) | 0 (0.0%) |
| $17,500 to $19,999 | 0 (0.0%) | 16 (1.9%) |
| $20,000 to $22,499 | 28 (3.6%) | 62 (7.4%) |
| $22,500 to $24,999 | 15 (1.9%) | 25 (3.0%) |
| $25,000 to $29,999 | 49 (6.2%) | 34 (4.1%) |
| $30,000 to $34,999 | 14 (1.8%) | 52 (6.2%) |
| $35,000 to $39,999 | 28 (3.6%) | 56 (6.7%) |
| $40,000 to $44,999 | 43 (5.5%) | 95 (11.4%) |
| $45,000 to $49,999 | 41 (5.2%) | 77 (9.2%) |
| $50,000 to $54,999 | 58 (7.4%) | 14 (1.7%) |
| $55,000 to $64,999 | 95 (12.1%) | 176 (21.1%) |
| $65,000 to $74,999 | 31 (3.9%) | 7 (0.8%) |
| $75,000 to $99,999 | 66 (8.4%) | 69 (8.3%) |
| $100,000+ | 121 (15.4%) | 17 (2.0%) |
| Total | 787 (100.0%) | 834 (100.0%) |
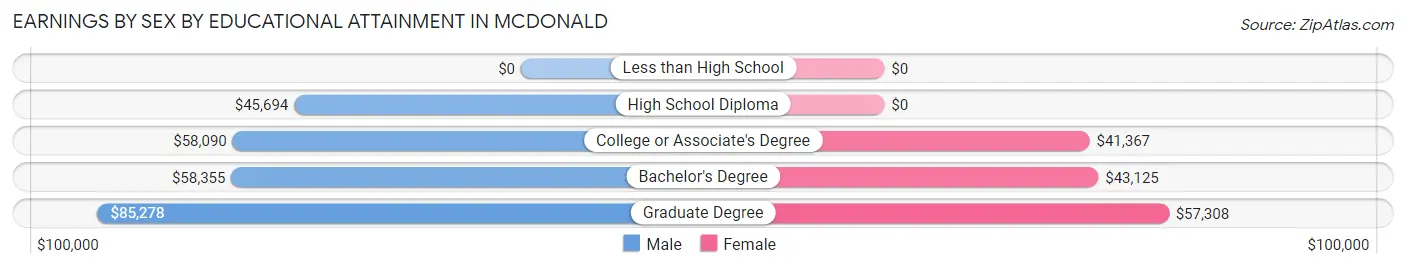
Earnings by Sex by Educational Attainment in McDonald
Average earnings in McDonald are $57,039 for men and $44,744 for women, a difference of 21.6%. Men with an educational attainment of graduate degree enjoy the highest average annual earnings of $85,278, while those with high school diploma education earn the least with $45,694. Women with an educational attainment of graduate degree earn the most with the average annual earnings of $57,308, while those with college or associate's degree education have the smallest earnings of $41,367.
| Educational Attainment | Male Income | Female Income |
| Less than High School | - | - |
| High School Diploma | $45,694 | $0 |
| College or Associate's Degree | $58,090 | $41,367 |
| Bachelor's Degree | $58,355 | $43,125 |
| Graduate Degree | $85,278 | $57,308 |
| Total | $57,039 | $44,744 |
Family Income in McDonald
Family Income Brackets in McDonald
According to the McDonald family income data, there are 271 families falling into the $75,000 to $99,999 income range, which is the most common income bracket and makes up 29.2% of all families.
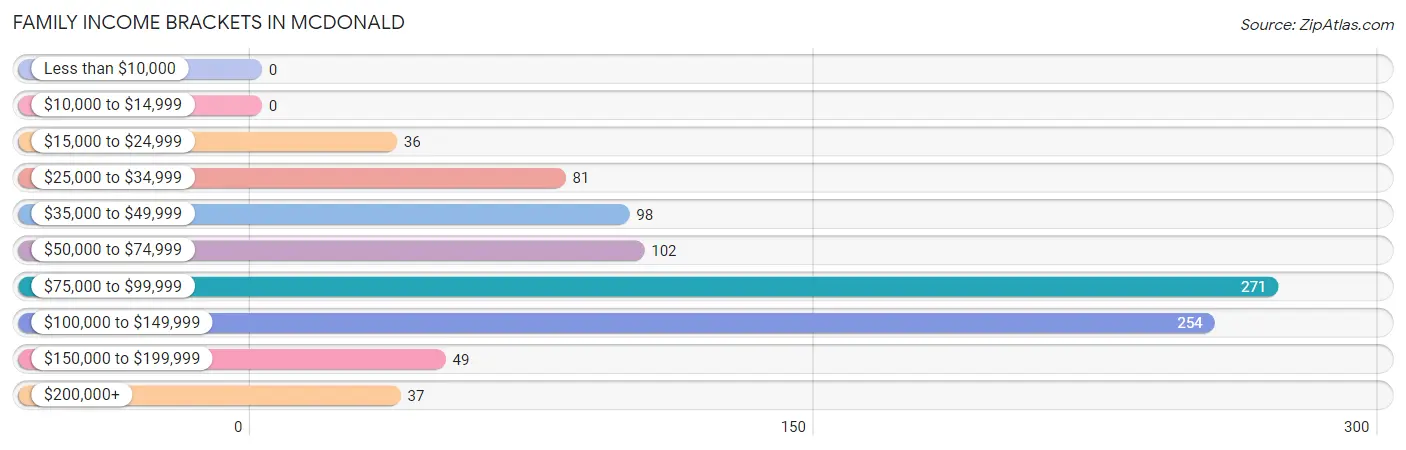
| Income Bracket | # Families | % Families |
| Less than $10,000 | 0 | 0.0% |
| $10,000 to $14,999 | 0 | 0.0% |
| $15,000 to $24,999 | 36 | 3.9% |
| $25,000 to $34,999 | 81 | 8.7% |
| $35,000 to $49,999 | 98 | 10.6% |
| $50,000 to $74,999 | 102 | 11.0% |
| $75,000 to $99,999 | 271 | 29.2% |
| $100,000 to $149,999 | 254 | 27.4% |
| $150,000 to $199,999 | 49 | 5.3% |
| $200,000+ | 37 | 4.0% |
Family Income by Famaliy Size in McDonald
4-person families (125 | 13.5%) account for the highest median family income in McDonald with $118,375 per family, while 2-person families (537 | 57.9%) have the highest median income of $37,584 per family member.
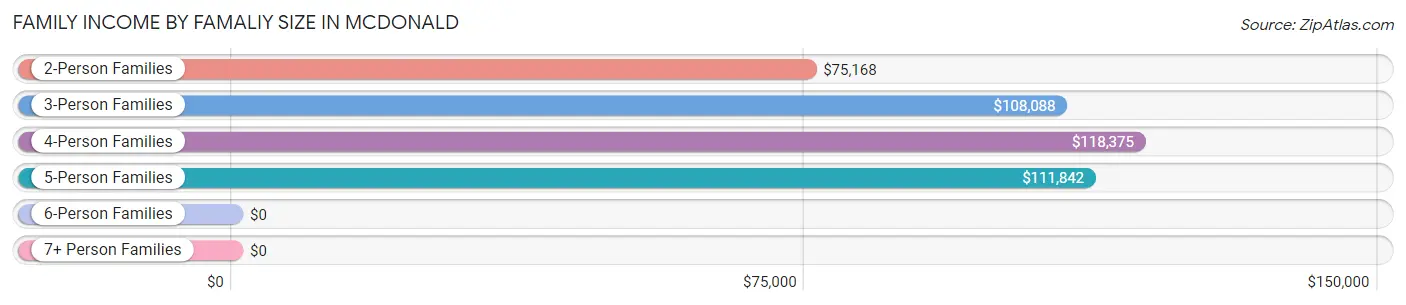
| Income Bracket | # Families | Median Income |
| 2-Person Families | 537 (57.9%) | $75,168 |
| 3-Person Families | 172 (18.5%) | $108,088 |
| 4-Person Families | 125 (13.5%) | $118,375 |
| 5-Person Families | 58 (6.2%) | $111,842 |
| 6-Person Families | 36 (3.9%) | $0 |
| 7+ Person Families | 0 (0.0%) | $0 |
| Total | 928 (100.0%) | $82,333 |
Family Income by Number of Earners in McDonald
The median family income in McDonald is $82,333, with families comprising 3+ earners (76) having the highest median family income of $142,632, while families with no earners (197) have the lowest median family income of $47,371, accounting for 8.2% and 21.2% of families, respectively.
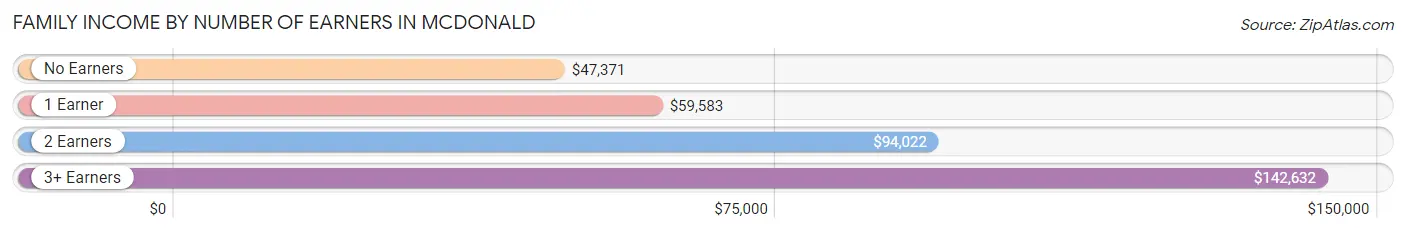
| Number of Earners | # Families | Median Income |
| No Earners | 197 (21.2%) | $47,371 |
| 1 Earner | 199 (21.4%) | $59,583 |
| 2 Earners | 456 (49.1%) | $94,022 |
| 3+ Earners | 76 (8.2%) | $142,632 |
| Total | 928 (100.0%) | $82,333 |
Household Income in McDonald
Household Income Brackets in McDonald
With 323 households falling in the category, the $75,000 to $99,999 income range is the most frequent in McDonald, accounting for 23.9% of all households. In contrast, only 18 households (1.3%) fall into the $10,000 to $14,999 income bracket, making it the least populous group.
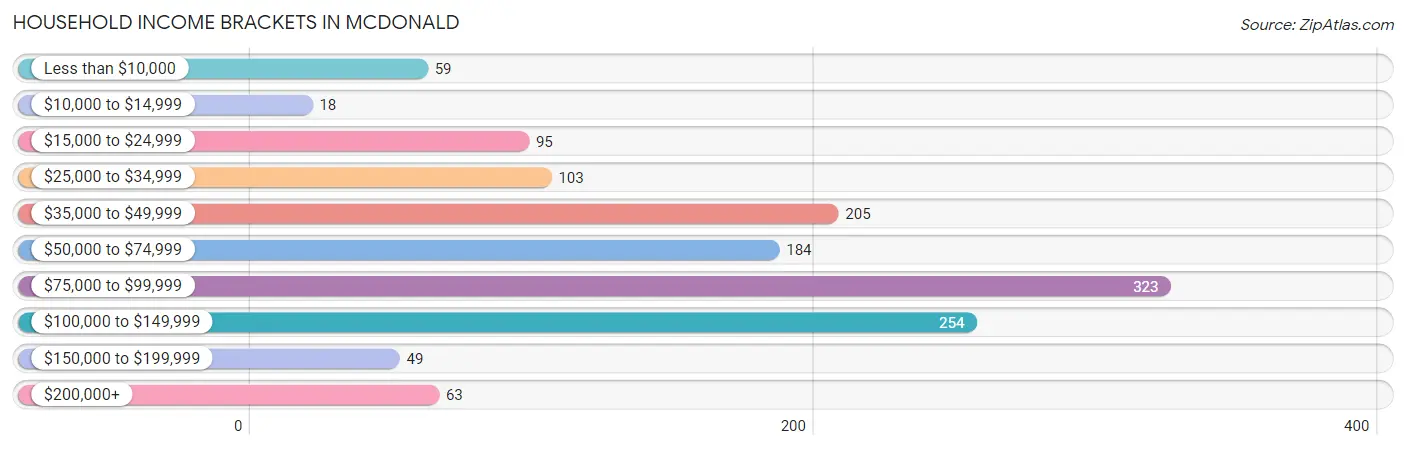
| Income Bracket | # Households | % Households |
| Less than $10,000 | 59 | 4.4% |
| $10,000 to $14,999 | 18 | 1.3% |
| $15,000 to $24,999 | 95 | 7.0% |
| $25,000 to $34,999 | 103 | 7.6% |
| $35,000 to $49,999 | 205 | 15.2% |
| $50,000 to $74,999 | 184 | 13.6% |
| $75,000 to $99,999 | 323 | 23.9% |
| $100,000 to $149,999 | 254 | 18.8% |
| $150,000 to $199,999 | 49 | 3.6% |
| $200,000+ | 63 | 4.7% |
Household Income by Householder Age in McDonald
The median household income in McDonald is $75,315, with the highest median household income of $87,667 found in the 25 to 44 years age bracket for the primary householder. A total of 430 households (31.9%) fall into this category.
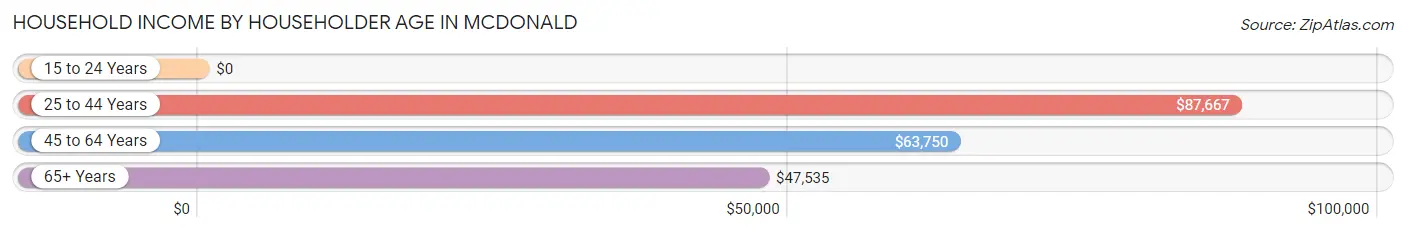
| Income Bracket | # Households | Median Income |
| 15 to 24 Years | 0 (0.0%) | $0 |
| 25 to 44 Years | 430 (31.9%) | $87,667 |
| 45 to 64 Years | 486 (36.0%) | $63,750 |
| 65+ Years | 434 (32.2%) | $47,535 |
| Total | 1,350 (100.0%) | $75,315 |
Poverty in McDonald
Income Below Poverty by Sex and Age in McDonald
With 3.1% poverty level for males and 4.3% for females among the residents of McDonald, 12 to 14 year old males and 75 year old and over females are the most vulnerable to poverty, with 18 males (26.5%) and 51 females (21.0%) in their respective age groups living below the poverty level.
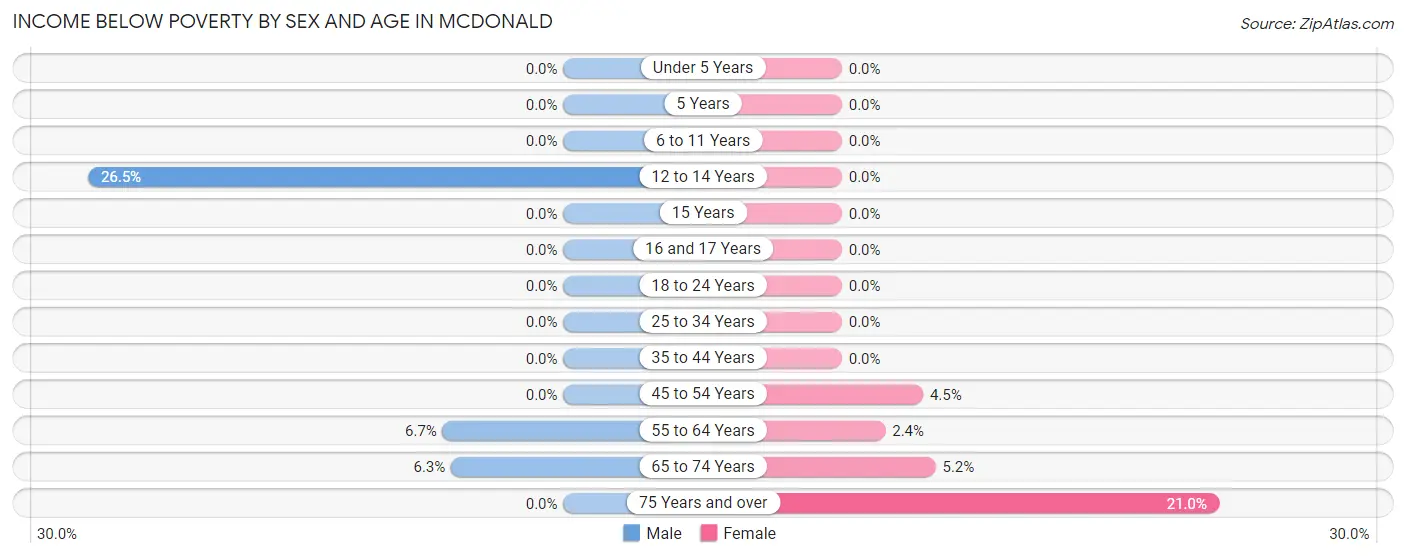
| Age Bracket | Male | Female |
| Under 5 Years | 0 (0.0%) | 0 (0.0%) |
| 5 Years | 0 (0.0%) | 0 (0.0%) |
| 6 to 11 Years | 0 (0.0%) | 0 (0.0%) |
| 12 to 14 Years | 18 (26.5%) | 0 (0.0%) |
| 15 Years | 0 (0.0%) | 0 (0.0%) |
| 16 and 17 Years | 0 (0.0%) | 0 (0.0%) |
| 18 to 24 Years | 0 (0.0%) | 0 (0.0%) |
| 25 to 34 Years | 0 (0.0%) | 0 (0.0%) |
| 35 to 44 Years | 0 (0.0%) | 0 (0.0%) |
| 45 to 54 Years | 0 (0.0%) | 10 (4.5%) |
| 55 to 64 Years | 18 (6.7%) | 6 (2.4%) |
| 65 to 74 Years | 8 (6.2%) | 7 (5.2%) |
| 75 Years and over | 0 (0.0%) | 51 (21.0%) |
| Total | 44 (3.1%) | 74 (4.3%) |
Income Above Poverty by Sex and Age in McDonald
According to the poverty statistics in McDonald, males aged under 5 years and females aged under 5 years are the age groups that are most secure financially, with 100.0% of males and 100.0% of females in these age groups living above the poverty line.
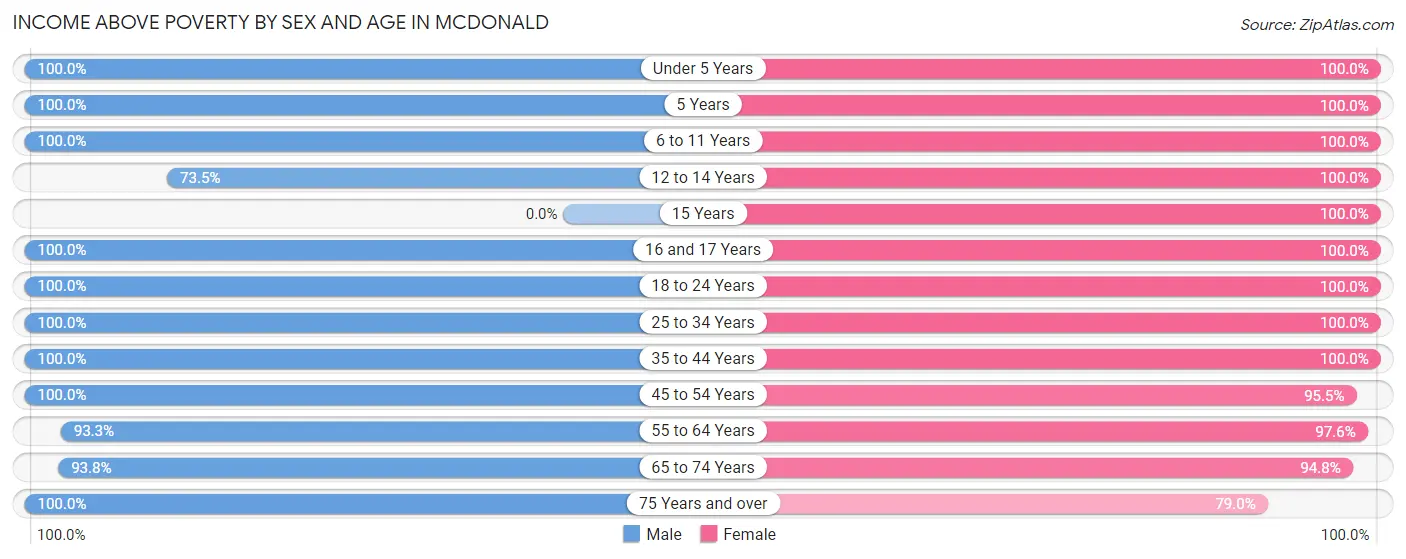
| Age Bracket | Male | Female |
| Under 5 Years | 50 (100.0%) | 66 (100.0%) |
| 5 Years | 23 (100.0%) | 13 (100.0%) |
| 6 to 11 Years | 64 (100.0%) | 90 (100.0%) |
| 12 to 14 Years | 50 (73.5%) | 68 (100.0%) |
| 15 Years | 0 (0.0%) | 45 (100.0%) |
| 16 and 17 Years | 60 (100.0%) | 48 (100.0%) |
| 18 to 24 Years | 181 (100.0%) | 130 (100.0%) |
| 25 to 34 Years | 168 (100.0%) | 132 (100.0%) |
| 35 to 44 Years | 138 (100.0%) | 282 (100.0%) |
| 45 to 54 Years | 142 (100.0%) | 211 (95.5%) |
| 55 to 64 Years | 250 (93.3%) | 242 (97.6%) |
| 65 to 74 Years | 120 (93.8%) | 127 (94.8%) |
| 75 Years and over | 127 (100.0%) | 192 (79.0%) |
| Total | 1,373 (96.9%) | 1,646 (95.7%) |
Income Below Poverty Among Married-Couple Families in McDonald
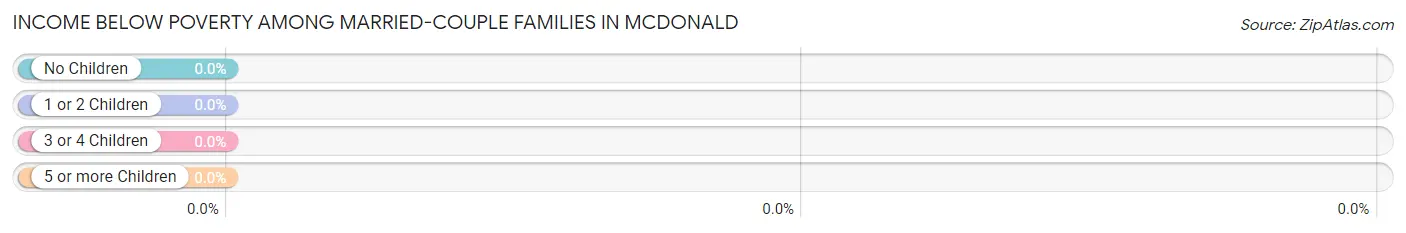
| Children | Above Poverty | Below Poverty |
| No Children | 430 (100.0%) | 0 (0.0%) |
| 1 or 2 Children | 184 (100.0%) | 0 (0.0%) |
| 3 or 4 Children | 75 (100.0%) | 0 (0.0%) |
| 5 or more Children | 0 (0.0%) | 0 (0.0%) |
| Total | 689 (100.0%) | 0 (0.0%) |
Income Below Poverty Among Single-Parent Households in McDonald
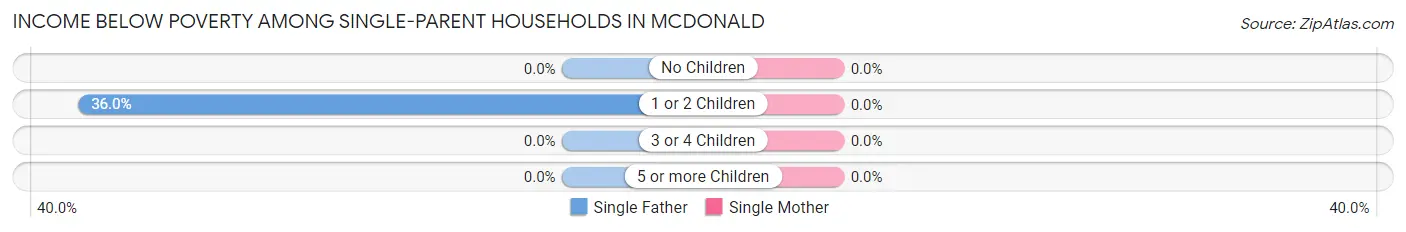
| Children | Single Father | Single Mother |
| No Children | 0 (0.0%) | 0 (0.0%) |
| 1 or 2 Children | 18 (36.0%) | 0 (0.0%) |
| 3 or 4 Children | 0 (0.0%) | 0 (0.0%) |
| 5 or more Children | 0 (0.0%) | 0 (0.0%) |
| Total | 18 (29.0%) | 0 (0.0%) |
Income Below Poverty Among Married-Couple vs Single-Parent Households in McDonald
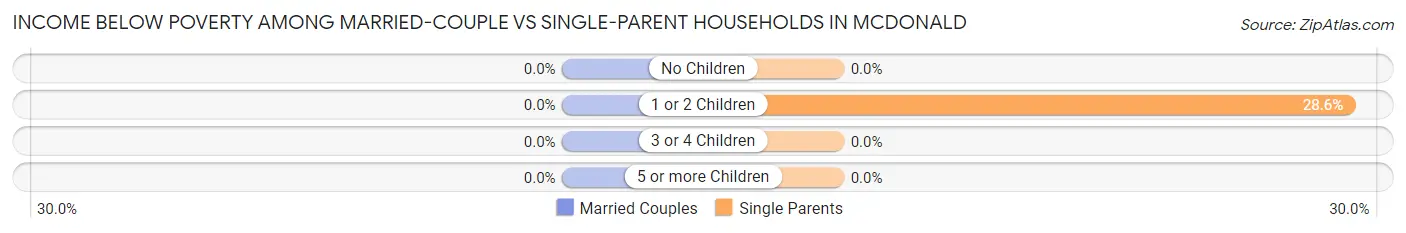
| Children | Married-Couple Families | Single-Parent Households |
| No Children | 0 (0.0%) | 0 (0.0%) |
| 1 or 2 Children | 0 (0.0%) | 18 (28.6%) |
| 3 or 4 Children | 0 (0.0%) | 0 (0.0%) |
| 5 or more Children | 0 (0.0%) | 0 (0.0%) |
| Total | 0 (0.0%) | 18 (7.5%) |
Race in McDonald
The most populous races in McDonald are White / Caucasian (3,037 | 96.1%), and Two or more Races (123 | 3.9%).
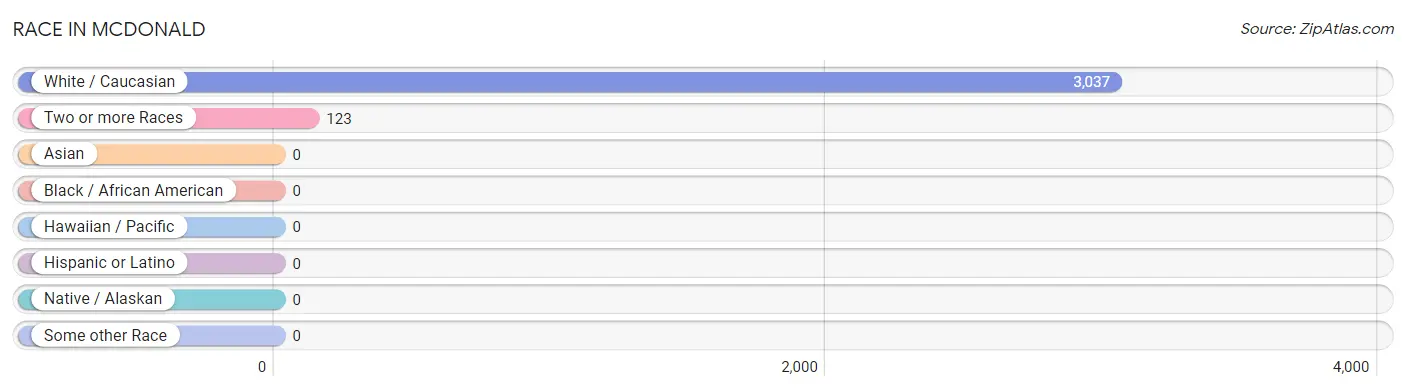
| Race | # Population | % Population |
| Asian | 0 | 0.0% |
| Black / African American | 0 | 0.0% |
| Hawaiian / Pacific | 0 | 0.0% |
| Hispanic or Latino | 0 | 0.0% |
| Native / Alaskan | 0 | 0.0% |
| White / Caucasian | 3,037 | 96.1% |
| Two or more Races | 123 | 3.9% |
| Some other Race | 0 | 0.0% |
| Total | 3,160 | 100.0% |
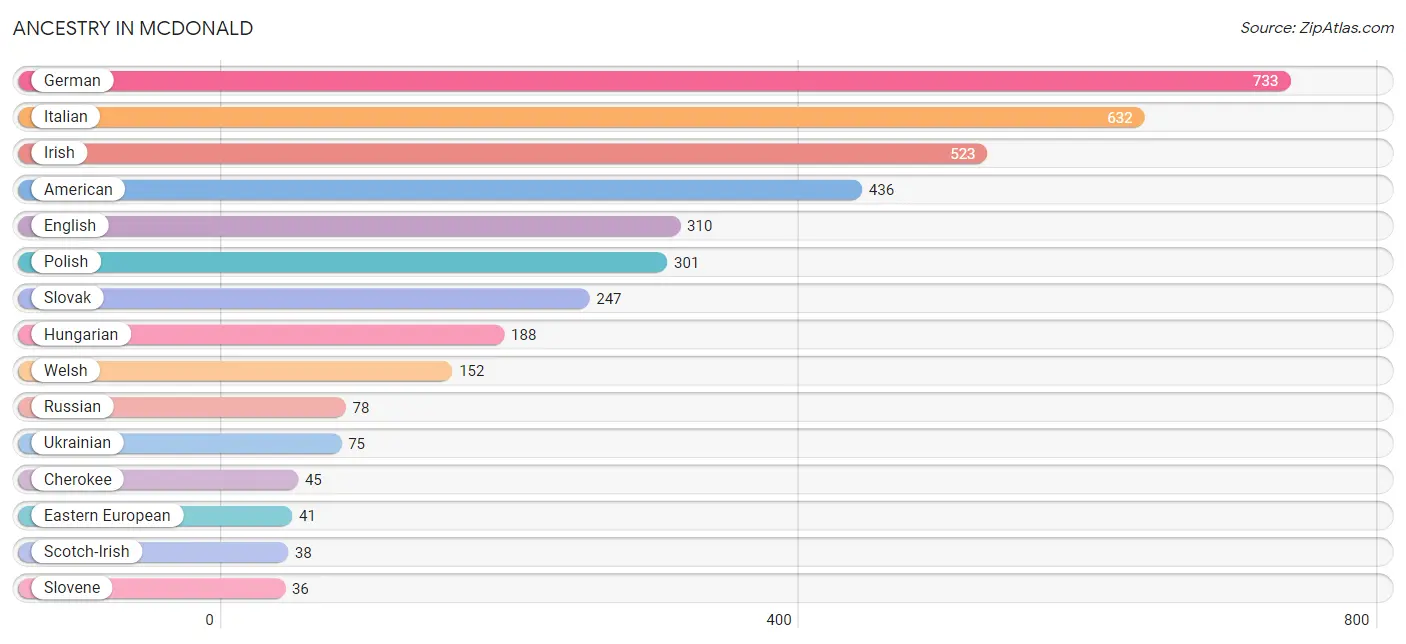
Ancestry in McDonald
The most populous ancestries reported in McDonald are German (733 | 23.2%), Italian (632 | 20.0%), Irish (523 | 16.6%), American (436 | 13.8%), and English (310 | 9.8%), together accounting for 83.4% of all McDonald residents.
| Ancestry | # Population | % Population |
| American | 436 | 13.8% |
| Austrian | 1 | 0.0% |
| Cherokee | 45 | 1.4% |
| Croatian | 27 | 0.9% |
| Czechoslovakian | 18 | 0.6% |
| Dutch | 26 | 0.8% |
| Eastern European | 41 | 1.3% |
| English | 310 | 9.8% |
| European | 7 | 0.2% |
| Finnish | 7 | 0.2% |
| French | 27 | 0.9% |
| French Canadian | 8 | 0.3% |
| German | 733 | 23.2% |
| Hungarian | 188 | 5.9% |
| Irish | 523 | 16.6% |
| Italian | 632 | 20.0% |
| Lithuanian | 7 | 0.2% |
| Macedonian | 7 | 0.2% |
| Polish | 301 | 9.5% |
| Portuguese | 16 | 0.5% |
| Romanian | 14 | 0.4% |
| Russian | 78 | 2.5% |
| Scandinavian | 7 | 0.2% |
| Scotch-Irish | 38 | 1.2% |
| Scottish | 14 | 0.4% |
| Serbian | 3 | 0.1% |
| Slovak | 247 | 7.8% |
| Slovene | 36 | 1.1% |
| Ukrainian | 75 | 2.4% |
| Welsh | 152 | 4.8% | View All 30 Rows |
Immigrants in McDonald
The most numerous immigrant groups reported in McDonald came from Europe (21 | 0.7%), Germany (13 | 0.4%), Western Europe (13 | 0.4%), Italy (8 | 0.3%), and Southern Europe (8 | 0.3%), together accounting for 2.0% of all McDonald residents.
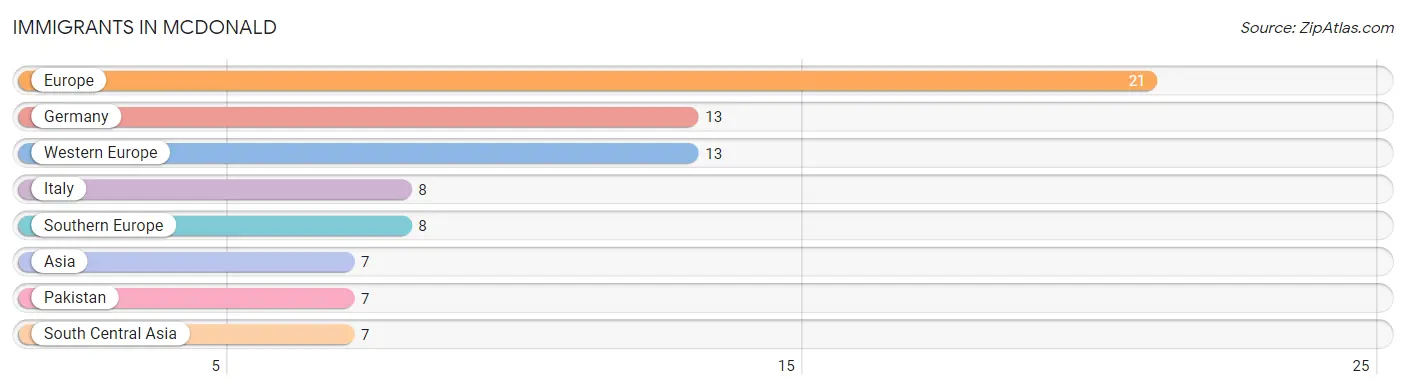
| Immigration Origin | # Population | % Population |
| Asia | 7 | 0.2% |
| Europe | 21 | 0.7% |
| Germany | 13 | 0.4% |
| Italy | 8 | 0.3% |
| Pakistan | 7 | 0.2% |
| South Central Asia | 7 | 0.2% |
| Southern Europe | 8 | 0.3% |
| Western Europe | 13 | 0.4% | View All 8 Rows |
Sex and Age in McDonald
Sex and Age in McDonald
The most populous age groups in McDonald are 60 to 64 Years (171 | 11.9%) for men and 40 to 44 Years (195 | 11.3%) for women.
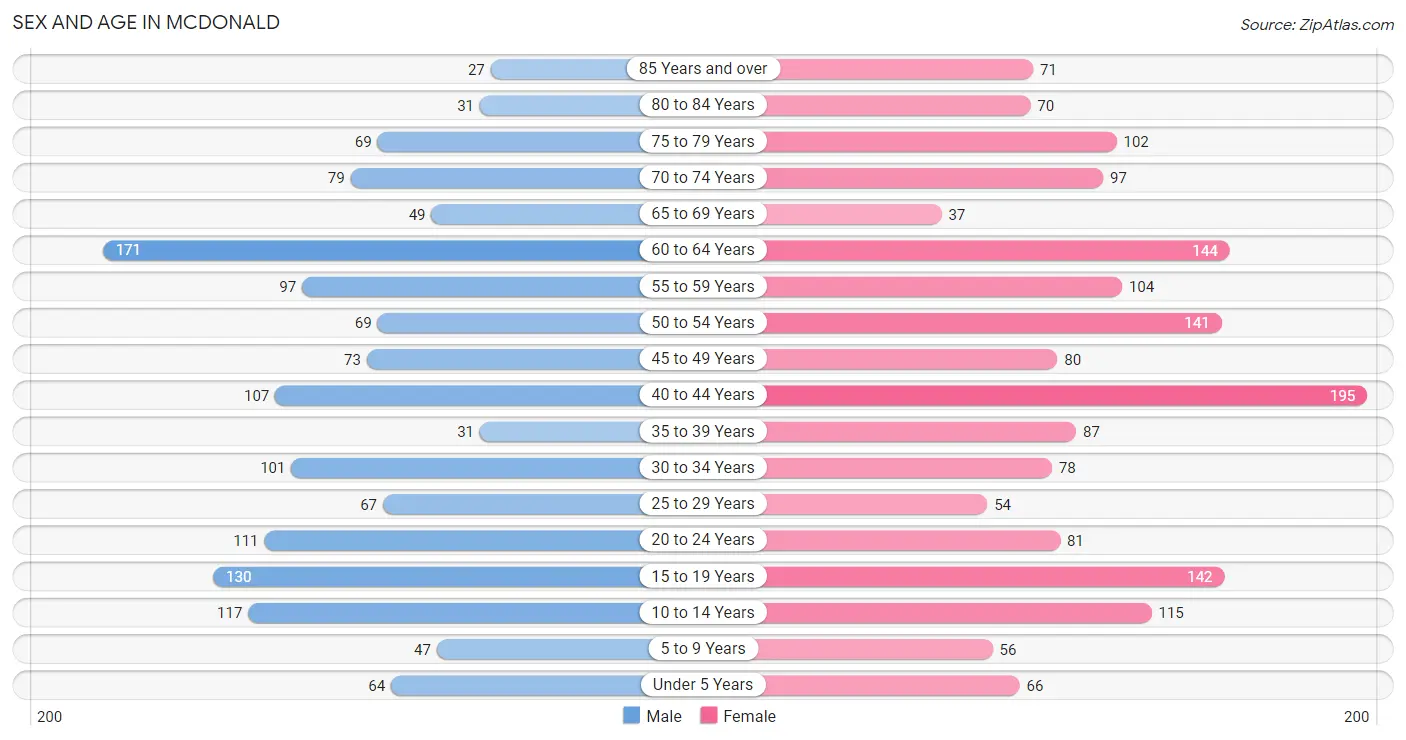
| Age Bracket | Male | Female |
| Under 5 Years | 64 (4.4%) | 66 (3.8%) |
| 5 to 9 Years | 47 (3.3%) | 56 (3.3%) |
| 10 to 14 Years | 117 (8.1%) | 115 (6.7%) |
| 15 to 19 Years | 130 (9.0%) | 142 (8.3%) |
| 20 to 24 Years | 111 (7.7%) | 81 (4.7%) |
| 25 to 29 Years | 67 (4.6%) | 54 (3.1%) |
| 30 to 34 Years | 101 (7.0%) | 78 (4.5%) |
| 35 to 39 Years | 31 (2.1%) | 87 (5.1%) |
| 40 to 44 Years | 107 (7.4%) | 195 (11.3%) |
| 45 to 49 Years | 73 (5.1%) | 80 (4.6%) |
| 50 to 54 Years | 69 (4.8%) | 141 (8.2%) |
| 55 to 59 Years | 97 (6.7%) | 104 (6.0%) |
| 60 to 64 Years | 171 (11.9%) | 144 (8.4%) |
| 65 to 69 Years | 49 (3.4%) | 37 (2.1%) |
| 70 to 74 Years | 79 (5.5%) | 97 (5.6%) |
| 75 to 79 Years | 69 (4.8%) | 102 (5.9%) |
| 80 to 84 Years | 31 (2.1%) | 70 (4.1%) |
| 85 Years and over | 27 (1.9%) | 71 (4.1%) |
| Total | 1,440 (100.0%) | 1,720 (100.0%) |
Families and Households in McDonald
Median Family Size in McDonald
The median family size in McDonald is 2.85 persons per family, with married-couple families (689 | 74.3%) accounting for the largest median family size of 3.07 persons per family. On the other hand, single female/mother families (177 | 19.1%) represent the smallest median family size with 2.20 persons per family.
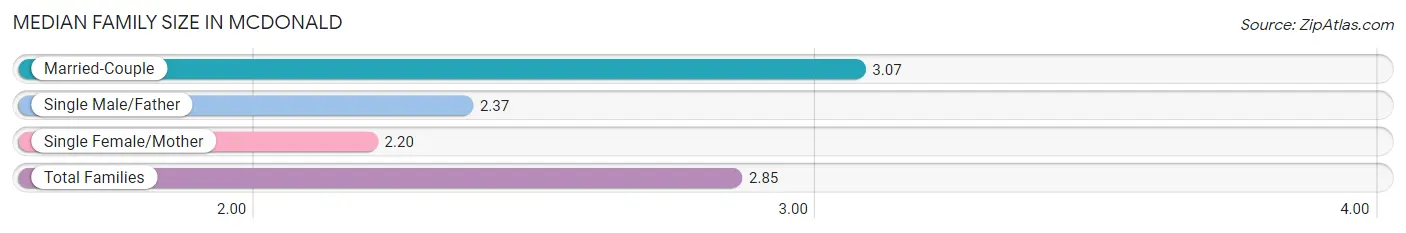
| Family Type | # Families | Family Size |
| Married-Couple | 689 (74.3%) | 3.07 |
| Single Male/Father | 62 (6.7%) | 2.37 |
| Single Female/Mother | 177 (19.1%) | 2.20 |
| Total Families | 928 (100.0%) | 2.85 |
Median Household Size in McDonald
The median household size in McDonald is 2.34 persons per household, with married-couple households (689 | 51.0%) accounting for the largest median household size of 3.07 persons per household. non-family households (422 | 31.3%) represent the smallest median household size with 1.09 persons per household.
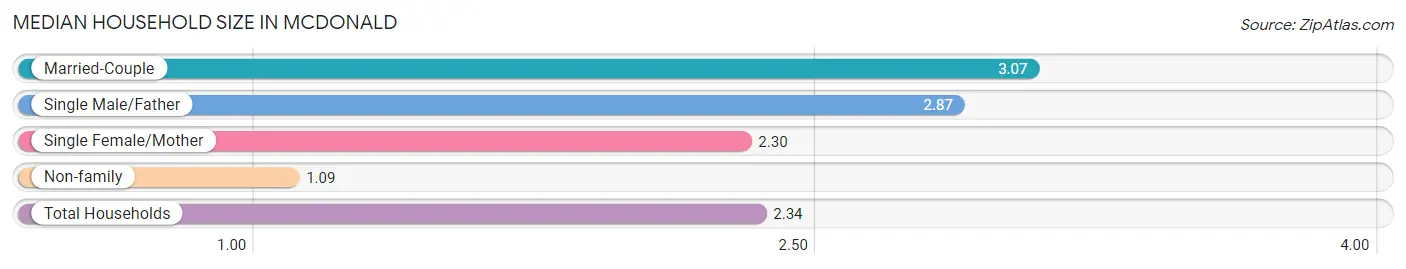
| Household Type | # Households | Household Size |
| Married-Couple | 689 (51.0%) | 3.07 |
| Single Male/Father | 62 (4.6%) | 2.87 |
| Single Female/Mother | 177 (13.1%) | 2.30 |
| Non-family | 422 (31.3%) | 1.09 |
| Total Households | 1,350 (100.0%) | 2.34 |
Household Size by Marriage Status in McDonald
Out of a total of 1,350 households in McDonald, 928 (68.7%) are family households, while 422 (31.3%) are nonfamily households. The most numerous type of family households are 2-person households, comprising 501, and the most common type of nonfamily households are 1-person households, comprising 380.
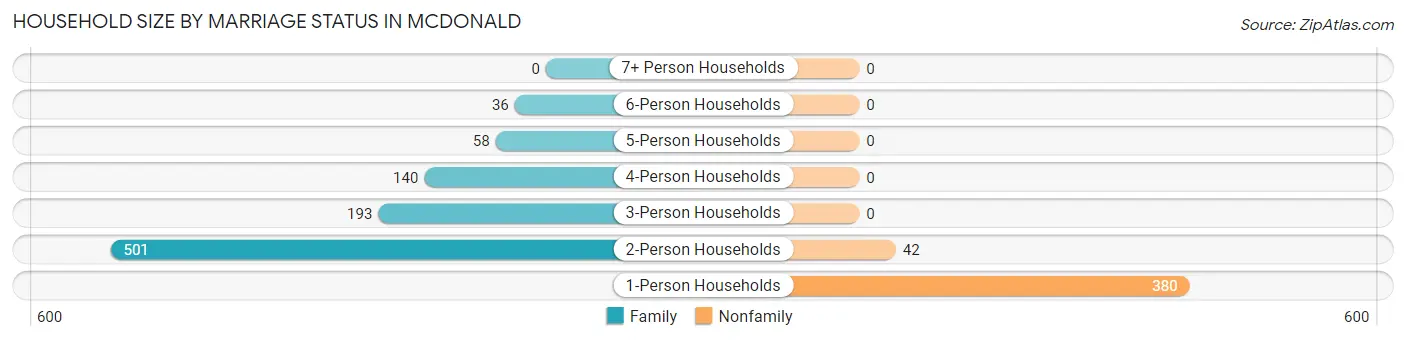
| Household Size | Family Households | Nonfamily Households |
| 1-Person Households | - | 380 (28.1%) |
| 2-Person Households | 501 (37.1%) | 42 (3.1%) |
| 3-Person Households | 193 (14.3%) | 0 (0.0%) |
| 4-Person Households | 140 (10.4%) | 0 (0.0%) |
| 5-Person Households | 58 (4.3%) | 0 (0.0%) |
| 6-Person Households | 36 (2.7%) | 0 (0.0%) |
| 7+ Person Households | 0 (0.0%) | 0 (0.0%) |
| Total | 928 (68.7%) | 422 (31.3%) |
Female Fertility in McDonald
Fertility by Age in McDonald
Average fertility rate in McDonald is 41.0 births per 1,000 women. Women in the age bracket of 20 to 34 years have the highest fertility rate with 146.0 births per 1,000 women. Women in the age bracket of 20 to 34 years acount for 100.0% of all women with births.
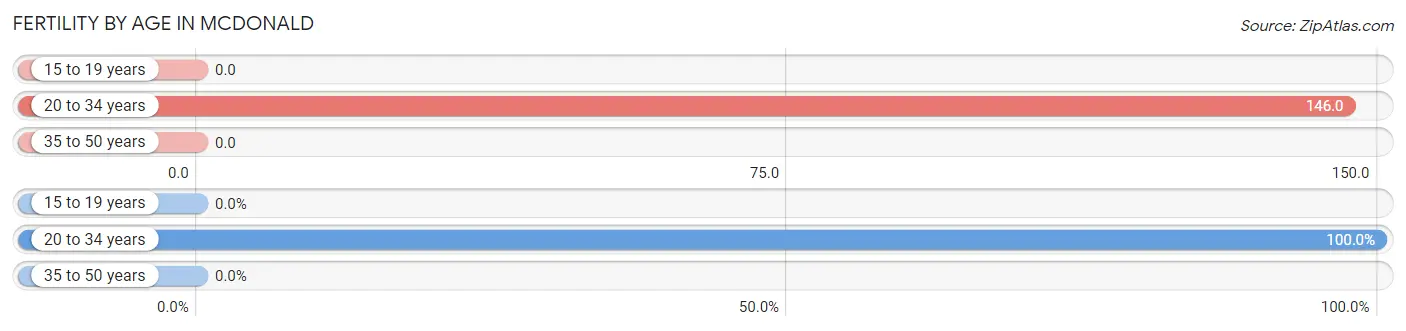
| Age Bracket | Women with Births | Births / 1,000 Women |
| 15 to 19 years | 0 (0.0%) | 0.0 |
| 20 to 34 years | 31 (100.0%) | 146.0 |
| 35 to 50 years | 0 (0.0%) | 0.0 |
| Total | 31 (100.0%) | 41.0 |
Fertility by Age by Marriage Status in McDonald
58.1% of women with births (31) in McDonald are married. The highest percentage of unmarried women with births falls into 20 to 34 years age bracket with 41.9% of them unmarried at the time of birth, while the lowest percentage of unmarried women with births belong to 20 to 34 years age bracket with 41.9% of them unmarried.
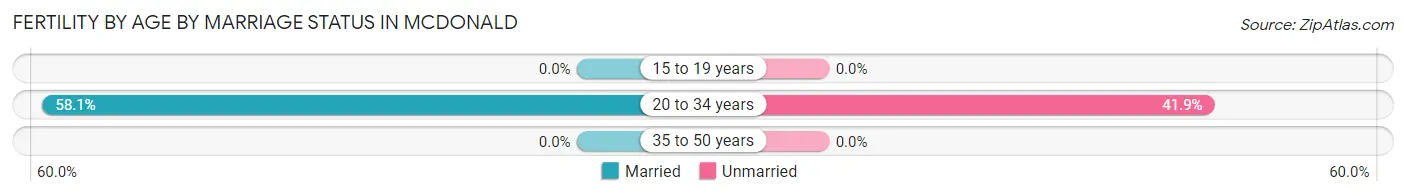
| Age Bracket | Married | Unmarried |
| 15 to 19 years | 0 (0.0%) | 0 (0.0%) |
| 20 to 34 years | 18 (58.1%) | 13 (41.9%) |
| 35 to 50 years | 0 (0.0%) | 0 (0.0%) |
| Total | 18 (58.1%) | 13 (41.9%) |
Fertility by Education in McDonald
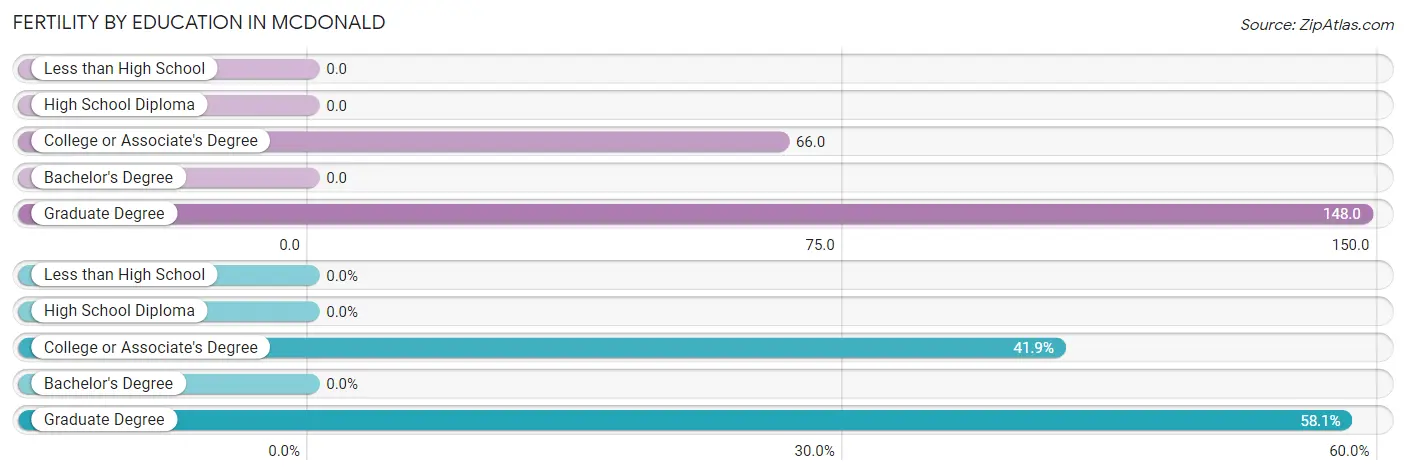
| Educational Attainment | Women with Births | Births / 1,000 Women |
| Less than High School | 0 (0.0%) | 0.0 |
| High School Diploma | 0 (0.0%) | 0.0 |
| College or Associate's Degree | 13 (41.9%) | 66.0 |
| Bachelor's Degree | 0 (0.0%) | 0.0 |
| Graduate Degree | 18 (58.1%) | 148.0 |
| Total | 31 (100.0%) | 41.0 |
Fertility by Education by Marriage Status in McDonald
41.9% of women with births in McDonald are unmarried. Women with the educational attainment of graduate degree are most likely to be married with 100.0% of them married at childbirth, while women with the educational attainment of college or associate's degree are least likely to be married with 100.0% of them unmarried at childbirth.
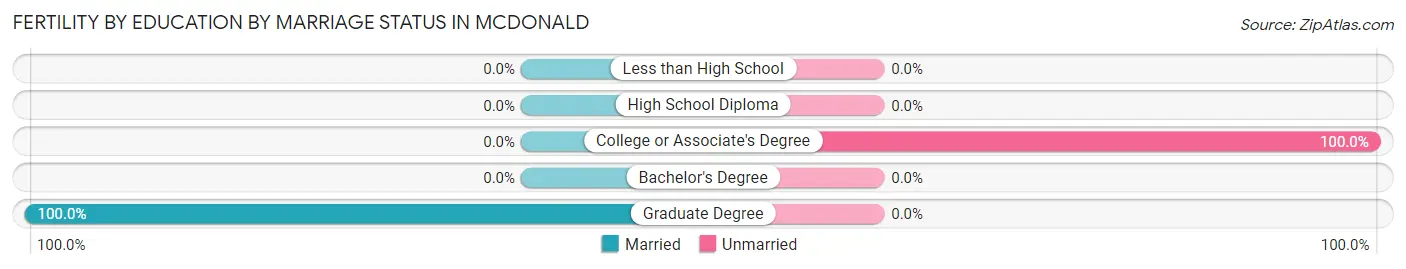
| Educational Attainment | Married | Unmarried |
| Less than High School | 0 (0.0%) | 0 (0.0%) |
| High School Diploma | 0 (0.0%) | 0 (0.0%) |
| College or Associate's Degree | 0 (0.0%) | 13 (100.0%) |
| Bachelor's Degree | 0 (0.0%) | 0 (0.0%) |
| Graduate Degree | 18 (100.0%) | 0 (0.0%) |
| Total | 18 (58.1%) | 13 (41.9%) |
Employment Characteristics in McDonald
Employment by Class of Employer in McDonald
Among the 1,519 employed individuals in McDonald, private company employees (1,102 | 72.6%), local government employees (163 | 10.7%), and not-for-profit organizations (115 | 7.6%) make up the most common classes of employment.
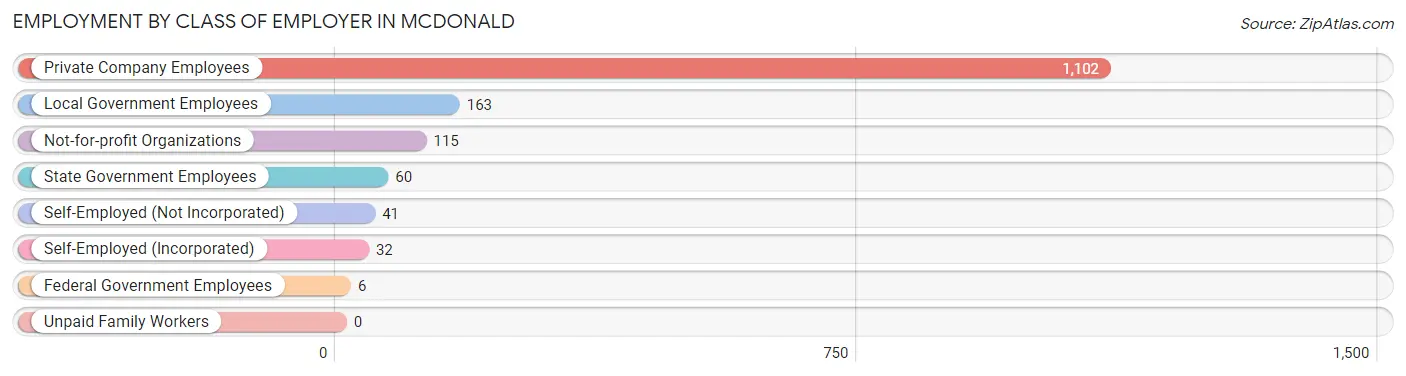
| Employer Class | # Employees | % Employees |
| Private Company Employees | 1,102 | 72.6% |
| Self-Employed (Incorporated) | 32 | 2.1% |
| Self-Employed (Not Incorporated) | 41 | 2.7% |
| Not-for-profit Organizations | 115 | 7.6% |
| Local Government Employees | 163 | 10.7% |
| State Government Employees | 60 | 4.0% |
| Federal Government Employees | 6 | 0.4% |
| Unpaid Family Workers | 0 | 0.0% |
| Total | 1,519 | 100.0% |
Employment Status by Age in McDonald
According to the labor force statistics for McDonald, out of the total population over 16 years of age (2,650), 59.5% or 1,577 individuals are in the labor force, with 2.5% or 39 of them unemployed. The age group with the highest labor force participation rate is 20 to 24 years, with 100.0% or 192 individuals in the labor force. Within the labor force, the 30 to 34 years age range has the highest percentage of unemployed individuals, with 11.6% or 18 of them being unemployed.
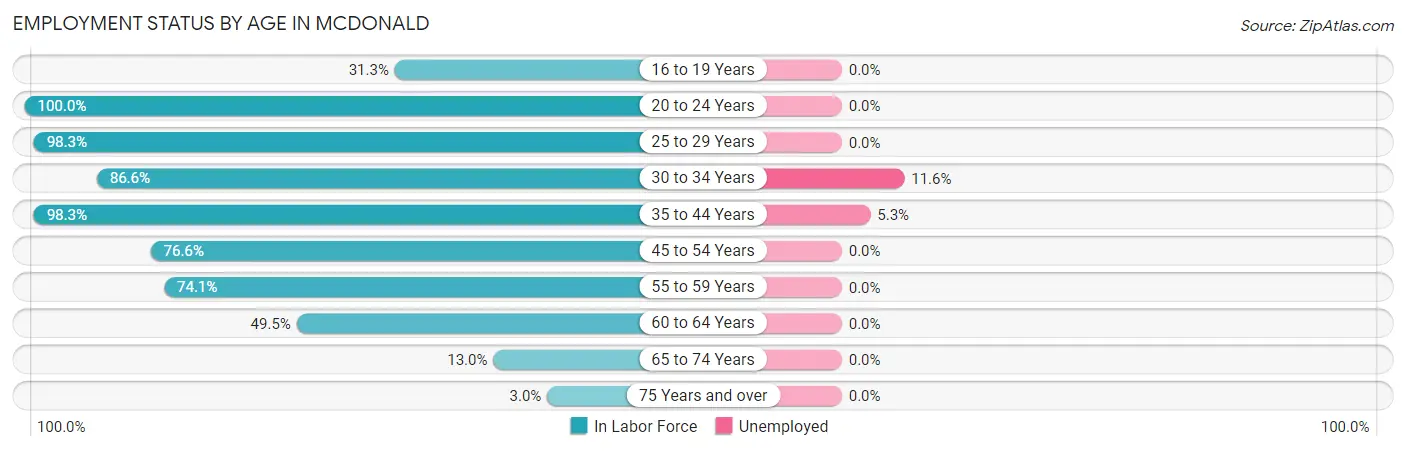
| Age Bracket | In Labor Force | Unemployed |
| 16 to 19 Years | 71 (31.3%) | 0 (0.0%) |
| 20 to 24 Years | 192 (100.0%) | 0 (0.0%) |
| 25 to 29 Years | 119 (98.3%) | 0 (0.0%) |
| 30 to 34 Years | 155 (86.6%) | 18 (11.6%) |
| 35 to 44 Years | 413 (98.3%) | 22 (5.3%) |
| 45 to 54 Years | 278 (76.6%) | 0 (0.0%) |
| 55 to 59 Years | 149 (74.1%) | 0 (0.0%) |
| 60 to 64 Years | 156 (49.5%) | 0 (0.0%) |
| 65 to 74 Years | 34 (13.0%) | 0 (0.0%) |
| 75 Years and over | 11 (3.0%) | 0 (0.0%) |
| Total | 1,577 (59.5%) | 39 (2.5%) |
Employment Status by Educational Attainment in McDonald
According to labor force statistics for McDonald, 79.4% of individuals (1,270) out of the total population between 25 and 64 years of age (1,599) are in the labor force, with 3.1% or 39 of them being unemployed. The group with the highest labor force participation rate are those with the educational attainment of bachelor's degree or higher, with 91.4% or 477 individuals in the labor force. Within the labor force, individuals with college / associate degree education have the highest percentage of unemployment, with 5.4% or 22 of them being unemployed.
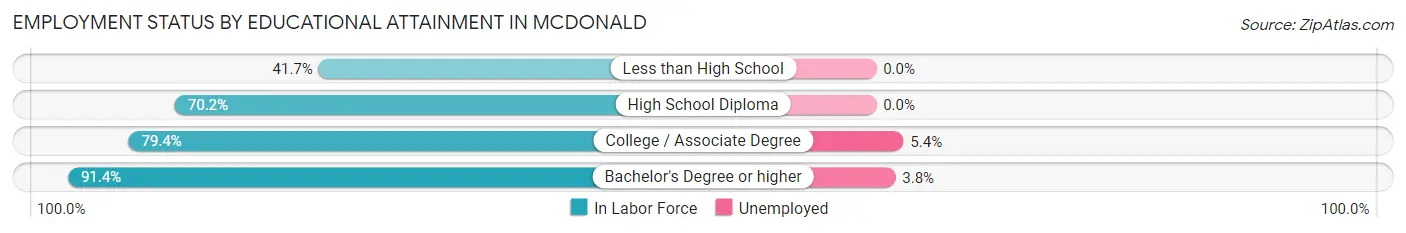
| Educational Attainment | In Labor Force | Unemployed |
| Less than High School | 15 (41.7%) | 0 (0.0%) |
| High School Diploma | 369 (70.2%) | 0 (0.0%) |
| College / Associate Degree | 409 (79.4%) | 28 (5.4%) |
| Bachelor's Degree or higher | 477 (91.4%) | 20 (3.8%) |
| Total | 1,270 (79.4%) | 50 (3.1%) |
Employment Occupations by Sex in McDonald
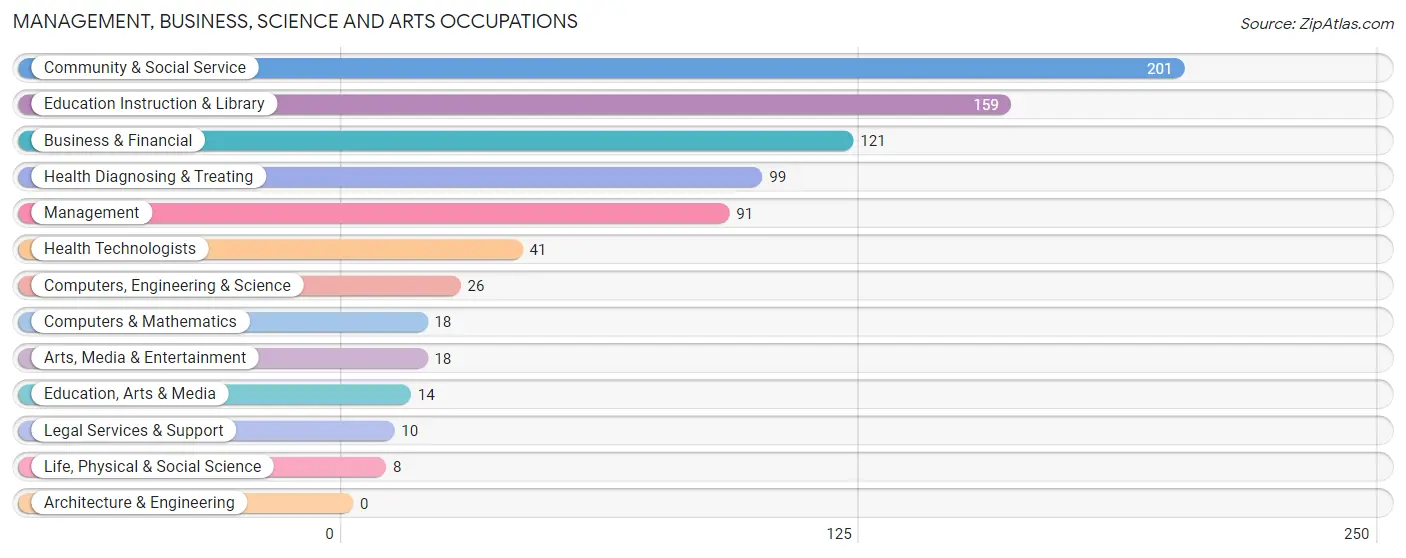
Management, Business, Science and Arts Occupations
The most common Management, Business, Science and Arts occupations in McDonald are Community & Social Service (201 | 13.1%), Education Instruction & Library (159 | 10.4%), Business & Financial (121 | 7.9%), Health Diagnosing & Treating (99 | 6.5%), and Management (91 | 5.9%).
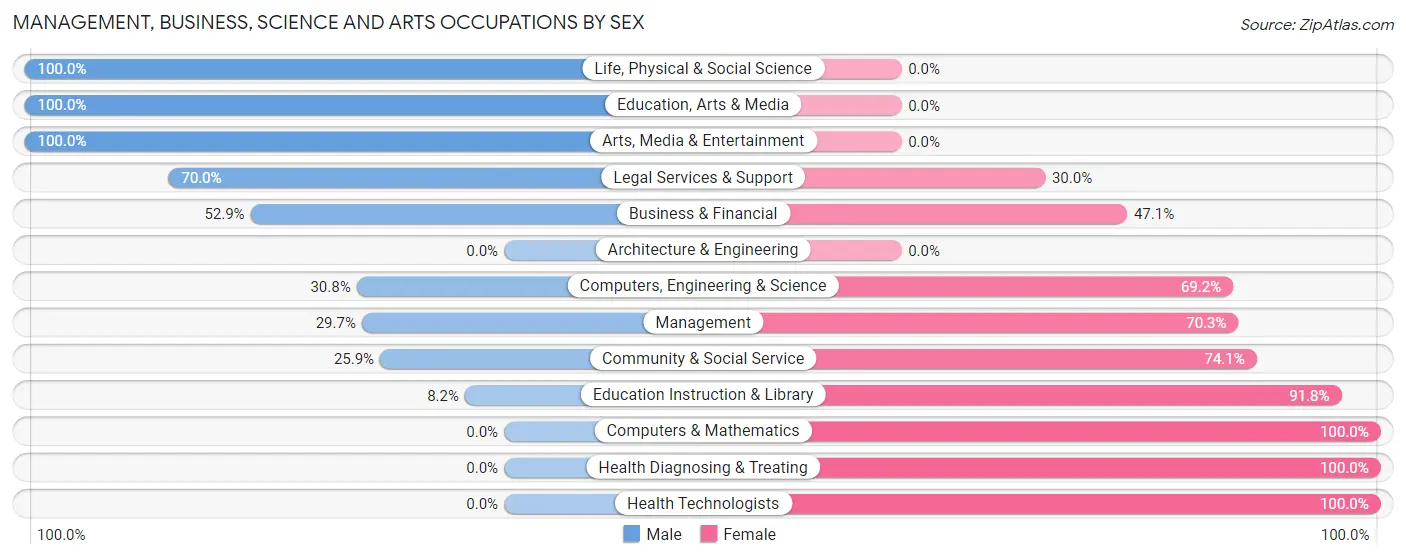
Management, Business, Science and Arts Occupations by Sex
Within the Management, Business, Science and Arts occupations in McDonald, the most male-oriented occupations are Life, Physical & Social Science (100.0%), Education, Arts & Media (100.0%), and Arts, Media & Entertainment (100.0%), while the most female-oriented occupations are Computers & Mathematics (100.0%), Health Diagnosing & Treating (100.0%), and Health Technologists (100.0%).
| Occupation | Male | Female |
| Management | 27 (29.7%) | 64 (70.3%) |
| Business & Financial | 64 (52.9%) | 57 (47.1%) |
| Computers, Engineering & Science | 8 (30.8%) | 18 (69.2%) |
| Computers & Mathematics | 0 (0.0%) | 18 (100.0%) |
| Architecture & Engineering | 0 (0.0%) | 0 (0.0%) |
| Life, Physical & Social Science | 8 (100.0%) | 0 (0.0%) |
| Community & Social Service | 52 (25.9%) | 149 (74.1%) |
| Education, Arts & Media | 14 (100.0%) | 0 (0.0%) |
| Legal Services & Support | 7 (70.0%) | 3 (30.0%) |
| Education Instruction & Library | 13 (8.2%) | 146 (91.8%) |
| Arts, Media & Entertainment | 18 (100.0%) | 0 (0.0%) |
| Health Diagnosing & Treating | 0 (0.0%) | 99 (100.0%) |
| Health Technologists | 0 (0.0%) | 41 (100.0%) |
| Total (Category) | 151 (28.1%) | 387 (71.9%) |
| Total (Overall) | 741 (48.3%) | 794 (51.7%) |
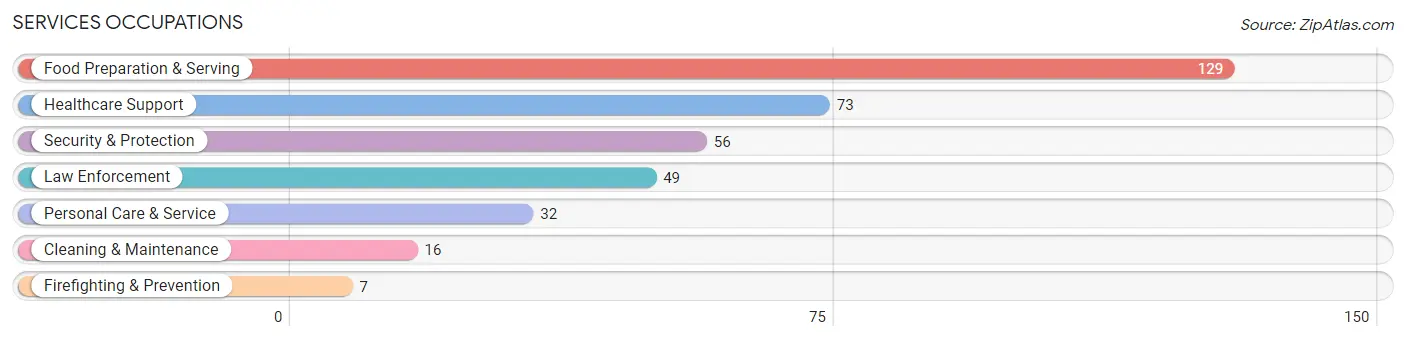
Services Occupations
The most common Services occupations in McDonald are Food Preparation & Serving (129 | 8.4%), Healthcare Support (73 | 4.8%), Security & Protection (56 | 3.6%), Law Enforcement (49 | 3.2%), and Personal Care & Service (32 | 2.1%).
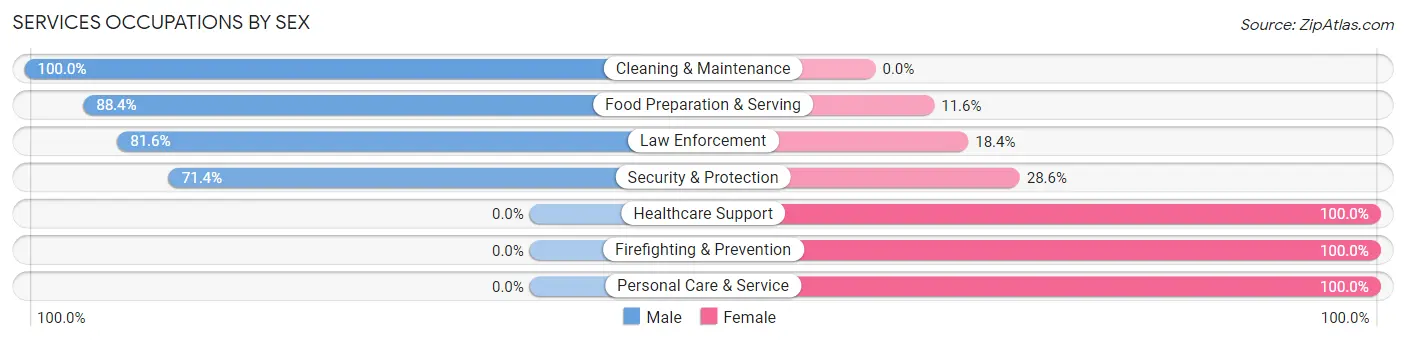
Services Occupations by Sex
Within the Services occupations in McDonald, the most male-oriented occupations are Cleaning & Maintenance (100.0%), Food Preparation & Serving (88.4%), and Law Enforcement (81.6%), while the most female-oriented occupations are Healthcare Support (100.0%), Firefighting & Prevention (100.0%), and Personal Care & Service (100.0%).
| Occupation | Male | Female |
| Healthcare Support | 0 (0.0%) | 73 (100.0%) |
| Security & Protection | 40 (71.4%) | 16 (28.6%) |
| Firefighting & Prevention | 0 (0.0%) | 7 (100.0%) |
| Law Enforcement | 40 (81.6%) | 9 (18.4%) |
| Food Preparation & Serving | 114 (88.4%) | 15 (11.6%) |
| Cleaning & Maintenance | 16 (100.0%) | 0 (0.0%) |
| Personal Care & Service | 0 (0.0%) | 32 (100.0%) |
| Total (Category) | 170 (55.6%) | 136 (44.4%) |
| Total (Overall) | 741 (48.3%) | 794 (51.7%) |
Sales and Office Occupations
The most common Sales and Office occupations in McDonald are Sales & Related (166 | 10.8%), and Office & Administration (143 | 9.3%).

Sales and Office Occupations by Sex
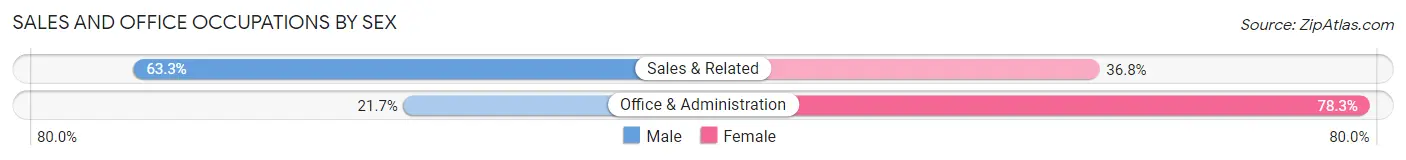
| Occupation | Male | Female |
| Sales & Related | 105 (63.2%) | 61 (36.7%) |
| Office & Administration | 31 (21.7%) | 112 (78.3%) |
| Total (Category) | 136 (44.0%) | 173 (56.0%) |
| Total (Overall) | 741 (48.3%) | 794 (51.7%) |
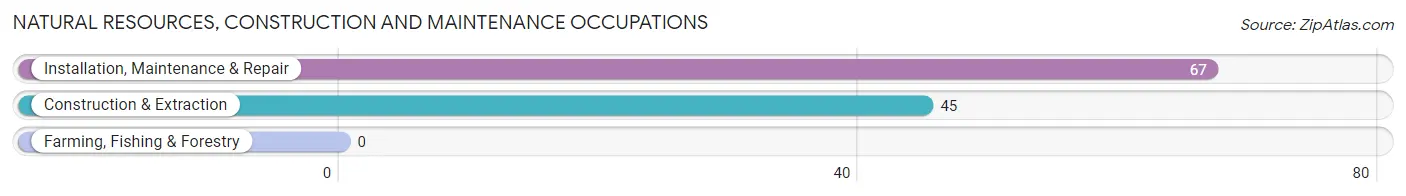
Natural Resources, Construction and Maintenance Occupations
The most common Natural Resources, Construction and Maintenance occupations in McDonald are Installation, Maintenance & Repair (67 | 4.4%), and Construction & Extraction (45 | 2.9%).
Natural Resources, Construction and Maintenance Occupations by Sex
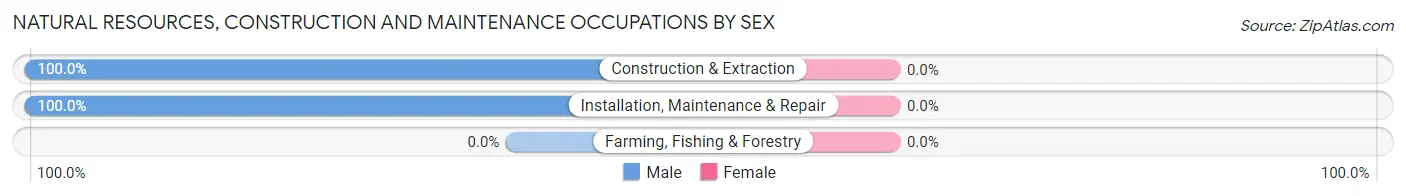
| Occupation | Male | Female |
| Farming, Fishing & Forestry | 0 (0.0%) | 0 (0.0%) |
| Construction & Extraction | 45 (100.0%) | 0 (0.0%) |
| Installation, Maintenance & Repair | 67 (100.0%) | 0 (0.0%) |
| Total (Category) | 112 (100.0%) | 0 (0.0%) |
| Total (Overall) | 741 (48.3%) | 794 (51.7%) |
Production, Transportation and Moving Occupations
The most common Production, Transportation and Moving occupations in McDonald are Material Moving (162 | 10.5%), Production (66 | 4.3%), and Transportation (42 | 2.7%).
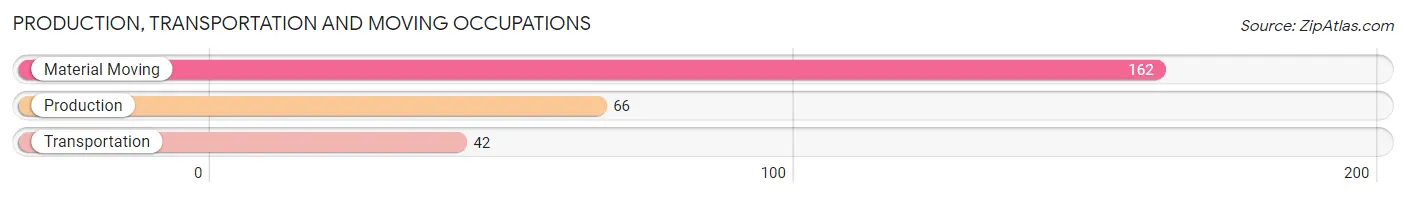
Production, Transportation and Moving Occupations by Sex
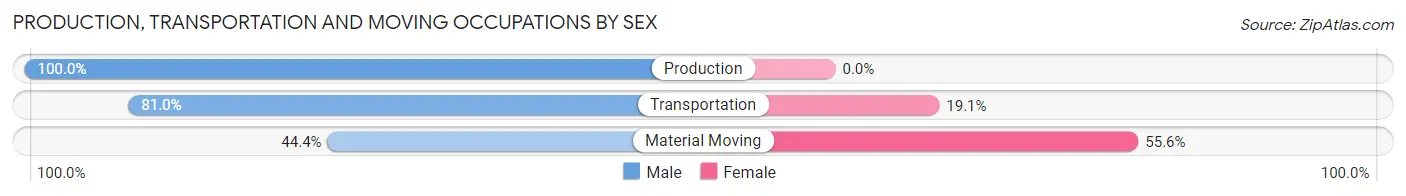
| Occupation | Male | Female |
| Production | 66 (100.0%) | 0 (0.0%) |
| Transportation | 34 (80.9%) | 8 (19.1%) |
| Material Moving | 72 (44.4%) | 90 (55.6%) |
| Total (Category) | 172 (63.7%) | 98 (36.3%) |
| Total (Overall) | 741 (48.3%) | 794 (51.7%) |
Employment Industries by Sex in McDonald
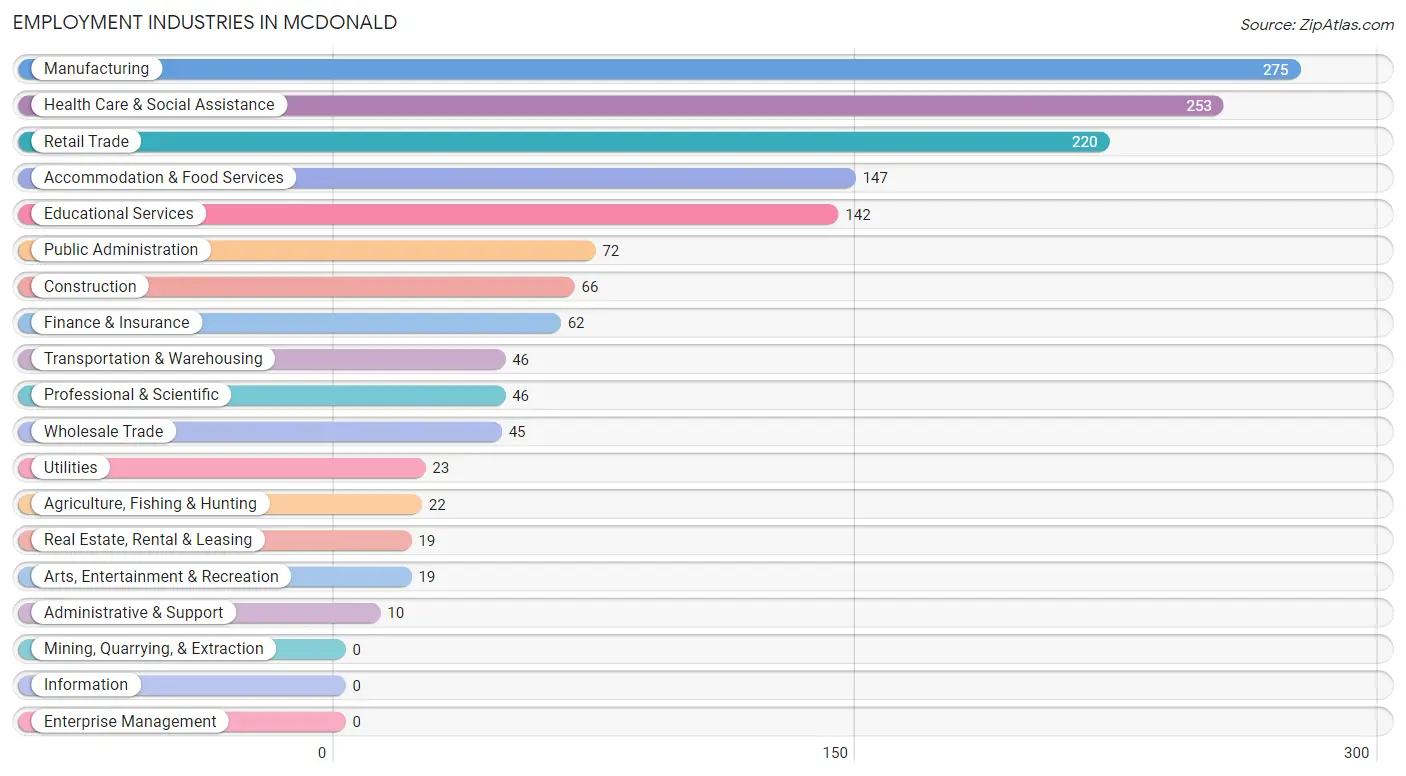
Employment Industries in McDonald
The major employment industries in McDonald include Manufacturing (275 | 17.9%), Health Care & Social Assistance (253 | 16.5%), Retail Trade (220 | 14.3%), Accommodation & Food Services (147 | 9.6%), and Educational Services (142 | 9.2%).
Employment Industries by Sex in McDonald
The McDonald industries that see more men than women are Wholesale Trade (100.0%), Real Estate, Rental & Leasing (100.0%), and Administrative & Support (100.0%), whereas the industries that tend to have a higher number of women are Agriculture, Fishing & Hunting (100.0%), Educational Services (97.2%), and Health Care & Social Assistance (89.7%).
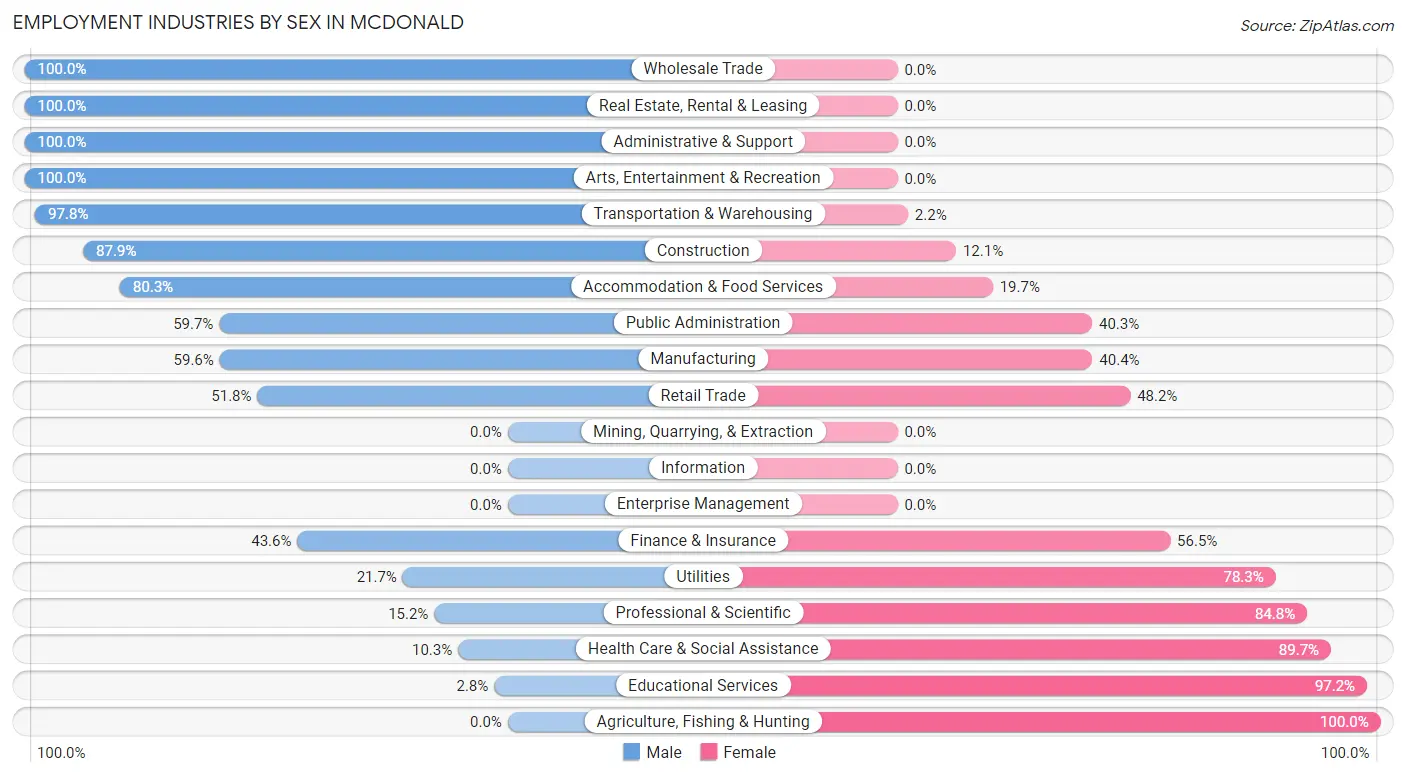
| Industry | Male | Female |
| Agriculture, Fishing & Hunting | 0 (0.0%) | 22 (100.0%) |
| Mining, Quarrying, & Extraction | 0 (0.0%) | 0 (0.0%) |
| Construction | 58 (87.9%) | 8 (12.1%) |
| Manufacturing | 164 (59.6%) | 111 (40.4%) |
| Wholesale Trade | 45 (100.0%) | 0 (0.0%) |
| Retail Trade | 114 (51.8%) | 106 (48.2%) |
| Transportation & Warehousing | 45 (97.8%) | 1 (2.2%) |
| Utilities | 5 (21.7%) | 18 (78.3%) |
| Information | 0 (0.0%) | 0 (0.0%) |
| Finance & Insurance | 27 (43.5%) | 35 (56.5%) |
| Real Estate, Rental & Leasing | 19 (100.0%) | 0 (0.0%) |
| Professional & Scientific | 7 (15.2%) | 39 (84.8%) |
| Enterprise Management | 0 (0.0%) | 0 (0.0%) |
| Administrative & Support | 10 (100.0%) | 0 (0.0%) |
| Educational Services | 4 (2.8%) | 138 (97.2%) |
| Health Care & Social Assistance | 26 (10.3%) | 227 (89.7%) |
| Arts, Entertainment & Recreation | 19 (100.0%) | 0 (0.0%) |
| Accommodation & Food Services | 118 (80.3%) | 29 (19.7%) |
| Public Administration | 43 (59.7%) | 29 (40.3%) |
| Total | 741 (48.3%) | 794 (51.7%) |
Education in McDonald
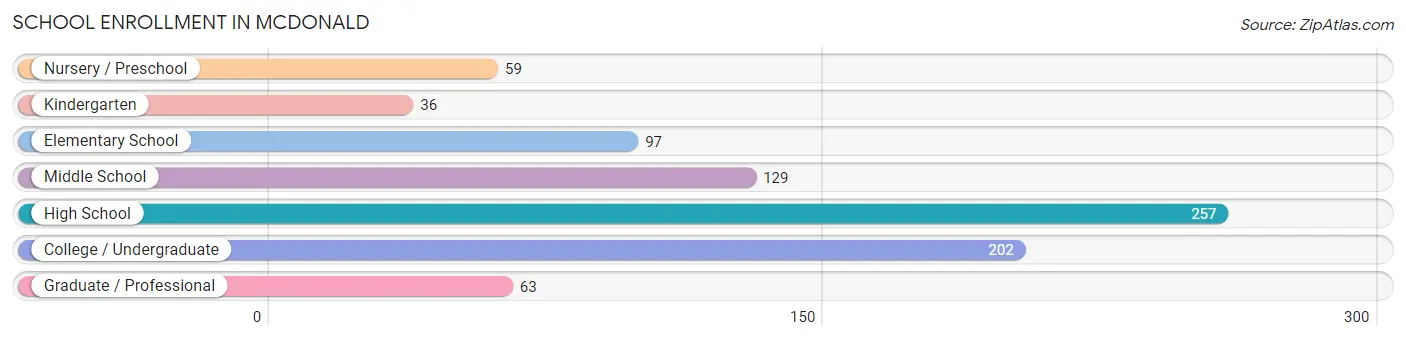
School Enrollment in McDonald
The most common levels of schooling among the 843 students in McDonald are high school (257 | 30.5%), college / undergraduate (202 | 24.0%), and middle school (129 | 15.3%).
| School Level | # Students | % Students |
| Nursery / Preschool | 59 | 7.0% |
| Kindergarten | 36 | 4.3% |
| Elementary School | 97 | 11.5% |
| Middle School | 129 | 15.3% |
| High School | 257 | 30.5% |
| College / Undergraduate | 202 | 24.0% |
| Graduate / Professional | 63 | 7.5% |
| Total | 843 | 100.0% |
School Enrollment by Age by Funding Source in McDonald
Out of a total of 843 students who are enrolled in schools in McDonald, 117 (13.9%) attend a private institution, while the remaining 726 (86.1%) are enrolled in public schools. The age group of 35 years and over has the highest likelihood of being enrolled in private schools, with 23 (100.0% in the age bracket) enrolled. Conversely, the age group of 3 to 4 year olds has the lowest likelihood of being enrolled in a private school, with 59 (100.0% in the age bracket) attending a public institution.
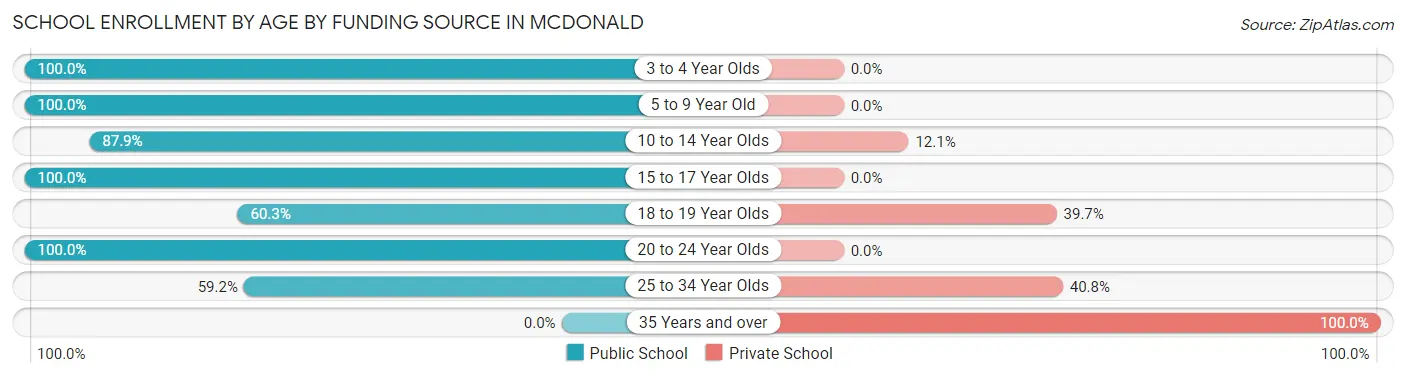
| Age Bracket | Public School | Private School |
| 3 to 4 Year Olds | 59 (100.0%) | 0 (0.0%) |
| 5 to 9 Year Old | 103 (100.0%) | 0 (0.0%) |
| 10 to 14 Year Olds | 204 (87.9%) | 28 (12.1%) |
| 15 to 17 Year Olds | 153 (100.0%) | 0 (0.0%) |
| 18 to 19 Year Olds | 70 (60.3%) | 46 (39.7%) |
| 20 to 24 Year Olds | 108 (100.0%) | 0 (0.0%) |
| 25 to 34 Year Olds | 29 (59.2%) | 20 (40.8%) |
| 35 Years and over | 0 (0.0%) | 23 (100.0%) |
| Total | 726 (86.1%) | 117 (13.9%) |
Educational Attainment by Field of Study in McDonald
Business (154 | 23.4%), education (126 | 19.2%), science & technology (84 | 12.8%), arts & humanities (60 | 9.1%), and social sciences (59 | 9.0%) are the most common fields of study among 658 individuals in McDonald who have obtained a bachelor's degree or higher.
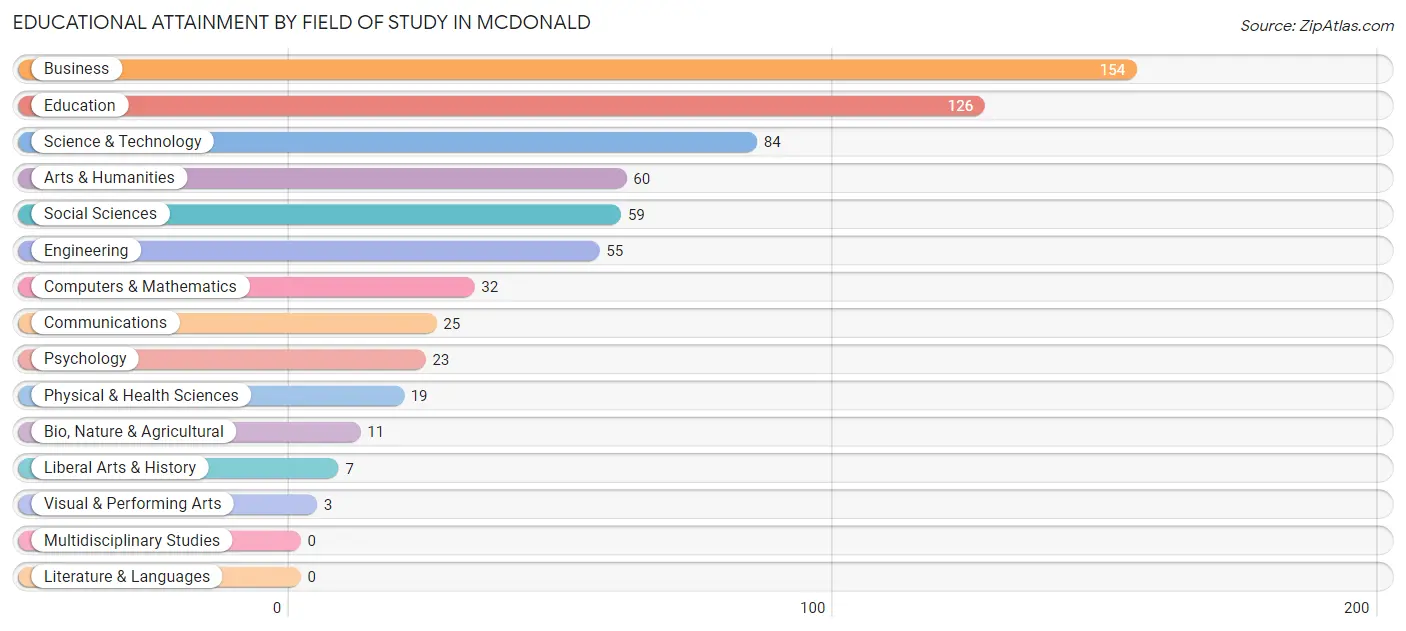
| Field of Study | # Graduates | % Graduates |
| Computers & Mathematics | 32 | 4.9% |
| Bio, Nature & Agricultural | 11 | 1.7% |
| Physical & Health Sciences | 19 | 2.9% |
| Psychology | 23 | 3.5% |
| Social Sciences | 59 | 9.0% |
| Engineering | 55 | 8.4% |
| Multidisciplinary Studies | 0 | 0.0% |
| Science & Technology | 84 | 12.8% |
| Business | 154 | 23.4% |
| Education | 126 | 19.2% |
| Literature & Languages | 0 | 0.0% |
| Liberal Arts & History | 7 | 1.1% |
| Visual & Performing Arts | 3 | 0.5% |
| Communications | 25 | 3.8% |
| Arts & Humanities | 60 | 9.1% |
| Total | 658 | 100.0% |
Transportation & Commute in McDonald
Vehicle Availability by Sex in McDonald
The most prevalent vehicle ownership categories in McDonald are males with 2 vehicles (477, accounting for 64.1%) and females with 2 vehicles (411, making up 61.6%).
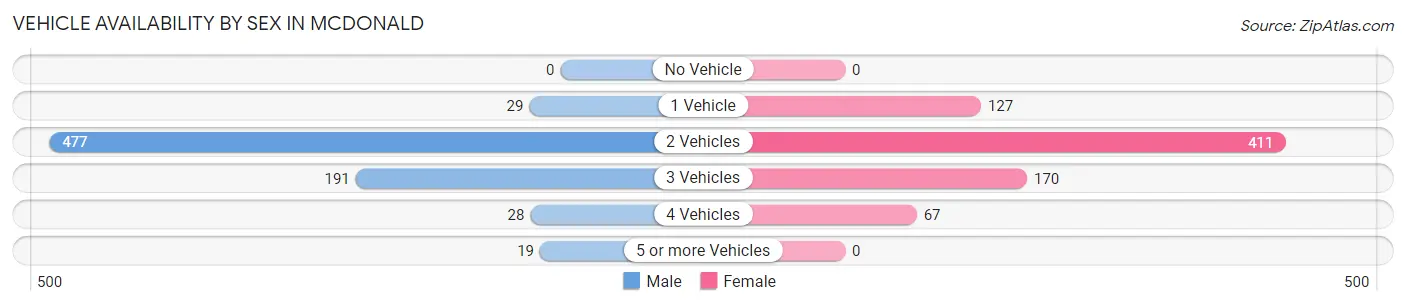
| Vehicles Available | Male | Female |
| No Vehicle | 0 (0.0%) | 0 (0.0%) |
| 1 Vehicle | 29 (3.9%) | 127 (16.4%) |
| 2 Vehicles | 477 (64.1%) | 411 (53.0%) |
| 3 Vehicles | 191 (25.7%) | 170 (21.9%) |
| 4 Vehicles | 28 (3.8%) | 67 (8.6%) |
| 5 or more Vehicles | 19 (2.5%) | 0 (0.0%) |
| Total | 744 (100.0%) | 775 (100.0%) |
Commute Time in McDonald
The most frequently occuring commute durations in McDonald are 20 to 24 minutes (427 commuters, 28.8%), 10 to 14 minutes (263 commuters, 17.7%), and 15 to 19 minutes (245 commuters, 16.5%).
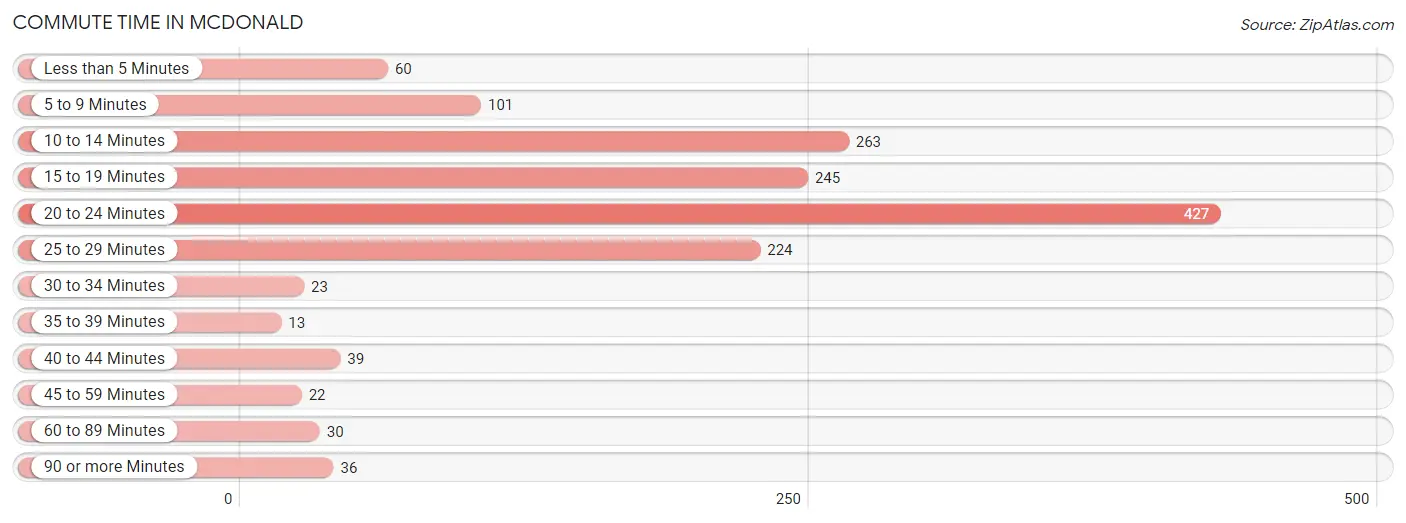
| Commute Time | # Commuters | % Commuters |
| Less than 5 Minutes | 60 | 4.1% |
| 5 to 9 Minutes | 101 | 6.8% |
| 10 to 14 Minutes | 263 | 17.7% |
| 15 to 19 Minutes | 245 | 16.5% |
| 20 to 24 Minutes | 427 | 28.8% |
| 25 to 29 Minutes | 224 | 15.1% |
| 30 to 34 Minutes | 23 | 1.5% |
| 35 to 39 Minutes | 13 | 0.9% |
| 40 to 44 Minutes | 39 | 2.6% |
| 45 to 59 Minutes | 22 | 1.5% |
| 60 to 89 Minutes | 30 | 2.0% |
| 90 or more Minutes | 36 | 2.4% |
Commute Time by Sex in McDonald
The most common commute times in McDonald are 10 to 14 minutes (162 commuters, 22.6%) for males and 20 to 24 minutes (280 commuters, 36.5%) for females.
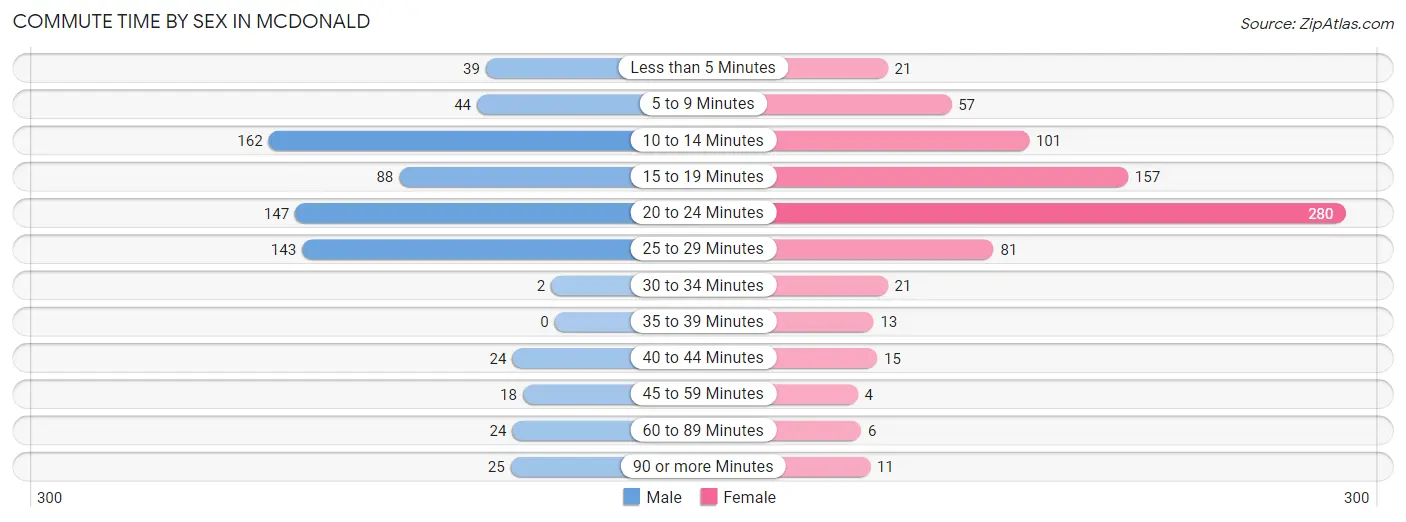
| Commute Time | Male | Female |
| Less than 5 Minutes | 39 (5.4%) | 21 (2.7%) |
| 5 to 9 Minutes | 44 (6.1%) | 57 (7.4%) |
| 10 to 14 Minutes | 162 (22.6%) | 101 (13.2%) |
| 15 to 19 Minutes | 88 (12.3%) | 157 (20.5%) |
| 20 to 24 Minutes | 147 (20.5%) | 280 (36.5%) |
| 25 to 29 Minutes | 143 (20.0%) | 81 (10.6%) |
| 30 to 34 Minutes | 2 (0.3%) | 21 (2.7%) |
| 35 to 39 Minutes | 0 (0.0%) | 13 (1.7%) |
| 40 to 44 Minutes | 24 (3.4%) | 15 (2.0%) |
| 45 to 59 Minutes | 18 (2.5%) | 4 (0.5%) |
| 60 to 89 Minutes | 24 (3.4%) | 6 (0.8%) |
| 90 or more Minutes | 25 (3.5%) | 11 (1.4%) |
Time of Departure to Work by Sex in McDonald
The most frequent times of departure to work in McDonald are 4:00 PM to 11:59 PM (161, 22.5%) for males and 7:30 AM to 7:59 AM (157, 20.5%) for females.
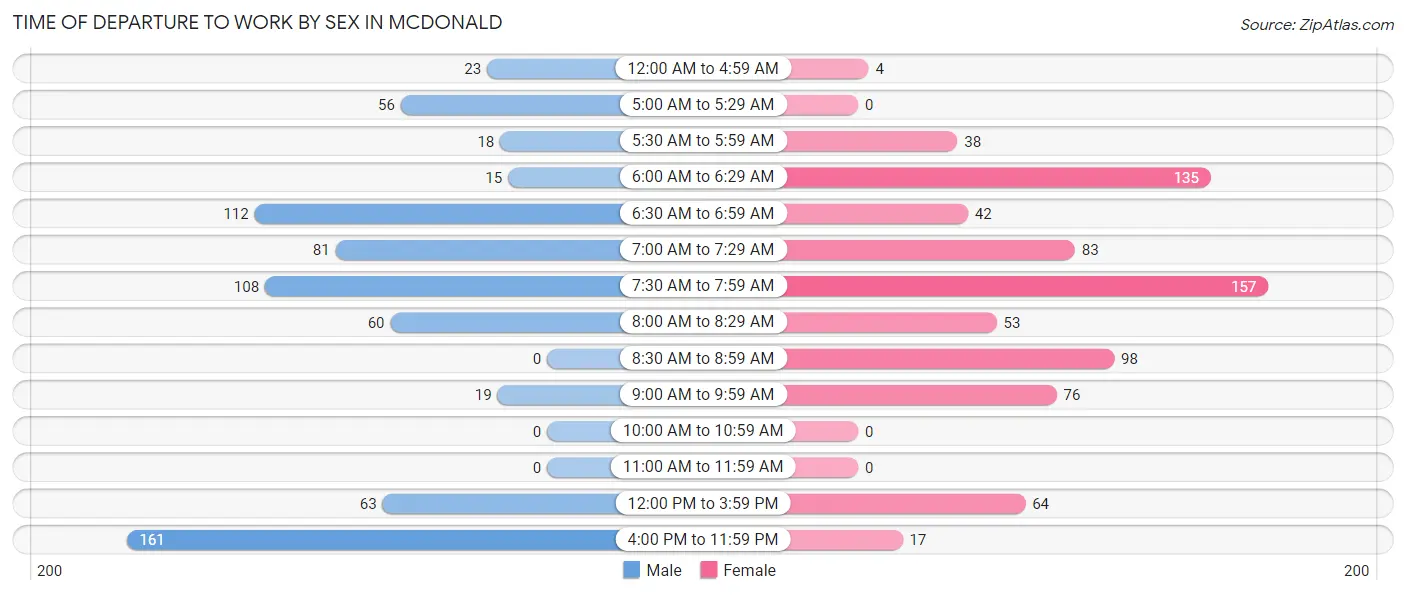
| Time of Departure | Male | Female |
| 12:00 AM to 4:59 AM | 23 (3.2%) | 4 (0.5%) |
| 5:00 AM to 5:29 AM | 56 (7.8%) | 0 (0.0%) |
| 5:30 AM to 5:59 AM | 18 (2.5%) | 38 (5.0%) |
| 6:00 AM to 6:29 AM | 15 (2.1%) | 135 (17.6%) |
| 6:30 AM to 6:59 AM | 112 (15.6%) | 42 (5.5%) |
| 7:00 AM to 7:29 AM | 81 (11.3%) | 83 (10.8%) |
| 7:30 AM to 7:59 AM | 108 (15.1%) | 157 (20.5%) |
| 8:00 AM to 8:29 AM | 60 (8.4%) | 53 (6.9%) |
| 8:30 AM to 8:59 AM | 0 (0.0%) | 98 (12.8%) |
| 9:00 AM to 9:59 AM | 19 (2.6%) | 76 (9.9%) |
| 10:00 AM to 10:59 AM | 0 (0.0%) | 0 (0.0%) |
| 11:00 AM to 11:59 AM | 0 (0.0%) | 0 (0.0%) |
| 12:00 PM to 3:59 PM | 63 (8.8%) | 64 (8.3%) |
| 4:00 PM to 11:59 PM | 161 (22.5%) | 17 (2.2%) |
| Total | 716 (100.0%) | 767 (100.0%) |
Housing Occupancy in McDonald
Occupancy by Ownership in McDonald
Of the total 1,350 dwellings in McDonald, owner-occupied units account for 1,172 (86.8%), while renter-occupied units make up 178 (13.2%).
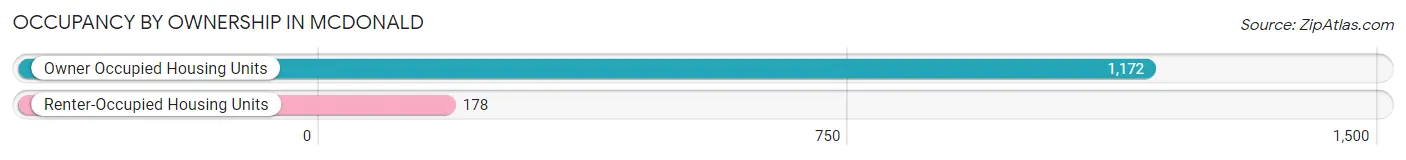
| Occupancy | # Housing Units | % Housing Units |
| Owner Occupied Housing Units | 1,172 | 86.8% |
| Renter-Occupied Housing Units | 178 | 13.2% |
| Total Occupied Housing Units | 1,350 | 100.0% |
Occupancy by Household Size in McDonald
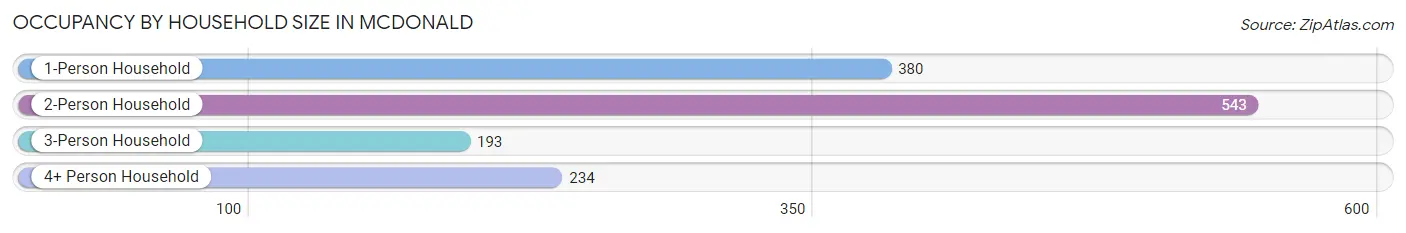
| Household Size | # Housing Units | % Housing Units |
| 1-Person Household | 380 | 28.1% |
| 2-Person Household | 543 | 40.2% |
| 3-Person Household | 193 | 14.3% |
| 4+ Person Household | 234 | 17.3% |
| Total Housing Units | 1,350 | 100.0% |
Occupancy by Ownership by Household Size in McDonald
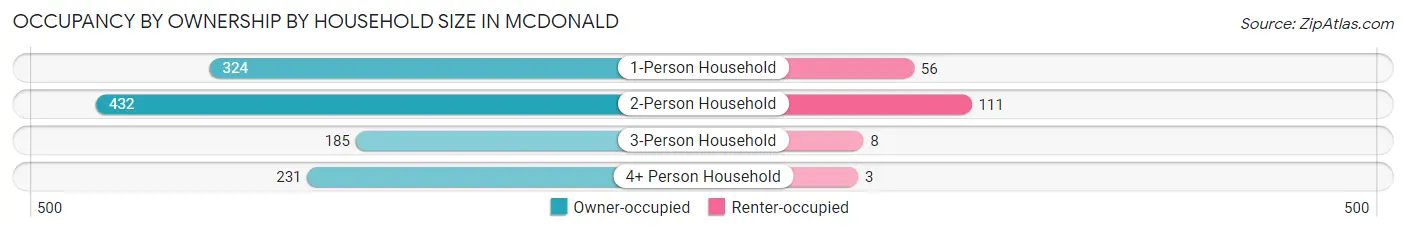
| Household Size | Owner-occupied | Renter-occupied |
| 1-Person Household | 324 (85.3%) | 56 (14.7%) |
| 2-Person Household | 432 (79.6%) | 111 (20.4%) |
| 3-Person Household | 185 (95.9%) | 8 (4.2%) |
| 4+ Person Household | 231 (98.7%) | 3 (1.3%) |
| Total Housing Units | 1,172 (86.8%) | 178 (13.2%) |
Occupancy by Educational Attainment in McDonald
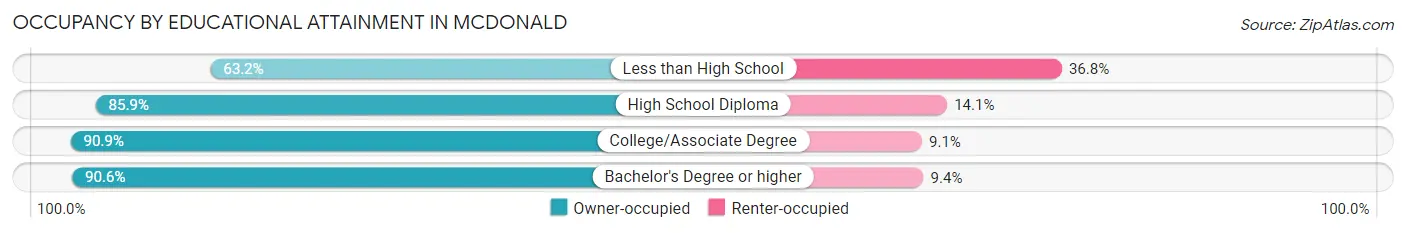
| Household Size | Owner-occupied | Renter-occupied |
| Less than High School | 72 (63.2%) | 42 (36.8%) |
| High School Diploma | 384 (85.9%) | 63 (14.1%) |
| College/Associate Degree | 379 (90.9%) | 38 (9.1%) |
| Bachelor's Degree or higher | 337 (90.6%) | 35 (9.4%) |
Occupancy by Age of Householder in McDonald
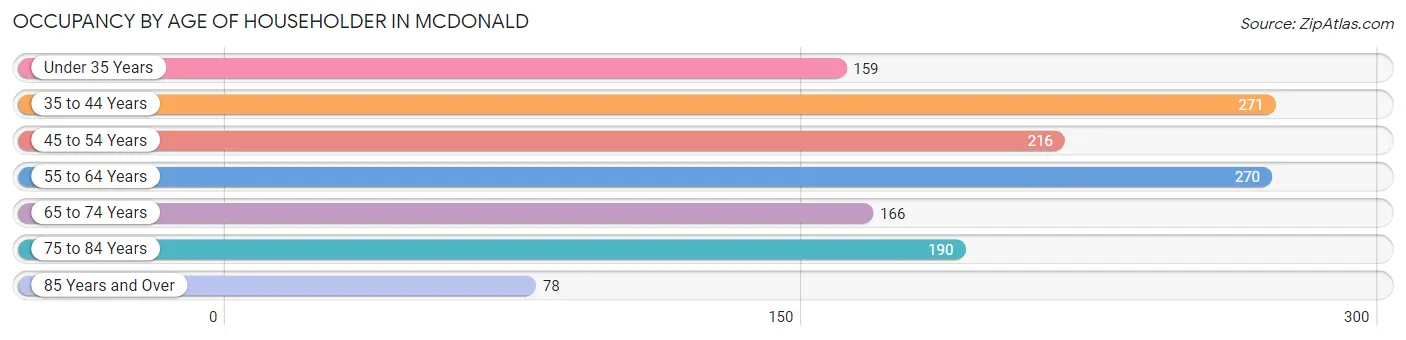
| Age Bracket | # Households | % Households |
| Under 35 Years | 159 | 11.8% |
| 35 to 44 Years | 271 | 20.1% |
| 45 to 54 Years | 216 | 16.0% |
| 55 to 64 Years | 270 | 20.0% |
| 65 to 74 Years | 166 | 12.3% |
| 75 to 84 Years | 190 | 14.1% |
| 85 Years and Over | 78 | 5.8% |
| Total | 1,350 | 100.0% |
Housing Finances in McDonald
Median Income by Occupancy in McDonald
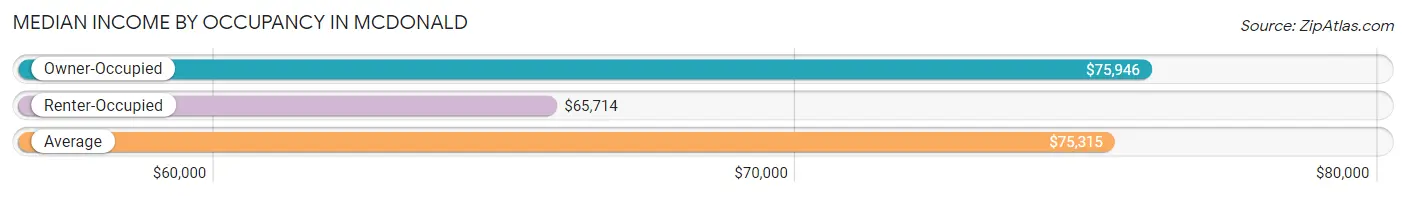
| Occupancy Type | # Households | Median Income |
| Owner-Occupied | 1,172 (86.8%) | $75,946 |
| Renter-Occupied | 178 (13.2%) | $65,714 |
| Average | 1,350 (100.0%) | $75,315 |
Occupancy by Householder Income Bracket in McDonald
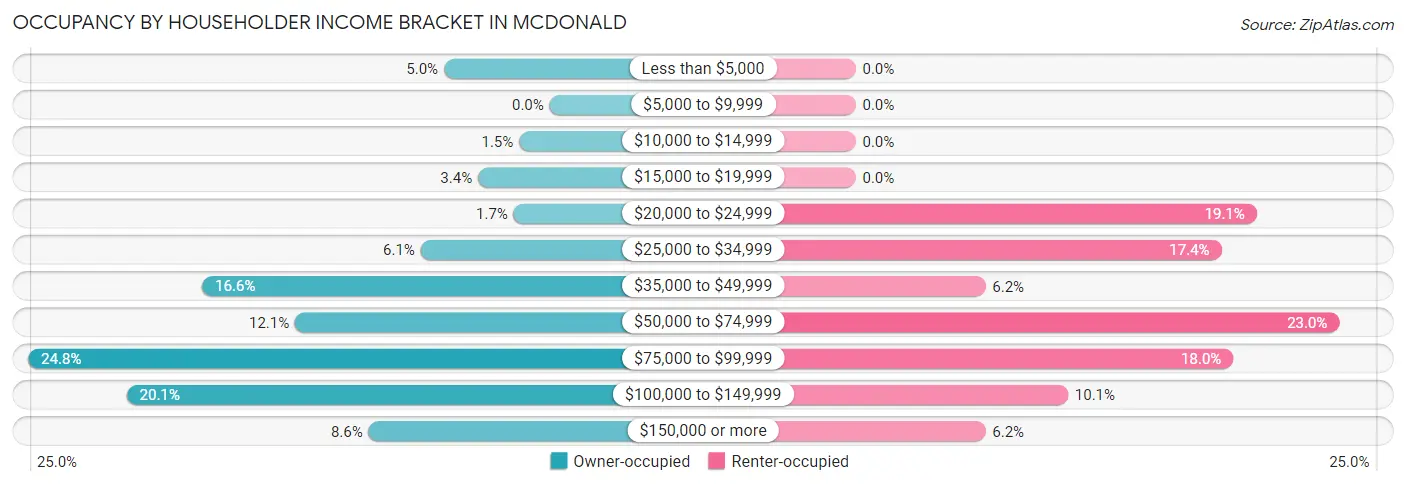
| Income Bracket | Owner-occupied | Renter-occupied |
| Less than $5,000 | 59 (5.0%) | 0 (0.0%) |
| $5,000 to $9,999 | 0 (0.0%) | 0 (0.0%) |
| $10,000 to $14,999 | 17 (1.5%) | 0 (0.0%) |
| $15,000 to $19,999 | 40 (3.4%) | 0 (0.0%) |
| $20,000 to $24,999 | 20 (1.7%) | 34 (19.1%) |
| $25,000 to $34,999 | 72 (6.1%) | 31 (17.4%) |
| $35,000 to $49,999 | 194 (16.6%) | 11 (6.2%) |
| $50,000 to $74,999 | 142 (12.1%) | 41 (23.0%) |
| $75,000 to $99,999 | 291 (24.8%) | 32 (18.0%) |
| $100,000 to $149,999 | 236 (20.1%) | 18 (10.1%) |
| $150,000 or more | 101 (8.6%) | 11 (6.2%) |
| Total | 1,172 (100.0%) | 178 (100.0%) |
Monthly Housing Cost Tiers in McDonald
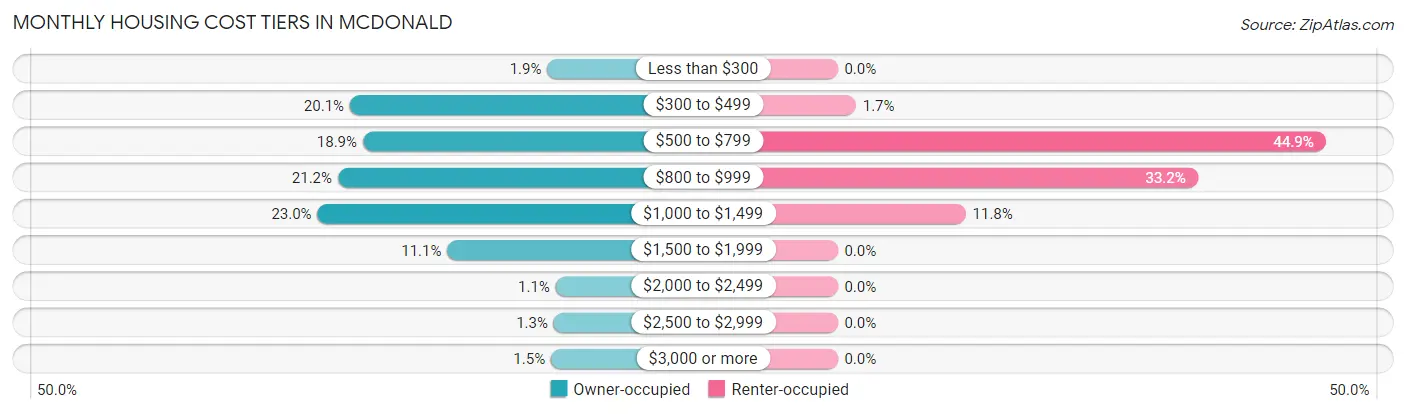
| Monthly Cost | Owner-occupied | Renter-occupied |
| Less than $300 | 22 (1.9%) | 0 (0.0%) |
| $300 to $499 | 235 (20.1%) | 3 (1.7%) |
| $500 to $799 | 221 (18.9%) | 80 (44.9%) |
| $800 to $999 | 248 (21.2%) | 59 (33.2%) |
| $1,000 to $1,499 | 270 (23.0%) | 21 (11.8%) |
| $1,500 to $1,999 | 130 (11.1%) | 0 (0.0%) |
| $2,000 to $2,499 | 13 (1.1%) | 0 (0.0%) |
| $2,500 to $2,999 | 15 (1.3%) | 0 (0.0%) |
| $3,000 or more | 18 (1.5%) | 0 (0.0%) |
| Total | 1,172 (100.0%) | 178 (100.0%) |
Physical Housing Characteristics in McDonald
Housing Structures in McDonald
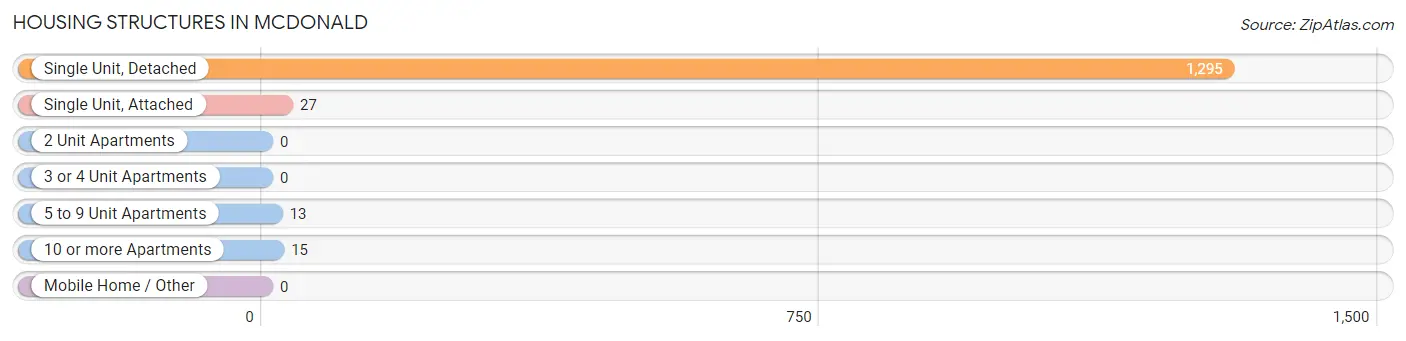
| Structure Type | # Housing Units | % Housing Units |
| Single Unit, Detached | 1,295 | 95.9% |
| Single Unit, Attached | 27 | 2.0% |
| 2 Unit Apartments | 0 | 0.0% |
| 3 or 4 Unit Apartments | 0 | 0.0% |
| 5 to 9 Unit Apartments | 13 | 1.0% |
| 10 or more Apartments | 15 | 1.1% |
| Mobile Home / Other | 0 | 0.0% |
| Total | 1,350 | 100.0% |
Housing Structures by Occupancy in McDonald
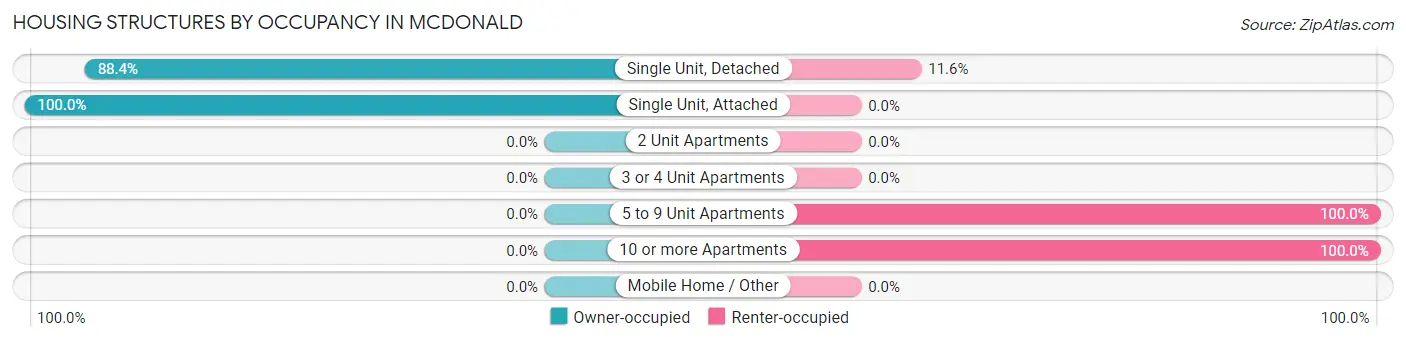
| Structure Type | Owner-occupied | Renter-occupied |
| Single Unit, Detached | 1,145 (88.4%) | 150 (11.6%) |
| Single Unit, Attached | 27 (100.0%) | 0 (0.0%) |
| 2 Unit Apartments | 0 (0.0%) | 0 (0.0%) |
| 3 or 4 Unit Apartments | 0 (0.0%) | 0 (0.0%) |
| 5 to 9 Unit Apartments | 0 (0.0%) | 13 (100.0%) |
| 10 or more Apartments | 0 (0.0%) | 15 (100.0%) |
| Mobile Home / Other | 0 (0.0%) | 0 (0.0%) |
| Total | 1,172 (86.8%) | 178 (13.2%) |
Housing Structures by Number of Rooms in McDonald
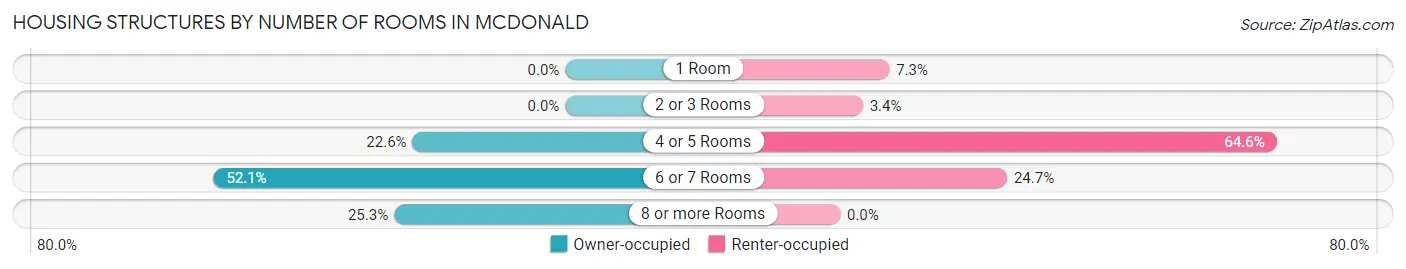
| Number of Rooms | Owner-occupied | Renter-occupied |
| 1 Room | 0 (0.0%) | 13 (7.3%) |
| 2 or 3 Rooms | 0 (0.0%) | 6 (3.4%) |
| 4 or 5 Rooms | 265 (22.6%) | 115 (64.6%) |
| 6 or 7 Rooms | 610 (52.0%) | 44 (24.7%) |
| 8 or more Rooms | 297 (25.3%) | 0 (0.0%) |
| Total | 1,172 (100.0%) | 178 (100.0%) |
Housing Structure by Heating Type in McDonald
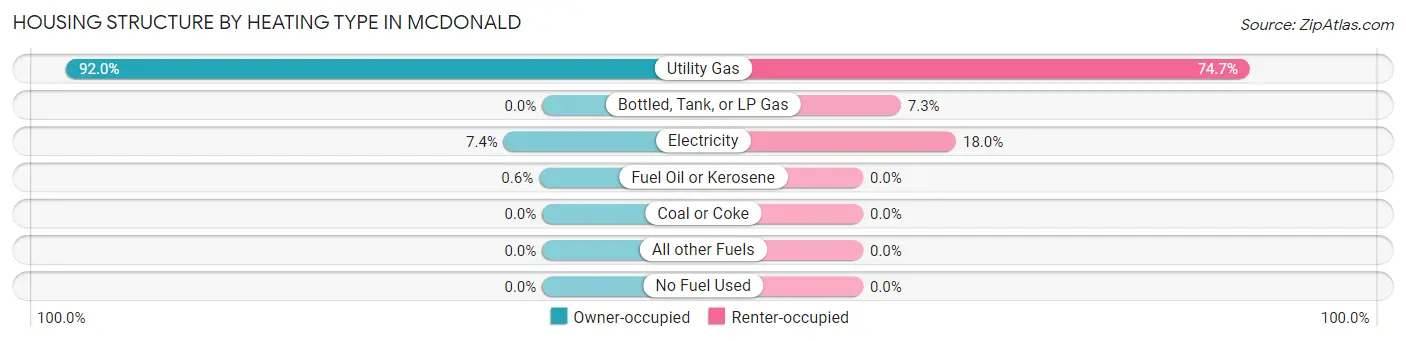
| Heating Type | Owner-occupied | Renter-occupied |
| Utility Gas | 1,078 (92.0%) | 133 (74.7%) |
| Bottled, Tank, or LP Gas | 0 (0.0%) | 13 (7.3%) |
| Electricity | 87 (7.4%) | 32 (18.0%) |
| Fuel Oil or Kerosene | 7 (0.6%) | 0 (0.0%) |
| Coal or Coke | 0 (0.0%) | 0 (0.0%) |
| All other Fuels | 0 (0.0%) | 0 (0.0%) |
| No Fuel Used | 0 (0.0%) | 0 (0.0%) |
| Total | 1,172 (100.0%) | 178 (100.0%) |
Household Vehicle Usage in McDonald
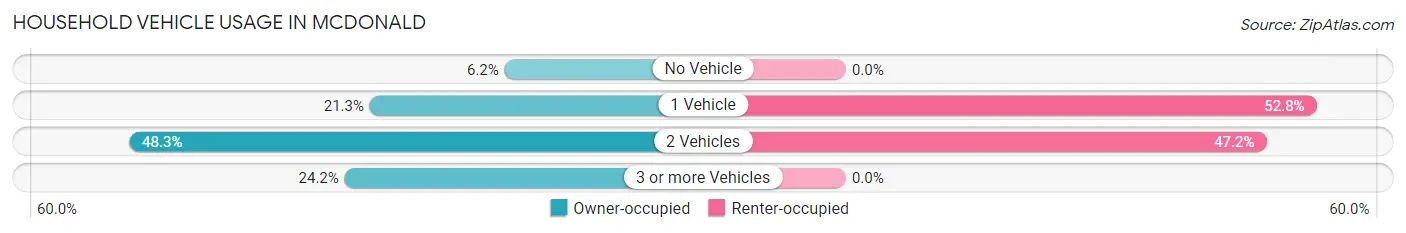
| Vehicles per Household | Owner-occupied | Renter-occupied |
| No Vehicle | 73 (6.2%) | 0 (0.0%) |
| 1 Vehicle | 250 (21.3%) | 94 (52.8%) |
| 2 Vehicles | 566 (48.3%) | 84 (47.2%) |
| 3 or more Vehicles | 283 (24.1%) | 0 (0.0%) |
| Total | 1,172 (100.0%) | 178 (100.0%) |
Real Estate & Mortgages in McDonald
Real Estate and Mortgage Overview in McDonald
| Characteristic | Without Mortgage | With Mortgage |
| Housing Units | 390 | 782 |
| Median Property Value | $132,000 | $120,300 |
| Median Household Income | $52,065 | $88 |
| Monthly Housing Costs | $427 | $18 |
| Real Estate Taxes | $1,837 | $7 |
Property Value by Mortgage Status in McDonald
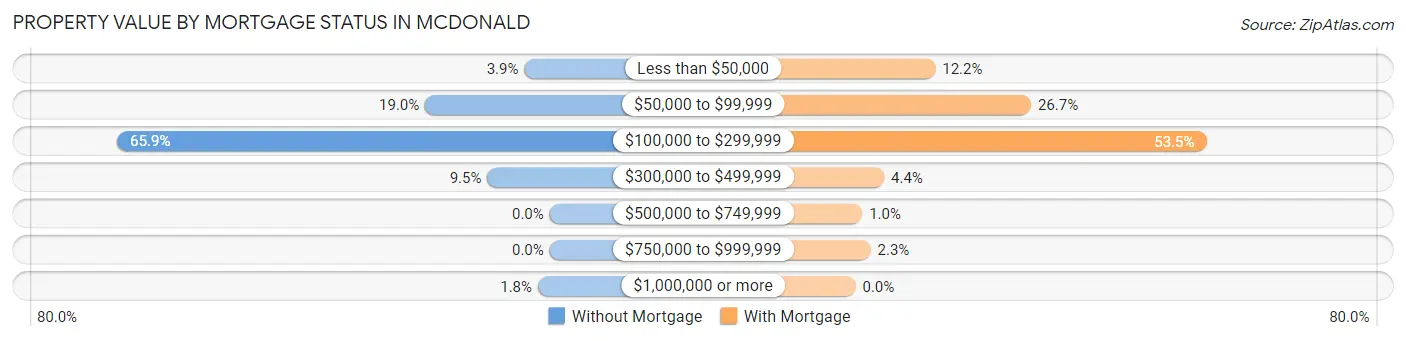
| Property Value | Without Mortgage | With Mortgage |
| Less than $50,000 | 15 (3.8%) | 95 (12.1%) |
| $50,000 to $99,999 | 74 (19.0%) | 209 (26.7%) |
| $100,000 to $299,999 | 257 (65.9%) | 418 (53.4%) |
| $300,000 to $499,999 | 37 (9.5%) | 34 (4.3%) |
| $500,000 to $749,999 | 0 (0.0%) | 8 (1.0%) |
| $750,000 to $999,999 | 0 (0.0%) | 18 (2.3%) |
| $1,000,000 or more | 7 (1.8%) | 0 (0.0%) |
| Total | 390 (100.0%) | 782 (100.0%) |
Household Income by Mortgage Status in McDonald
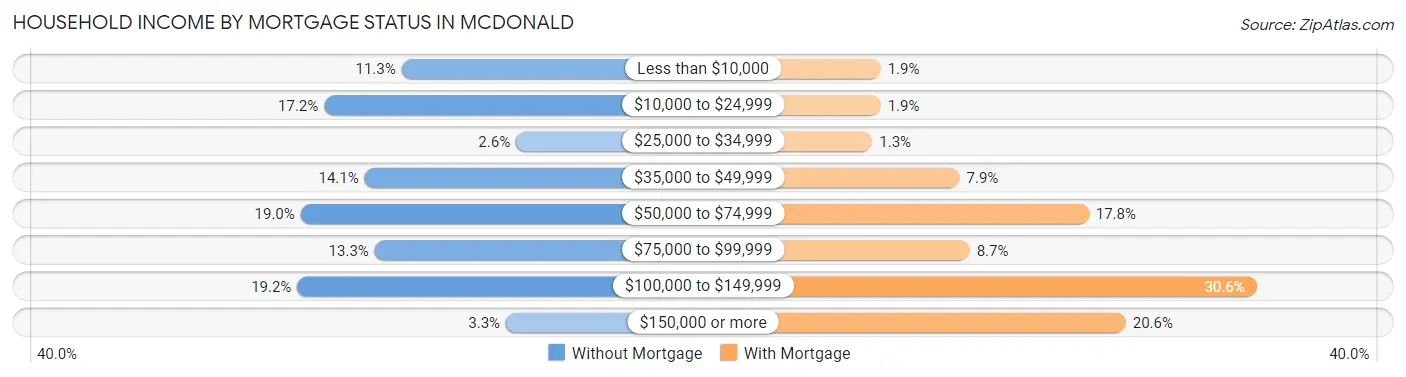
| Household Income | Without Mortgage | With Mortgage |
| Less than $10,000 | 44 (11.3%) | 15 (1.9%) |
| $10,000 to $24,999 | 67 (17.2%) | 15 (1.9%) |
| $25,000 to $34,999 | 10 (2.6%) | 10 (1.3%) |
| $35,000 to $49,999 | 55 (14.1%) | 62 (7.9%) |
| $50,000 to $74,999 | 74 (19.0%) | 139 (17.8%) |
| $75,000 to $99,999 | 52 (13.3%) | 68 (8.7%) |
| $100,000 to $149,999 | 75 (19.2%) | 239 (30.6%) |
| $150,000 or more | 13 (3.3%) | 161 (20.6%) |
| Total | 390 (100.0%) | 782 (100.0%) |
Property Value to Household Income Ratio in McDonald
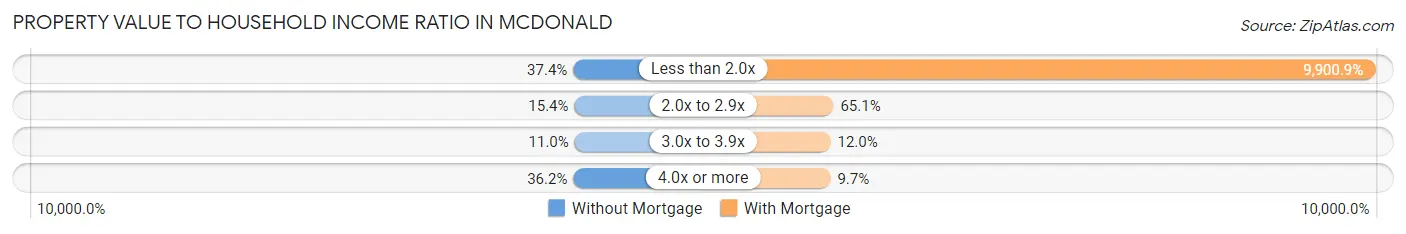
| Value-to-Income Ratio | Without Mortgage | With Mortgage |
| Less than 2.0x | 146 (37.4%) | 77,425 (9,900.9%) |
| 2.0x to 2.9x | 60 (15.4%) | 509 (65.1%) |
| 3.0x to 3.9x | 43 (11.0%) | 94 (12.0%) |
| 4.0x or more | 141 (36.1%) | 76 (9.7%) |
| Total | 390 (100.0%) | 782 (100.0%) |
Real Estate Taxes by Mortgage Status in McDonald
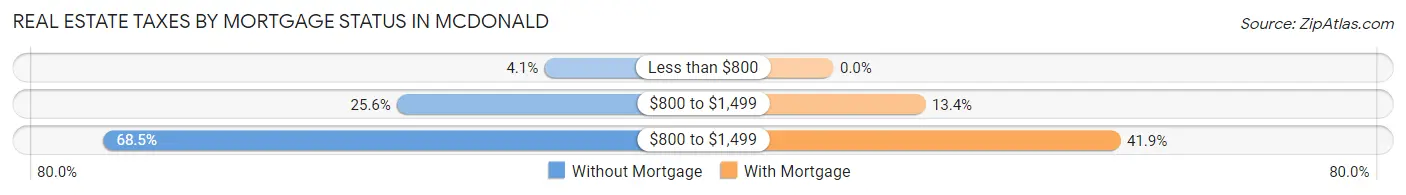
| Property Taxes | Without Mortgage | With Mortgage |
| Less than $800 | 16 (4.1%) | 0 (0.0%) |
| $800 to $1,499 | 100 (25.6%) | 105 (13.4%) |
| $800 to $1,499 | 267 (68.5%) | 328 (41.9%) |
| Total | 390 (100.0%) | 782 (100.0%) |
Health & Disability in McDonald
Health Insurance Coverage by Age in McDonald
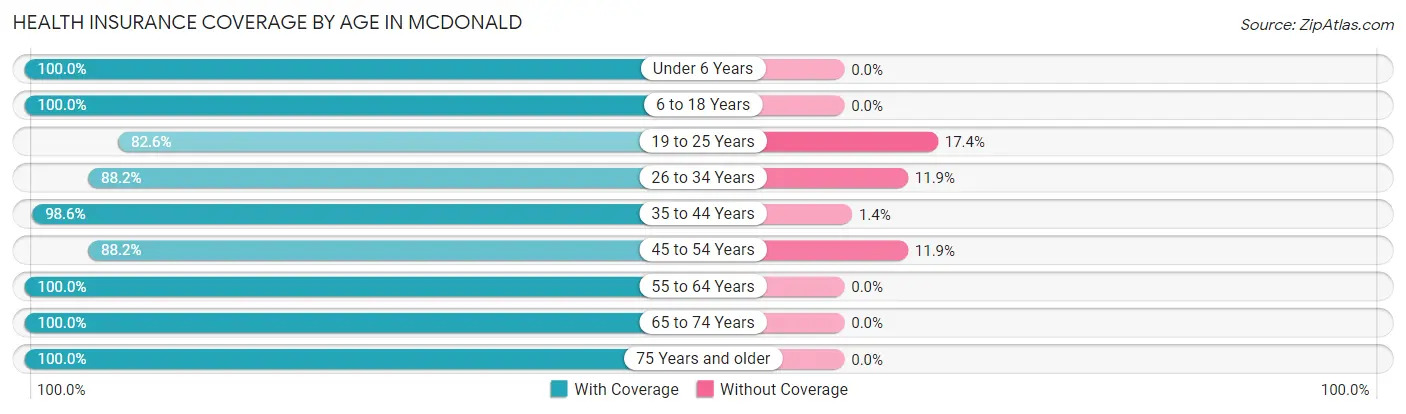
| Age Bracket | With Coverage | Without Coverage |
| Under 6 Years | 166 (100.0%) | 0 (0.0%) |
| 6 to 18 Years | 515 (100.0%) | 0 (0.0%) |
| 19 to 25 Years | 213 (82.6%) | 45 (17.4%) |
| 26 to 34 Years | 253 (88.1%) | 34 (11.8%) |
| 35 to 44 Years | 414 (98.6%) | 6 (1.4%) |
| 45 to 54 Years | 320 (88.1%) | 43 (11.8%) |
| 55 to 64 Years | 516 (100.0%) | 0 (0.0%) |
| 65 to 74 Years | 262 (100.0%) | 0 (0.0%) |
| 75 Years and older | 370 (100.0%) | 0 (0.0%) |
| Total | 3,029 (96.0%) | 128 (4.1%) |
Health Insurance Coverage by Citizenship Status in McDonald
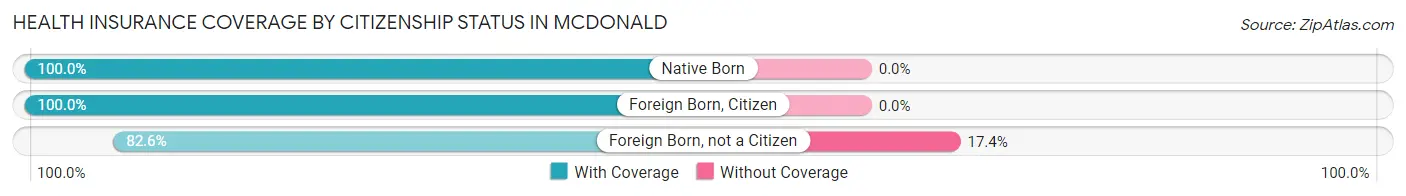
| Citizenship Status | With Coverage | Without Coverage |
| Native Born | 166 (100.0%) | 0 (0.0%) |
| Foreign Born, Citizen | 515 (100.0%) | 0 (0.0%) |
| Foreign Born, not a Citizen | 213 (82.6%) | 45 (17.4%) |
Health Insurance Coverage by Household Income in McDonald
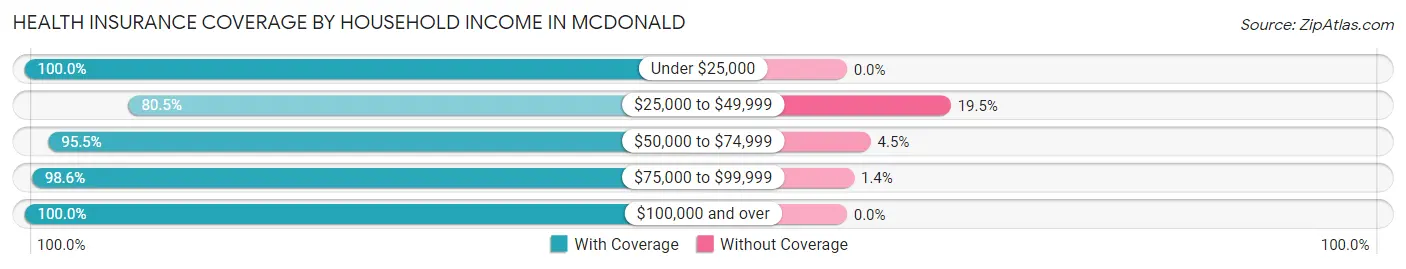
| Household Income | With Coverage | Without Coverage |
| Under $25,000 | 214 (100.0%) | 0 (0.0%) |
| $25,000 to $49,999 | 422 (80.5%) | 102 (19.5%) |
| $50,000 to $74,999 | 321 (95.5%) | 15 (4.5%) |
| $75,000 to $99,999 | 800 (98.6%) | 11 (1.4%) |
| $100,000 and over | 1,272 (100.0%) | 0 (0.0%) |
Public vs Private Health Insurance Coverage by Age in McDonald
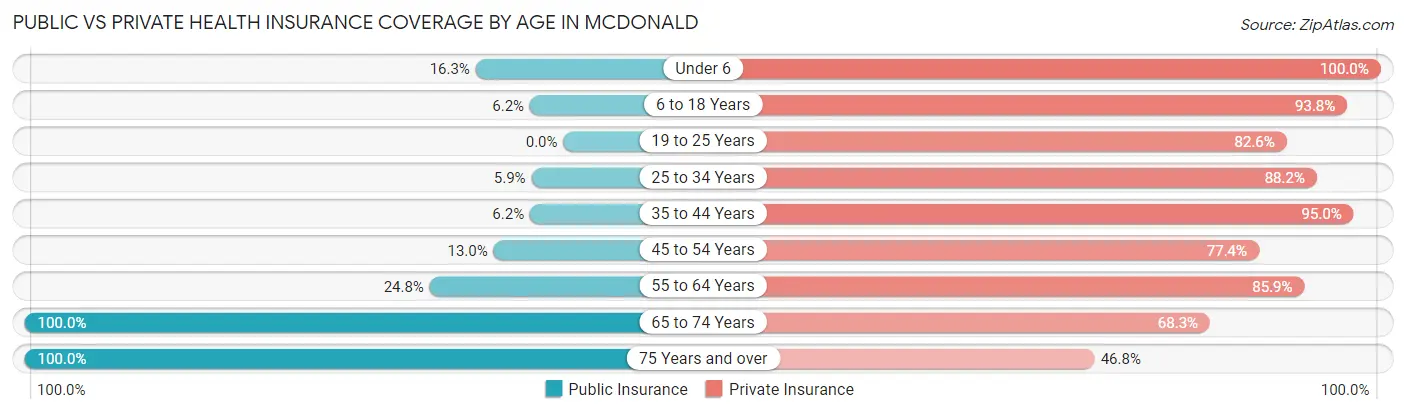
| Age Bracket | Public Insurance | Private Insurance |
| Under 6 | 27 (16.3%) | 166 (100.0%) |
| 6 to 18 Years | 32 (6.2%) | 483 (93.8%) |
| 19 to 25 Years | 0 (0.0%) | 213 (82.6%) |
| 25 to 34 Years | 17 (5.9%) | 253 (88.1%) |
| 35 to 44 Years | 26 (6.2%) | 399 (95.0%) |
| 45 to 54 Years | 47 (13.0%) | 281 (77.4%) |
| 55 to 64 Years | 128 (24.8%) | 443 (85.9%) |
| 65 to 74 Years | 262 (100.0%) | 179 (68.3%) |
| 75 Years and over | 370 (100.0%) | 173 (46.8%) |
| Total | 909 (28.8%) | 2,590 (82.0%) |
Disability Status by Sex by Age in McDonald
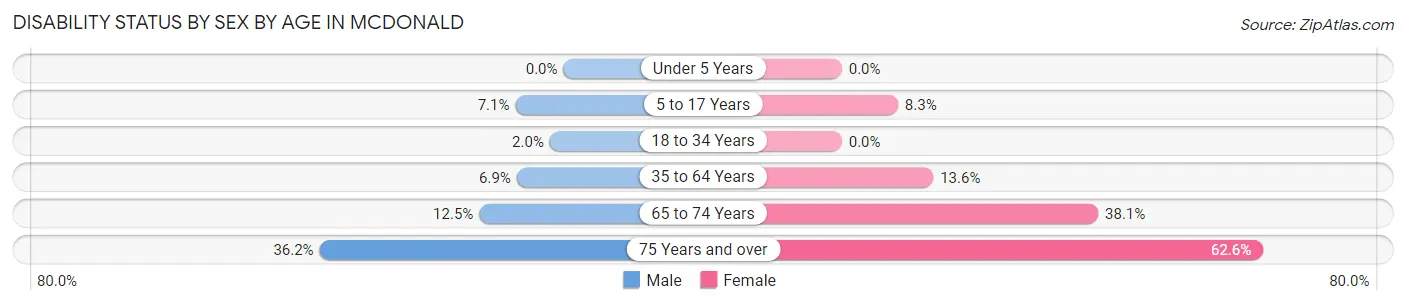
| Age Bracket | Male | Female |
| Under 5 Years | 0 (0.0%) | 0 (0.0%) |
| 5 to 17 Years | 16 (7.1%) | 22 (8.3%) |
| 18 to 34 Years | 7 (2.0%) | 0 (0.0%) |
| 35 to 64 Years | 38 (6.9%) | 102 (13.6%) |
| 65 to 74 Years | 16 (12.5%) | 51 (38.1%) |
| 75 Years and over | 46 (36.2%) | 152 (62.5%) |
Disability Class by Sex by Age in McDonald
Disability Class: Hearing Difficulty
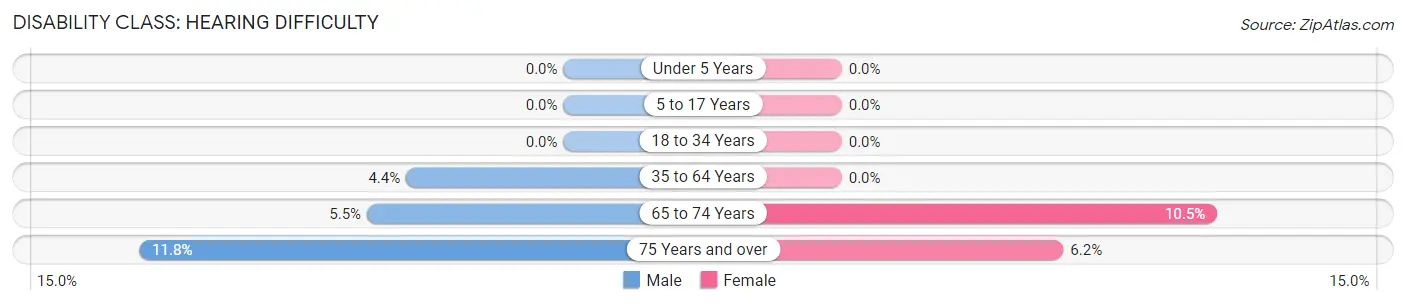
| Age Bracket | Male | Female |
| Under 5 Years | 0 (0.0%) | 0 (0.0%) |
| 5 to 17 Years | 0 (0.0%) | 0 (0.0%) |
| 18 to 34 Years | 0 (0.0%) | 0 (0.0%) |
| 35 to 64 Years | 24 (4.4%) | 0 (0.0%) |
| 65 to 74 Years | 7 (5.5%) | 14 (10.4%) |
| 75 Years and over | 15 (11.8%) | 15 (6.2%) |
Disability Class: Vision Difficulty
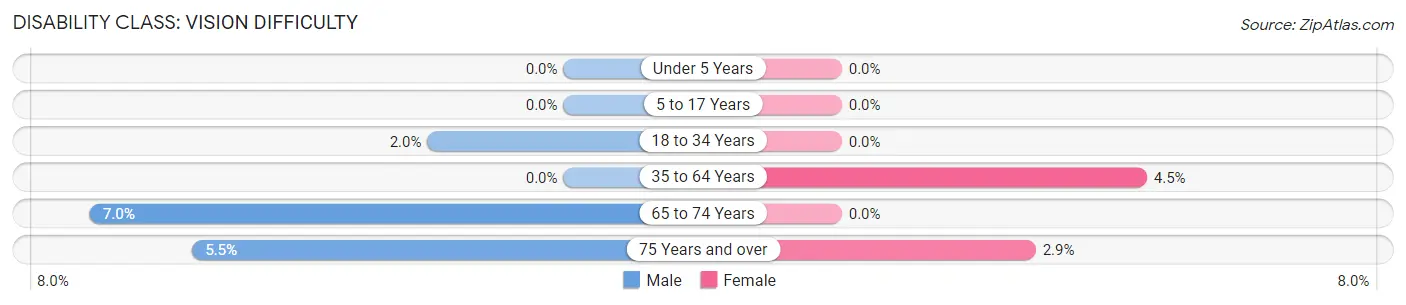
| Age Bracket | Male | Female |
| Under 5 Years | 0 (0.0%) | 0 (0.0%) |
| 5 to 17 Years | 0 (0.0%) | 0 (0.0%) |
| 18 to 34 Years | 7 (2.0%) | 0 (0.0%) |
| 35 to 64 Years | 0 (0.0%) | 34 (4.5%) |
| 65 to 74 Years | 9 (7.0%) | 0 (0.0%) |
| 75 Years and over | 7 (5.5%) | 7 (2.9%) |
Disability Class: Cognitive Difficulty
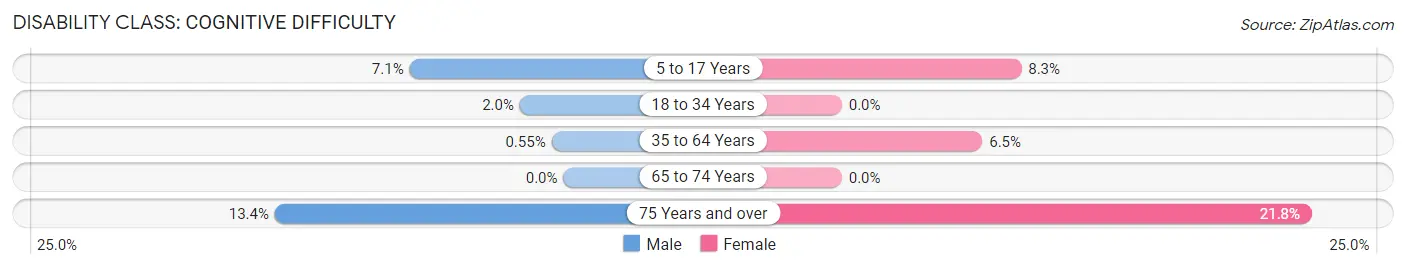
| Age Bracket | Male | Female |
| 5 to 17 Years | 16 (7.1%) | 22 (8.3%) |
| 18 to 34 Years | 7 (2.0%) | 0 (0.0%) |
| 35 to 64 Years | 3 (0.5%) | 49 (6.5%) |
| 65 to 74 Years | 0 (0.0%) | 0 (0.0%) |
| 75 Years and over | 17 (13.4%) | 53 (21.8%) |
Disability Class: Ambulatory Difficulty
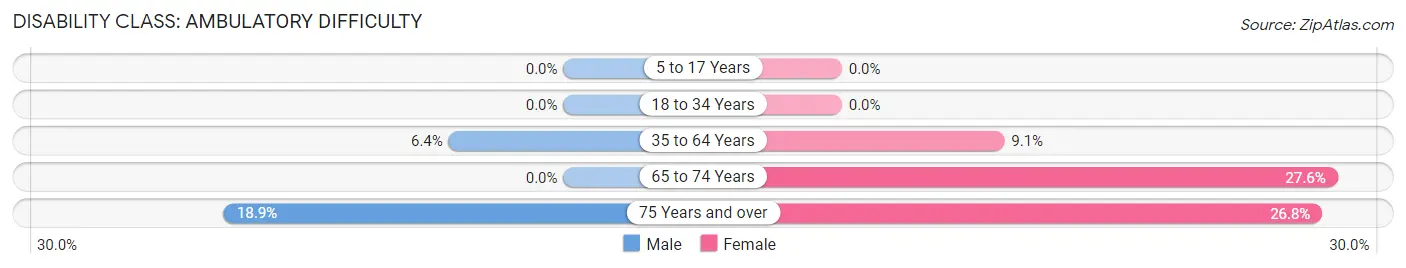
| Age Bracket | Male | Female |
| 5 to 17 Years | 0 (0.0%) | 0 (0.0%) |
| 18 to 34 Years | 0 (0.0%) | 0 (0.0%) |
| 35 to 64 Years | 35 (6.4%) | 68 (9.0%) |
| 65 to 74 Years | 0 (0.0%) | 37 (27.6%) |
| 75 Years and over | 24 (18.9%) | 65 (26.8%) |
Disability Class: Self-Care Difficulty
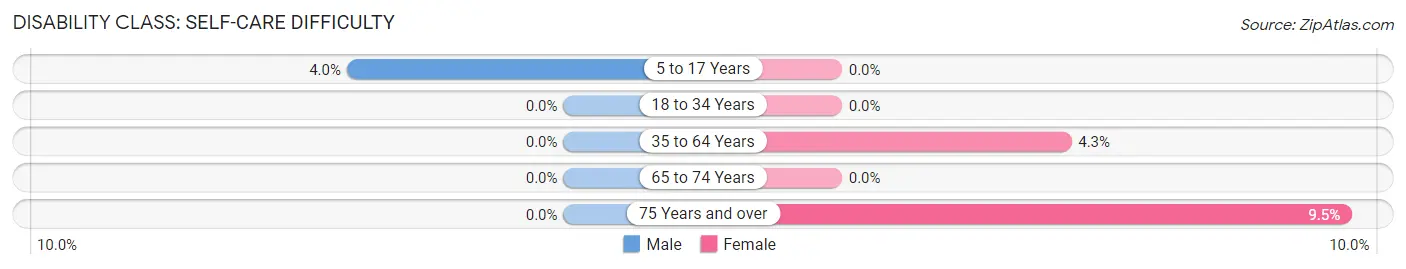
| Age Bracket | Male | Female |
| 5 to 17 Years | 9 (4.0%) | 0 (0.0%) |
| 18 to 34 Years | 0 (0.0%) | 0 (0.0%) |
| 35 to 64 Years | 0 (0.0%) | 32 (4.3%) |
| 65 to 74 Years | 0 (0.0%) | 0 (0.0%) |
| 75 Years and over | 0 (0.0%) | 23 (9.5%) |
Technology Access in McDonald
Computing Device Access in McDonald
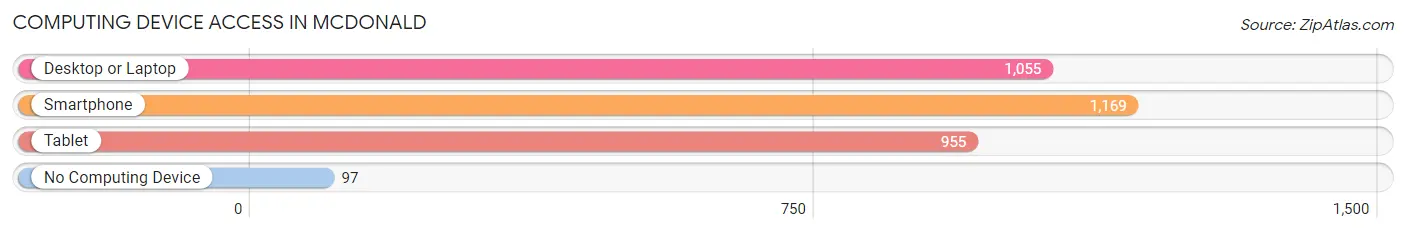
| Device Type | # Households | % Households |
| Desktop or Laptop | 1,055 | 78.1% |
| Smartphone | 1,169 | 86.6% |
| Tablet | 955 | 70.7% |
| No Computing Device | 97 | 7.2% |
| Total | 1,350 | 100.0% |
Internet Access in McDonald
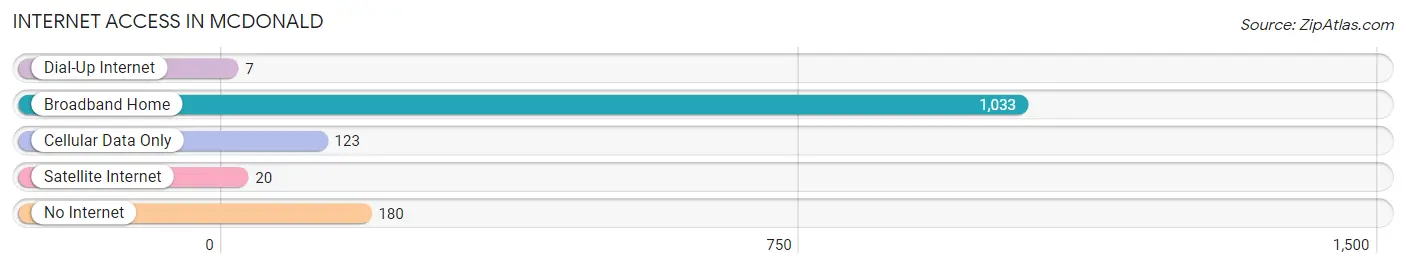
| Internet Type | # Households | % Households |
| Dial-Up Internet | 7 | 0.5% |
| Broadband Home | 1,033 | 76.5% |
| Cellular Data Only | 123 | 9.1% |
| Satellite Internet | 20 | 1.5% |
| No Internet | 180 | 13.3% |
| Total | 1,350 | 100.0% |
McDonald Summary
McDonald, Ohio is a small village located in Trumbull County, Ohio. It is situated on the Mahoning River, approximately 20 miles northwest of Youngstown. The village has a population of approximately 1,800 people and is part of the Youngstown-Warren-Boardman metropolitan area.
History
McDonald was founded in 1802 by John McDonald, a Revolutionary War veteran. The village was originally known as “McDonald’s Station” and was a stop on the stagecoach route between Pittsburgh and Cleveland. The village was incorporated in 1867 and was named after its founder.
In the late 19th century, McDonald was a thriving industrial center. The village was home to several factories, including a steel mill, a brickyard, and a paper mill. The steel mill was the largest employer in the village and employed hundreds of people.
Geography
McDonald is located in northeastern Ohio, approximately 20 miles northwest of Youngstown. The village is situated on the Mahoning River and is surrounded by rolling hills and farmland. The village is located in Trumbull County and is part of the Youngstown-Warren-Boardman metropolitan area.
The climate in McDonald is typical of the Midwest, with hot summers and cold winters. The average temperature in the summer is around 75 degrees Fahrenheit, while the average temperature in the winter is around 25 degrees Fahrenheit.
Economy
McDonald’s economy is largely based on agriculture and manufacturing. The village is home to several factories, including a steel mill, a brickyard, and a paper mill. The steel mill is the largest employer in the village and employs hundreds of people.
The village also has several small businesses, including restaurants, shops, and service providers. The village is also home to several churches and a public library.
Demographics
As of the 2010 census, the population of McDonald was 1,817. The racial makeup of the village was 97.3% White, 0.7% African American, 0.2% Native American, 0.2% Asian, 0.1% Pacific Islander, 0.3% from other races, and 1.2% from two or more races. Hispanic or Latino of any race were 1.2% of the population.
The median household income in McDonald was $41,250, and the median family income was $50,000. The per capita income for the village was $20,845. About 11.2% of families and 13.2% of the population were below the poverty line, including 17.2% of those under age 18 and 8.2% of those age 65 or over.
McDonald is a small village with a rich history and a diverse economy. The village is home to several factories and small businesses, and the steel mill is the largest employer in the village. The village has a population of approximately 1,800 people and is part of the Youngstown-Warren-Boardman metropolitan area.
Common Questions
What is Per Capita Income in McDonald?
Per Capita income in McDonald is $35,671.
What is the Median Family Income in McDonald?
Median Family Income in McDonald is $82,333.
What is the Median Household income in McDonald?
Median Household Income in McDonald is $75,315.
What is Income or Wage Gap in McDonald?
Income or Wage Gap in McDonald is 10.6%.
Women in McDonald earn 89.4 cents for every dollar earned by a man.
What is Inequality or Gini Index in McDonald?
Inequality or Gini Index in McDonald is 0.39.
What is the Total Population of McDonald?
Total Population of McDonald is 3,160.
What is the Total Male Population of McDonald?
Total Male Population of McDonald is 1,440.
What is the Total Female Population of McDonald?
Total Female Population of McDonald is 1,720.
What is the Ratio of Males per 100 Females in McDonald?
There are 83.72 Males per 100 Females in McDonald.
What is the Ratio of Females per 100 Males in McDonald?
There are 119.44 Females per 100 Males in McDonald.
What is the Median Population Age in McDonald?
Median Population Age in McDonald is 43.7 Years.
What is the Average Family Size in McDonald
Average Family Size in McDonald is 2.9 People.
What is the Average Household Size in McDonald
Average Household Size in McDonald is 2.3 People.
How Large is the Labor Force in McDonald?
There are 1,577 People in the Labor Forcein in McDonald.
What is the Percentage of People in the Labor Force in McDonald?
59.5% of People are in the Labor Force in McDonald.
What is the Unemployment Rate in McDonald?
Unemployment Rate in McDonald is 2.5%.