Cities with the Most Immigrants from Iran in Colorado
RELATED REPORTS & OPTIONS
Iran
Colorado
Compare Cities
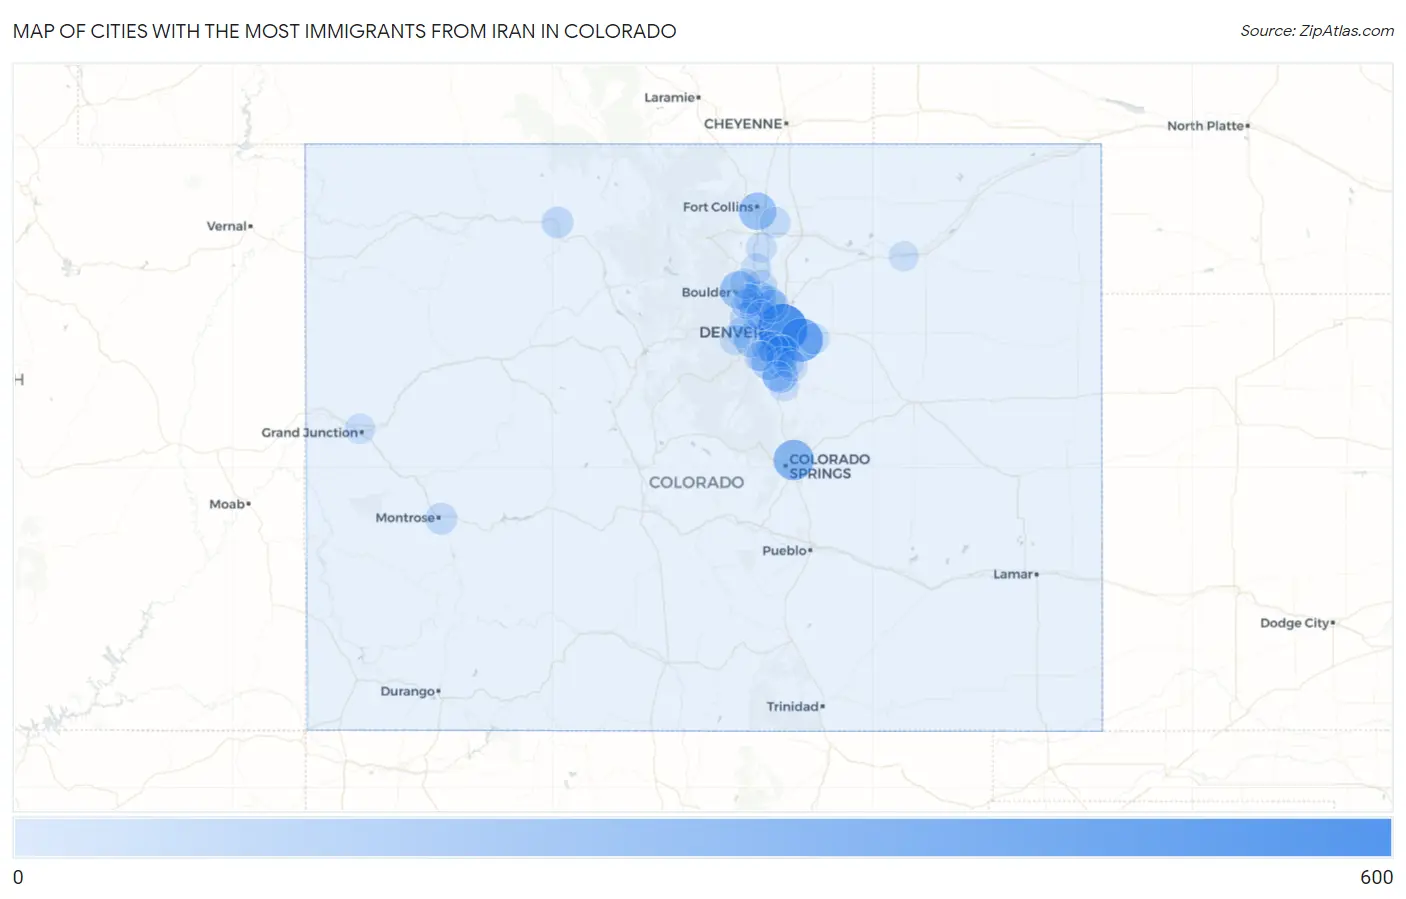
Map of Cities with the Most Immigrants from Iran in Colorado
0
600
Cities with the Most Immigrants from Iran in Colorado
| City | Iran | vs State | vs National | |
| 1. | Denver | 544 | 3,568(15.25%)#1 | 391,354(0.14%)#88 |
| 2. | Aurora | 364 | 3,568(10.20%)#2 | 391,354(0.09%)#142 |
| 3. | Colorado Springs | 280 | 3,568(7.85%)#3 | 391,354(0.07%)#198 |
| 4. | Boulder | 204 | 3,568(5.72%)#4 | 391,354(0.05%)#280 |
| 5. | Fort Collins | 200 | 3,568(5.61%)#5 | 391,354(0.05%)#284 |
| 6. | Castle Pines | 161 | 3,568(4.51%)#6 | 391,354(0.04%)#344 |
| 7. | Westminster | 134 | 3,568(3.76%)#7 | 391,354(0.03%)#410 |
| 8. | Highlands Ranch | 134 | 3,568(3.76%)#8 | 391,354(0.03%)#411 |
| 9. | Broomfield | 133 | 3,568(3.73%)#9 | 391,354(0.03%)#416 |
| 10. | Centennial | 114 | 3,568(3.20%)#10 | 391,354(0.03%)#469 |
| 11. | Lakewood | 113 | 3,568(3.17%)#11 | 391,354(0.03%)#471 |
| 12. | Northglenn | 91 | 3,568(2.55%)#12 | 391,354(0.02%)#565 |
| 13. | Thornton | 79 | 3,568(2.21%)#13 | 391,354(0.02%)#634 |
| 14. | Arvada | 77 | 3,568(2.16%)#14 | 391,354(0.02%)#647 |
| 15. | Cherry Hills Village | 61 | 3,568(1.71%)#15 | 391,354(0.02%)#778 |
| 16. | Four Square Mile | 56 | 3,568(1.57%)#16 | 391,354(0.01%)#815 |
| 17. | Greenwood Village | 49 | 3,568(1.37%)#17 | 391,354(0.01%)#894 |
| 18. | Montrose | 46 | 3,568(1.29%)#18 | 391,354(0.01%)#929 |
| 19. | Erie | 43 | 3,568(1.21%)#19 | 391,354(0.01%)#963 |
| 20. | Steamboat Springs | 42 | 3,568(1.18%)#20 | 391,354(0.01%)#978 |
| 21. | Cherry Creek | 35 | 3,568(0.98%)#21 | 391,354(0.01%)#1,091 |
| 22. | Lone Tree | 31 | 3,568(0.87%)#22 | 391,354(0.01%)#1,180 |
| 23. | Watkins | 30 | 3,568(0.84%)#23 | 391,354(0.01%)#1,216 |
| 24. | Golden | 29 | 3,568(0.81%)#24 | 391,354(0.01%)#1,223 |
| 25. | Windsor | 25 | 3,568(0.70%)#25 | 391,354(0.01%)#1,329 |
| 26. | Parker | 19 | 3,568(0.53%)#26 | 391,354(0.00%)#1,474 |
| 27. | Longmont | 18 | 3,568(0.50%)#27 | 391,354(0.00%)#1,508 |
| 28. | Berthoud | 17 | 3,568(0.48%)#28 | 391,354(0.00%)#1,576 |
| 29. | Superior | 15 | 3,568(0.42%)#29 | 391,354(0.00%)#1,634 |
| 30. | Genesee | 15 | 3,568(0.42%)#30 | 391,354(0.00%)#1,644 |
| 31. | Gunbarrel | 14 | 3,568(0.39%)#31 | 391,354(0.00%)#1,674 |
| 32. | Stonegate | 13 | 3,568(0.36%)#32 | 391,354(0.00%)#1,726 |
| 33. | Castle Rock | 12 | 3,568(0.34%)#33 | 391,354(0.00%)#1,749 |
| 34. | Grand Junction | 11 | 3,568(0.31%)#34 | 391,354(0.00%)#1,797 |
| 35. | Englewood | 10 | 3,568(0.28%)#35 | 391,354(0.00%)#1,855 |
| 36. | Columbine | 9 | 3,568(0.25%)#36 | 391,354(0.00%)#1,929 |
| 37. | Littleton | 8 | 3,568(0.22%)#37 | 391,354(0.00%)#1,996 |
| 38. | Louisville | 8 | 3,568(0.22%)#38 | 391,354(0.00%)#2,011 |
| 39. | Castle Pines Village | 6 | 3,568(0.17%)#39 | 391,354(0.00%)#2,143 |
| 40. | Fort Morgan | 5 | 3,568(0.14%)#40 | 391,354(0.00%)#2,185 |
| 41. | Shaw Heights | 3 | 3,568(0.08%)#41 | 391,354(0.00%)#2,272 |
Common Questions
What are the Top 10 Cities with the Most Immigrants from Iran in Colorado?
Top 10 Cities with the Most Immigrants from Iran in Colorado are:
#1
544
#2
364
#3
280
#4
204
#5
200
#6
161
#7
134
#8
134
#9
133
#10
114
What city has the Most Immigrants from Iran in Colorado?
Denver has the Most Immigrants from Iran in Colorado with 544.
What is the Total Immigrants from Iran in the State of Colorado?
Total Immigrants from Iran in Colorado is 3,568.
What is the Total Immigrants from Iran in the United States?
Total Immigrants from Iran in the United States is 391,354.