Cities with the Highest Percentage of Peruvian Population in Maryland
RELATED REPORTS & OPTIONS
Peruvian
Maryland
Compare Cities
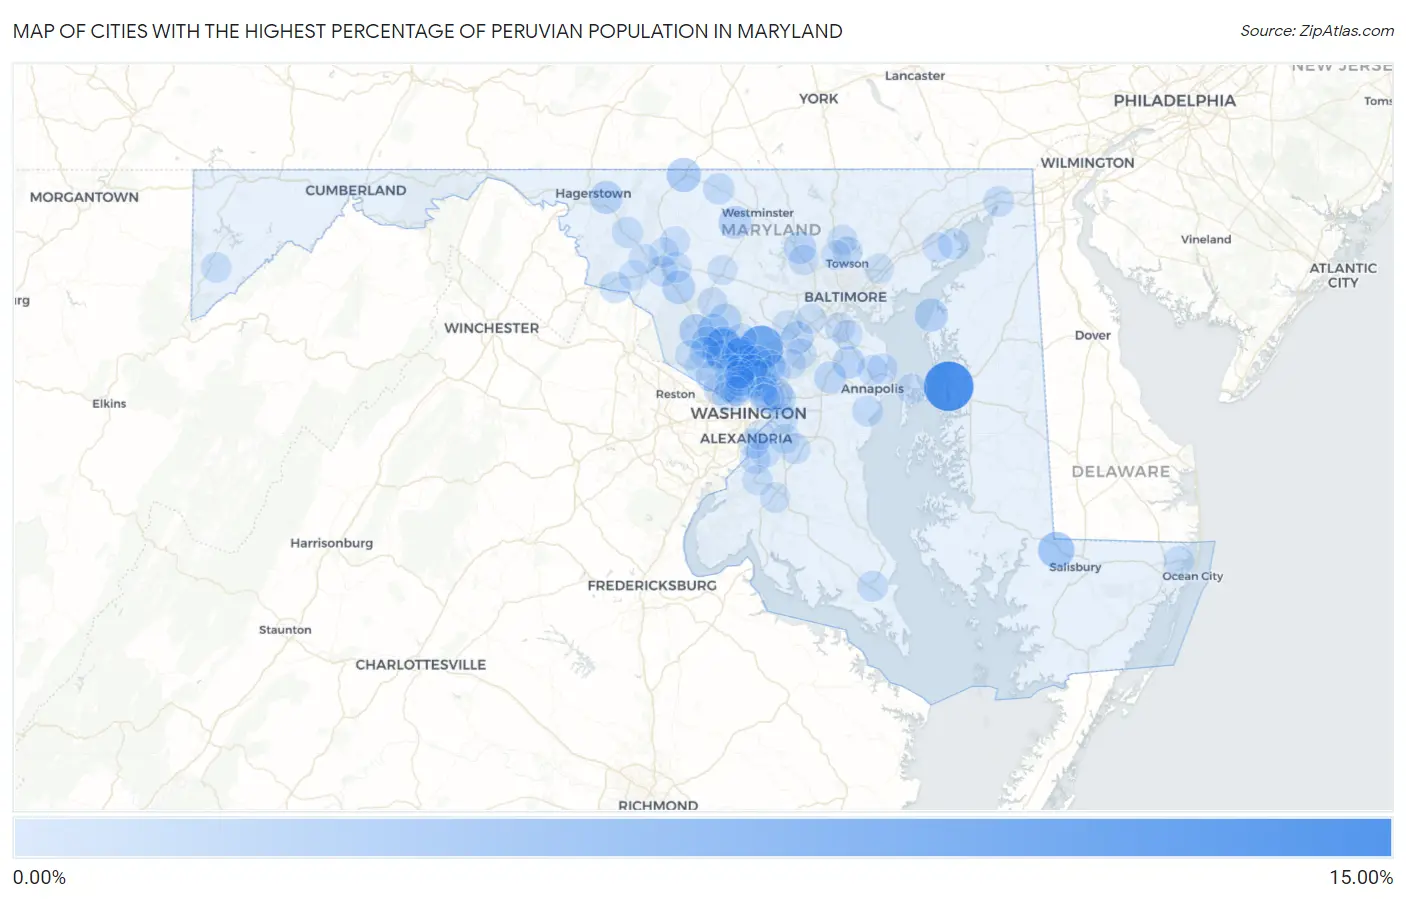
Map of Cities with the Highest Percentage of Peruvian Population in Maryland
0.00%
15.00%
Cities with the Highest Percentage of Peruvian Population in Maryland
| City | Peruvian | vs State | vs National | |
| 1. | Queenstown | 14.60% | 0.43%(+14.2)#1 | 0.22%(+14.4)#4 |
| 2. | Spencerville | 10.26% | 0.43%(+9.83)#2 | 0.22%(+10.0)#14 |
| 3. | Derwood | 7.24% | 0.43%(+6.82)#3 | 0.22%(+7.03)#34 |
| 4. | Crumpton | 6.39% | 0.43%(+5.96)#4 | 0.22%(+6.17)#44 |
| 5. | Flower Hill | 5.84% | 0.43%(+5.42)#5 | 0.22%(+5.63)#54 |
| 6. | Hebron | 4.61% | 0.43%(+4.19)#6 | 0.22%(+4.40)#76 |
| 7. | Emmitsburg | 3.09% | 0.43%(+2.66)#7 | 0.22%(+2.87)#143 |
| 8. | Germantown | 3.07% | 0.43%(+2.65)#8 | 0.22%(+2.86)#147 |
| 9. | Woodlawn Cdp Prince George S County | 2.75% | 0.43%(+2.33)#9 | 0.22%(+2.54)#181 |
| 10. | Aspen Hill | 2.47% | 0.43%(+2.04)#10 | 0.22%(+2.25)#214 |
| 11. | Glenmont | 2.44% | 0.43%(+2.01)#11 | 0.22%(+2.23)#217 |
| 12. | Urbana | 2.42% | 0.43%(+1.99)#12 | 0.22%(+2.20)#224 |
| 13. | Tolchester | 2.41% | 0.43%(+1.99)#13 | 0.22%(+2.20)#225 |
| 14. | Robinwood | 2.31% | 0.43%(+1.89)#14 | 0.22%(+2.10)#241 |
| 15. | Burnt Mills | 2.26% | 0.43%(+1.83)#15 | 0.22%(+2.04)#252 |
| 16. | New Windsor | 2.22% | 0.43%(+1.80)#16 | 0.22%(+2.01)#258 |
| 17. | Calverton | 2.15% | 0.43%(+1.72)#17 | 0.22%(+1.93)#271 |
| 18. | Cabin John | 2.09% | 0.43%(+1.67)#18 | 0.22%(+1.88)#280 |
| 19. | Rockville | 2.07% | 0.43%(+1.64)#19 | 0.22%(+1.85)#285 |
| 20. | Laytonsville | 2.04% | 0.43%(+1.61)#20 | 0.22%(+1.82)#294 |
| 21. | Montgomery Village | 1.95% | 0.43%(+1.52)#21 | 0.22%(+1.73)#313 |
| 22. | Savage | 1.93% | 0.43%(+1.50)#22 | 0.22%(+1.71)#318 |
| 23. | Arden On The Severn | 1.91% | 0.43%(+1.48)#23 | 0.22%(+1.69)#326 |
| 24. | Redland | 1.89% | 0.43%(+1.46)#24 | 0.22%(+1.68)#329 |
| 25. | Reisterstown | 1.89% | 0.43%(+1.46)#25 | 0.22%(+1.67)#332 |
| 26. | Gaithersburg | 1.78% | 0.43%(+1.36)#26 | 0.22%(+1.57)#360 |
| 27. | Langley Park | 1.70% | 0.43%(+1.28)#27 | 0.22%(+1.49)#382 |
| 28. | Landover Hills | 1.61% | 0.43%(+1.18)#28 | 0.22%(+1.39)#405 |
| 29. | North Brentwood | 1.57% | 0.43%(+1.14)#29 | 0.22%(+1.35)#419 |
| 30. | Crofton | 1.56% | 0.43%(+1.14)#30 | 0.22%(+1.35)#421 |
| 31. | North Kensington | 1.52% | 0.43%(+1.10)#31 | 0.22%(+1.31)#433 |
| 32. | Wheaton | 1.52% | 0.43%(+1.09)#32 | 0.22%(+1.30)#439 |
| 33. | Leisure World | 1.52% | 0.43%(+1.09)#33 | 0.22%(+1.30)#441 |
| 34. | Ten Mile Creek | 1.38% | 0.43%(+0.958)#34 | 0.22%(+1.17)#499 |
| 35. | Brunswick | 1.27% | 0.43%(+0.846)#35 | 0.22%(+1.06)#544 |
| 36. | Colesville | 1.23% | 0.43%(+0.807)#36 | 0.22%(+1.02)#563 |
| 37. | Taneytown | 1.15% | 0.43%(+0.721)#37 | 0.22%(+0.932)#596 |
| 38. | Hillandale | 1.12% | 0.43%(+0.693)#38 | 0.22%(+0.904)#614 |
| 39. | Myersville | 1.08% | 0.43%(+0.656)#39 | 0.22%(+0.868)#640 |
| 40. | Aberdeen Proving Ground | 1.07% | 0.43%(+0.646)#40 | 0.22%(+0.858)#647 |
| 41. | North Bethesda | 1.05% | 0.43%(+0.624)#41 | 0.22%(+0.836)#662 |
| 42. | Olney | 0.99% | 0.43%(+0.559)#42 | 0.22%(+0.770)#703 |
| 43. | North Potomac | 0.97% | 0.43%(+0.545)#43 | 0.22%(+0.757)#712 |
| 44. | Silver Spring | 0.96% | 0.43%(+0.538)#44 | 0.22%(+0.749)#720 |
| 45. | Mayo | 0.88% | 0.43%(+0.458)#45 | 0.22%(+0.669)#784 |
| 46. | California | 0.87% | 0.43%(+0.446)#46 | 0.22%(+0.657)#793 |
| 47. | Fort Washington | 0.85% | 0.43%(+0.421)#47 | 0.22%(+0.633)#813 |
| 48. | Potomac | 0.85% | 0.43%(+0.421)#48 | 0.22%(+0.632)#814 |
| 49. | Rosaryville | 0.83% | 0.43%(+0.405)#49 | 0.22%(+0.616)#827 |
| 50. | Walker Mill | 0.81% | 0.43%(+0.386)#50 | 0.22%(+0.597)#842 |
| 51. | Four Corners | 0.81% | 0.43%(+0.385)#51 | 0.22%(+0.596)#845 |
| 52. | Bethesda | 0.79% | 0.43%(+0.367)#52 | 0.22%(+0.578)#863 |
| 53. | North East | 0.79% | 0.43%(+0.361)#53 | 0.22%(+0.573)#866 |
| 54. | Bartonsville | 0.76% | 0.43%(+0.332)#54 | 0.22%(+0.543)#895 |
| 55. | Chevy Chase Section Five | 0.75% | 0.43%(+0.327)#55 | 0.22%(+0.539)#902 |
| 56. | Ballenger Creek | 0.74% | 0.43%(+0.318)#56 | 0.22%(+0.529)#910 |
| 57. | East Riverdale | 0.72% | 0.43%(+0.298)#57 | 0.22%(+0.509)#928 |
| 58. | Beltsville | 0.70% | 0.43%(+0.274)#58 | 0.22%(+0.485)#960 |
| 59. | Maryland City | 0.68% | 0.43%(+0.249)#59 | 0.22%(+0.461)#993 |
| 60. | Brookmont | 0.67% | 0.43%(+0.243)#60 | 0.22%(+0.455)#999 |
| 61. | Loch Lynn Heights | 0.63% | 0.43%(+0.204)#61 | 0.22%(+0.415)#1,049 |
| 62. | Woodlawn Cdp Baltimore County | 0.63% | 0.43%(+0.203)#62 | 0.22%(+0.414)#1,050 |
| 63. | Ocean Pines | 0.63% | 0.43%(+0.199)#63 | 0.22%(+0.410)#1,059 |
| 64. | Owings Mills | 0.60% | 0.43%(+0.171)#64 | 0.22%(+0.382)#1,103 |
| 65. | Ferndale | 0.58% | 0.43%(+0.155)#65 | 0.22%(+0.367)#1,124 |
| 66. | Cape St Claire | 0.56% | 0.43%(+0.138)#66 | 0.22%(+0.349)#1,159 |
| 67. | Friendly | 0.55% | 0.43%(+0.128)#67 | 0.22%(+0.339)#1,178 |
| 68. | Arnold | 0.55% | 0.43%(+0.121)#68 | 0.22%(+0.333)#1,186 |
| 69. | Wildewood | 0.54% | 0.43%(+0.111)#69 | 0.22%(+0.323)#1,215 |
| 70. | Chevy Chase Village | 0.53% | 0.43%(+0.104)#70 | 0.22%(+0.315)#1,223 |
| 71. | Frederick | 0.52% | 0.43%(+0.094)#71 | 0.22%(+0.305)#1,244 |
| 72. | Stevensville | 0.51% | 0.43%(+0.080)#72 | 0.22%(+0.292)#1,272 |
| 73. | Kemp Mill | 0.48% | 0.43%(+0.056)#73 | 0.22%(+0.267)#1,336 |
| 74. | Damascus | 0.46% | 0.43%(+0.036)#74 | 0.22%(+0.248)#1,391 |
| 75. | Accokeek | 0.44% | 0.43%(+0.013)#75 | 0.22%(+0.224)#1,439 |
| 76. | Cockeysville | 0.43% | 0.43%(+0.004)#76 | 0.22%(+0.215)#1,461 |
| 77. | South Kensington | 0.42% | 0.43%(-0.008)#77 | 0.22%(+0.203)#1,489 |
| 78. | Chillum | 0.42% | 0.43%(-0.009)#78 | 0.22%(+0.202)#1,491 |
| 79. | Perryman | 0.42% | 0.43%(-0.010)#79 | 0.22%(+0.201)#1,494 |
| 80. | National Harbor | 0.40% | 0.43%(-0.028)#80 | 0.22%(+0.183)#1,545 |
| 81. | Timonium | 0.39% | 0.43%(-0.037)#81 | 0.22%(+0.174)#1,572 |
| 82. | Glassmanor | 0.39% | 0.43%(-0.040)#82 | 0.22%(+0.171)#1,581 |
| 83. | Andrews Afb | 0.35% | 0.43%(-0.072)#83 | 0.22%(+0.140)#1,661 |
| 84. | Braddock Heights | 0.35% | 0.43%(-0.077)#84 | 0.22%(+0.135)#1,673 |
| 85. | Waldorf | 0.35% | 0.43%(-0.080)#85 | 0.22%(+0.131)#1,683 |
| 86. | Columbia | 0.34% | 0.43%(-0.085)#86 | 0.22%(+0.126)#1,707 |
| 87. | Walkersville | 0.34% | 0.43%(-0.090)#87 | 0.22%(+0.121)#1,722 |
| 88. | Jefferson | 0.33% | 0.43%(-0.098)#88 | 0.22%(+0.113)#1,739 |
| 89. | Mount Rainier | 0.31% | 0.43%(-0.112)#89 | 0.22%(+0.099)#1,770 |
| 90. | North Chevy Chase | 0.29% | 0.43%(-0.133)#90 | 0.22%(+0.078)#1,844 |
| 91. | Somerset | 0.29% | 0.43%(-0.135)#91 | 0.22%(+0.077)#1,855 |
| 92. | Mount Airy | 0.29% | 0.43%(-0.137)#92 | 0.22%(+0.074)#1,863 |
| 93. | Travilah | 0.29% | 0.43%(-0.141)#93 | 0.22%(+0.071)#1,882 |
| 94. | White Marsh | 0.28% | 0.43%(-0.146)#94 | 0.22%(+0.065)#1,902 |
| 95. | Ilchester | 0.28% | 0.43%(-0.148)#95 | 0.22%(+0.063)#1,912 |
| 96. | South Laurel | 0.27% | 0.43%(-0.152)#96 | 0.22%(+0.059)#1,922 |
| 97. | Darnestown | 0.27% | 0.43%(-0.157)#97 | 0.22%(+0.055)#1,945 |
| 98. | Kensington | 0.27% | 0.43%(-0.159)#98 | 0.22%(+0.052)#1,958 |
| 99. | Glen Burnie | 0.27% | 0.43%(-0.161)#99 | 0.22%(+0.051)#1,962 |
| 100. | Mays Chapel | 0.27% | 0.43%(-0.161)#100 | 0.22%(+0.050)#1,965 |
Common Questions
What are the Top 10 Cities with the Highest Percentage of Peruvian Population in Maryland?
Top 10 Cities with the Highest Percentage of Peruvian Population in Maryland are:
#1
14.60%
#2
10.26%
#3
7.24%
#4
4.61%
#5
3.09%
#6
3.07%
#7
2.47%
#8
2.44%
#9
2.42%
#10
2.41%
What city has the Highest Percentage of Peruvian Population in Maryland?
Queenstown has the Highest Percentage of Peruvian Population in Maryland with 14.60%.
What is the Percentage of Peruvian Population in the State of Maryland?
Percentage of Peruvian Population in Maryland is 0.43%.
What is the Percentage of Peruvian Population in the United States?
Percentage of Peruvian Population in the United States is 0.22%.