Cities with the Highest Percentage of Peruvian Population in the United States
RELATED REPORTS & OPTIONS
Peruvian
United States
Compare Cities
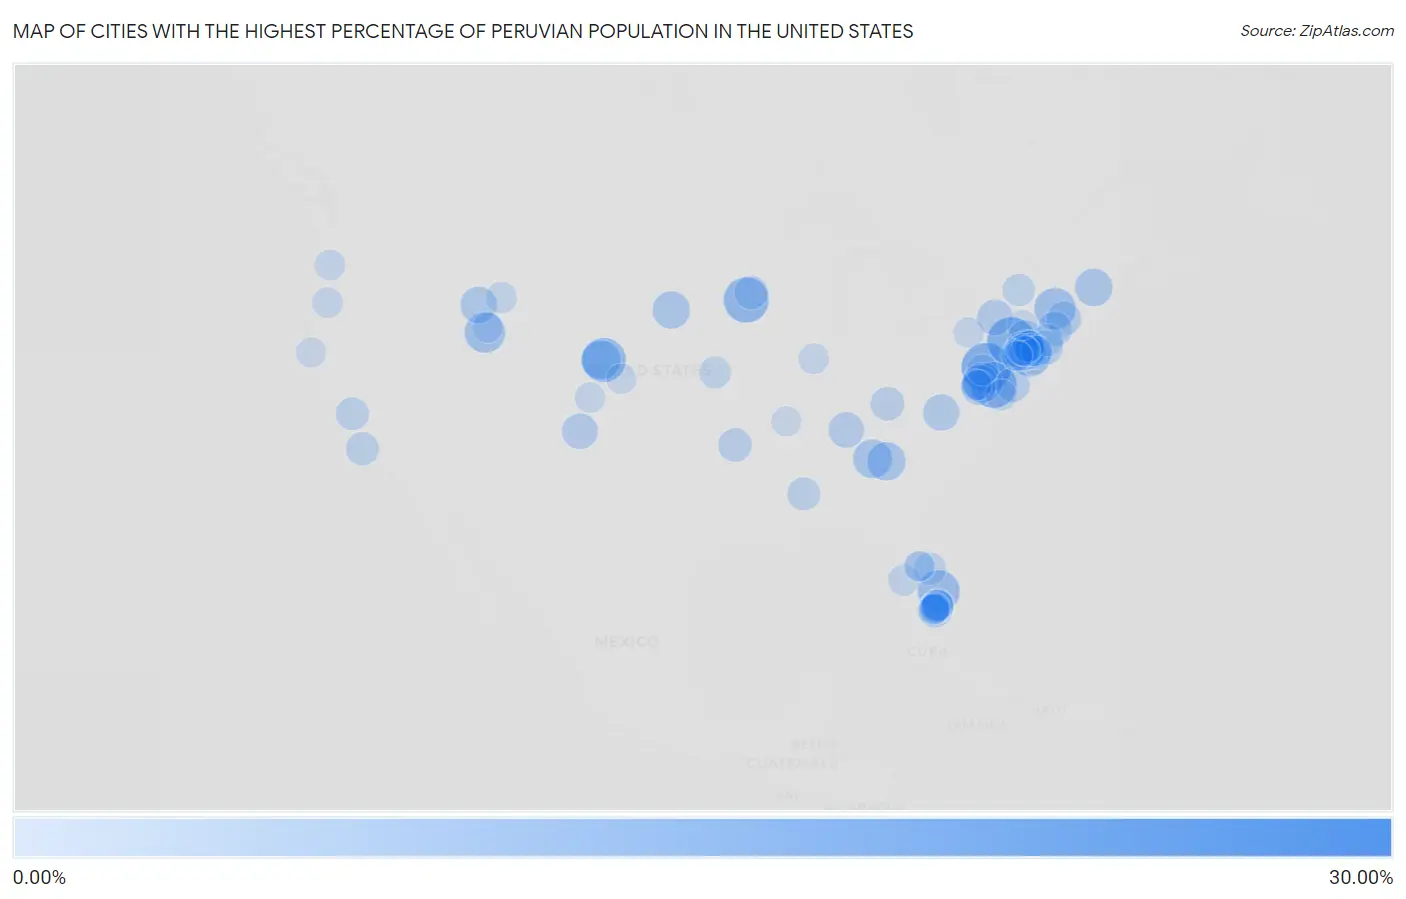
Map of Cities with the Highest Percentage of Peruvian Population in the United States
0.00%
30.00%
Cities with the Highest Percentage of Peruvian Population in the United States
| City | Peruvian | vs State | vs National | |
| 1. | Pawlet | 28.38% | 0.056%(+28.3)#1 | 0.22%(+28.2)#1 |
| 2. | Queens Gate | 16.84% | 0.10%(+16.7)#1 | 0.22%(+16.6)#2 |
| 3. | Sunrise Lake | 15.98% | 0.10%(+15.9)#2 | 0.22%(+15.8)#3 |
| 4. | Queenstown | 14.60% | 0.43%(+14.2)#1 | 0.22%(+14.4)#4 |
| 5. | Prospect Park Borough | 14.08% | 0.94%(+13.1)#1 | 0.22%(+13.9)#5 |
| 6. | Scarville | 14.04% | 0.031%(+14.0)#1 | 0.22%(+13.8)#6 |
| 7. | Snyder | 13.21% | 0.18%(+13.0)#1 | 0.22%(+13.0)#7 |
| 8. | Hopelawn | 12.27% | 0.94%(+11.3)#2 | 0.22%(+12.1)#8 |
| 9. | Island Park | 12.13% | 0.41%(+11.7)#1 | 0.22%(+11.9)#9 |
| 10. | Cabana Colony | 11.91% | 0.62%(+11.3)#1 | 0.22%(+11.7)#10 |
| 11. | Bennington | 11.46% | 0.087%(+11.4)#1 | 0.22%(+11.2)#11 |
| 12. | Peter | 10.87% | 0.40%(+10.5)#1 | 0.22%(+10.7)#12 |
| 13. | Botsford | 10.33% | 0.58%(+9.76)#1 | 0.22%(+10.1)#13 |
| 14. | Spencerville | 10.26% | 0.43%(+9.83)#2 | 0.22%(+10.0)#14 |
| 15. | Morgan Heights | 10.03% | 0.18%(+9.86)#2 | 0.22%(+9.82)#15 |
| 16. | Route 7 Gateway | 10.01% | 0.58%(+9.43)#2 | 0.22%(+9.79)#16 |
| 17. | Llewellyn Park | 9.69% | 0.94%(+8.75)#3 | 0.22%(+9.48)#17 |
| 18. | Eton | 9.66% | 0.12%(+9.54)#1 | 0.22%(+9.44)#18 |
| 19. | Kearny | 9.62% | 0.94%(+8.68)#4 | 0.22%(+9.40)#19 |
| 20. | Yonah | 9.51% | 0.12%(+9.39)#2 | 0.22%(+9.29)#20 |
| 21. | East Newark Borough | 9.16% | 0.94%(+8.22)#5 | 0.22%(+8.95)#21 |
| 22. | Thomaston | 8.90% | 0.061%(+8.84)#1 | 0.22%(+8.69)#22 |
| 23. | Butte | 8.84% | 0.042%(+8.80)#1 | 0.22%(+8.62)#23 |
| 24. | Riverside | 8.29% | 0.13%(+8.16)#1 | 0.22%(+8.07)#24 |
| 25. | Troutville | 8.14% | 0.47%(+7.67)#1 | 0.22%(+7.92)#25 |
| 26. | Dunellen Borough | 8.02% | 0.94%(+7.08)#6 | 0.22%(+7.80)#26 |
| 27. | Harrison | 7.92% | 0.94%(+6.98)#7 | 0.22%(+7.70)#27 |
| 28. | Seaside Heights Borough | 7.89% | 0.94%(+6.95)#8 | 0.22%(+7.68)#28 |
| 29. | Blodgett Mills | 7.69% | 0.41%(+7.28)#2 | 0.22%(+7.48)#29 |
| 30. | Angel Fire | 7.58% | 0.078%(+7.50)#1 | 0.22%(+7.37)#30 |
| 31. | Cottontown | 7.54% | 0.059%(+7.48)#1 | 0.22%(+7.32)#31 |
| 32. | Haledon Borough | 7.40% | 0.94%(+6.46)#9 | 0.22%(+7.19)#32 |
| 33. | Menlo Park Terrace | 7.28% | 0.94%(+6.34)#10 | 0.22%(+7.07)#33 |
| 34. | Derwood | 7.24% | 0.43%(+6.82)#3 | 0.22%(+7.03)#34 |
| 35. | Richmond Heights | 7.12% | 0.62%(+6.49)#2 | 0.22%(+6.90)#35 |
| 36. | Baywood | 7.10% | 0.41%(+6.68)#3 | 0.22%(+6.88)#36 |
| 37. | Ravensworth | 7.03% | 0.47%(+6.56)#2 | 0.22%(+6.81)#37 |
| 38. | Balmville | 6.98% | 0.41%(+6.57)#4 | 0.22%(+6.77)#38 |
| 39. | Hanscom Afb | 6.84% | 0.17%(+6.67)#1 | 0.22%(+6.62)#39 |
| 40. | North Grosvenor Dale | 6.79% | 0.58%(+6.21)#3 | 0.22%(+6.58)#40 |
| 41. | Cape May | 6.61% | 0.94%(+5.67)#11 | 0.22%(+6.39)#41 |
| 42. | Frenchburg | 6.47% | 0.051%(+6.42)#1 | 0.22%(+6.26)#42 |
| 43. | Mattituck | 6.44% | 0.41%(+6.02)#5 | 0.22%(+6.22)#43 |
| 44. | Crumpton | 6.39% | 0.43%(+5.96)#4 | 0.22%(+6.17)#44 |
| 45. | Geneva | 6.27% | 0.061%(+6.21)#1 | 0.22%(+6.05)#45 |
| 46. | Port Chester | 6.26% | 0.41%(+5.85)#6 | 0.22%(+6.05)#46 |
| 47. | Cedarville | 6.20% | 0.031%(+6.17)#1 | 0.22%(+5.99)#47 |
| 48. | Paterson | 6.19% | 0.94%(+5.25)#12 | 0.22%(+5.97)#48 |
| 49. | Byram | 6.11% | 0.58%(+5.54)#4 | 0.22%(+5.90)#49 |
| 50. | Laurel Hollow | 6.00% | 0.41%(+5.59)#7 | 0.22%(+5.78)#50 |
| 51. | Carthage | 5.97% | 0.040%(+5.93)#1 | 0.22%(+5.75)#51 |
| 52. | Garden Farms | 5.95% | 0.29%(+5.66)#1 | 0.22%(+5.73)#52 |
| 53. | Diablo Grande | 5.89% | 0.29%(+5.60)#2 | 0.22%(+5.67)#53 |
| 54. | Flower Hill | 5.84% | 0.43%(+5.42)#5 | 0.22%(+5.63)#54 |
| 55. | Manorhaven | 5.60% | 0.41%(+5.18)#8 | 0.22%(+5.38)#55 |
| 56. | Waikoloa Beach Resort | 5.59% | 0.077%(+5.51)#1 | 0.22%(+5.37)#56 |
| 57. | Indian Creek | 5.56% | 0.62%(+4.93)#3 | 0.22%(+5.34)#57 |
| 58. | New Hyde Park | 5.50% | 0.41%(+5.09)#9 | 0.22%(+5.29)#58 |
| 59. | Walnut Grove Cdp Sumner County | 5.45% | 0.059%(+5.40)#2 | 0.22%(+5.24)#59 |
| 60. | Palm Shores | 5.45% | 0.62%(+4.83)#4 | 0.22%(+5.24)#60 |
| 61. | Elmsford | 5.43% | 0.41%(+5.02)#10 | 0.22%(+5.22)#61 |
| 62. | North Miami Beach | 5.42% | 0.62%(+4.80)#5 | 0.22%(+5.21)#62 |
| 63. | Long Lake | 5.41% | 0.41%(+4.99)#11 | 0.22%(+5.19)#63 |
| 64. | Washington Borough | 5.40% | 0.94%(+4.46)#13 | 0.22%(+5.19)#64 |
| 65. | Locust Valley | 5.40% | 0.41%(+4.99)#12 | 0.22%(+5.18)#65 |
| 66. | Chester Center | 5.26% | 0.58%(+4.69)#5 | 0.22%(+5.05)#66 |
| 67. | Wetmore | 5.15% | 0.065%(+5.09)#1 | 0.22%(+4.94)#67 |
| 68. | Garfield | 5.05% | 0.94%(+4.11)#14 | 0.22%(+4.83)#68 |
| 69. | Roselle Park Borough | 5.02% | 0.94%(+4.08)#15 | 0.22%(+4.80)#69 |
| 70. | Bay Harbor Islands | 4.98% | 0.62%(+4.36)#6 | 0.22%(+4.77)#70 |
| 71. | Ellenton | 4.84% | 0.62%(+4.22)#7 | 0.22%(+4.63)#71 |
| 72. | White Plains | 4.75% | 0.41%(+4.33)#13 | 0.22%(+4.53)#72 |
| 73. | Teton Village | 4.75% | 0.065%(+4.68)#1 | 0.22%(+4.53)#73 |
| 74. | Parkville | 4.66% | 0.10%(+4.55)#3 | 0.22%(+4.44)#74 |
| 75. | Finderne | 4.63% | 0.94%(+3.69)#16 | 0.22%(+4.41)#75 |
| 76. | Hebron | 4.61% | 0.43%(+4.19)#6 | 0.22%(+4.40)#76 |
| 77. | Clifton | 4.61% | 0.94%(+3.67)#17 | 0.22%(+4.39)#77 |
| 78. | Kendall West | 4.51% | 0.62%(+3.89)#8 | 0.22%(+4.30)#78 |
| 79. | Pembroke Park | 4.50% | 0.62%(+3.88)#9 | 0.22%(+4.29)#79 |
| 80. | Brentwood | 4.46% | 0.41%(+4.05)#14 | 0.22%(+4.25)#80 |
| 81. | Oak Grove | 4.46% | 0.47%(+3.99)#3 | 0.22%(+4.25)#81 |
| 82. | Sweden Valley | 4.41% | 0.10%(+4.31)#4 | 0.22%(+4.20)#82 |
| 83. | Donald | 4.34% | 0.11%(+4.23)#1 | 0.22%(+4.13)#83 |
| 84. | Downs | 4.31% | 0.11%(+4.21)#1 | 0.22%(+4.10)#84 |
| 85. | Salt Creek | 4.30% | 0.18%(+4.13)#3 | 0.22%(+4.09)#85 |
| 86. | Park Center | 4.23% | 0.18%(+4.06)#4 | 0.22%(+4.02)#86 |
| 87. | Hunters Creek | 4.22% | 0.62%(+3.60)#10 | 0.22%(+4.01)#87 |
| 88. | Three Lakes | 4.22% | 0.62%(+3.59)#11 | 0.22%(+4.00)#88 |
| 89. | Franklin | 4.21% | 0.13%(+4.08)#2 | 0.22%(+3.99)#89 |
| 90. | Glide | 4.20% | 0.11%(+4.09)#2 | 0.22%(+3.99)#90 |
| 91. | Virginia Gardens | 4.18% | 0.62%(+3.55)#12 | 0.22%(+3.96)#91 |
| 92. | Southchase | 4.15% | 0.62%(+3.53)#13 | 0.22%(+3.94)#92 |
| 93. | Bethune | 4.15% | 0.18%(+3.97)#5 | 0.22%(+3.93)#93 |
| 94. | West Miami | 4.14% | 0.62%(+3.51)#14 | 0.22%(+3.92)#94 |
| 95. | Tannersville | 4.08% | 0.41%(+3.66)#15 | 0.22%(+3.86)#95 |
| 96. | Ellsinore | 4.07% | 0.037%(+4.04)#1 | 0.22%(+3.86)#96 |
| 97. | Union City | 4.06% | 0.94%(+3.12)#18 | 0.22%(+3.84)#97 |
| 98. | Voorhees | 4.00% | 0.94%(+3.07)#19 | 0.22%(+3.79)#98 |
| 99. | Pine Hills | 3.96% | 0.29%(+3.67)#3 | 0.22%(+3.75)#99 |
| 100. | Watsessing | 3.95% | 0.94%(+3.01)#20 | 0.22%(+3.74)#100 |
Common Questions
What are the Top 10 Cities with the Highest Percentage of Peruvian Population in the United States?
Top 10 Cities with the Highest Percentage of Peruvian Population in the United States are:
#1
16.84%
#2
15.98%
#3
14.60%
#4
14.04%
#5
13.21%
#6
12.13%
#7
11.91%
#8
11.46%
#9
10.87%
#10
10.26%
What city has the Highest Percentage of Peruvian Population in the United States?
Queens Gate has the Highest Percentage of Peruvian Population in the United States with 16.84%.
What is the Percentage of Peruvian Population in the United States?
Percentage of Peruvian Population in the United States is 0.22%.