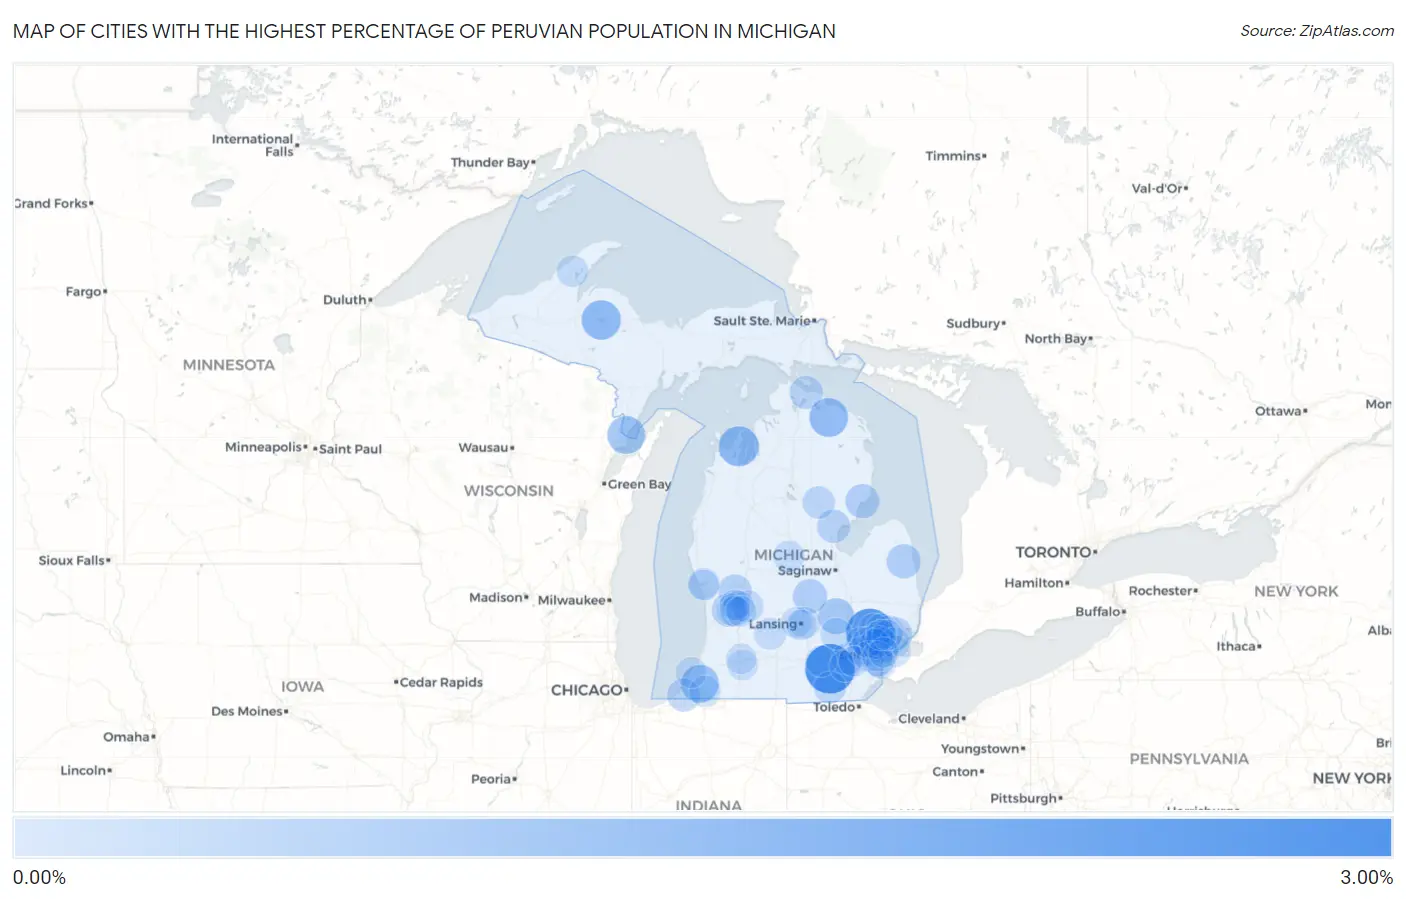
Cities with the Highest Percentage of Peruvian Population in Michigan
RELATED REPORTS & OPTIONS
Peruvian
Michigan
Compare Cities
Map of Cities with the Highest Percentage of Peruvian Population in Michigan
0.00%
3.00%
Cities with the Highest Percentage of Peruvian Population in Michigan
| City | Peruvian | vs State | vs National | |
| 1. | Manchester | 2.87% | 0.037%(+2.84)#1 | 0.22%(+2.66)#168 |
| 2. | Sylvan Lake | 2.60% | 0.037%(+2.57)#2 | 0.22%(+2.39)#197 |
| 3. | Suttons Bay | 1.40% | 0.037%(+1.36)#3 | 0.22%(+1.19)#490 |
| 4. | Michigamme | 1.33% | 0.037%(+1.29)#4 | 0.22%(+1.11)#517 |
| 5. | Millersburg | 1.23% | 0.037%(+1.20)#5 | 0.22%(+1.02)#562 |
| 6. | Menominee | 1.09% | 0.037%(+1.05)#6 | 0.22%(+0.876)#636 |
| 7. | Berrien Springs | 1.09% | 0.037%(+1.05)#7 | 0.22%(+0.873)#638 |
| 8. | Byron | 0.83% | 0.037%(+0.791)#8 | 0.22%(+0.613)#831 |
| 9. | Ferndale | 0.63% | 0.037%(+0.596)#9 | 0.22%(+0.418)#1,045 |
| 10. | Elsie | 0.60% | 0.037%(+0.563)#10 | 0.22%(+0.385)#1,097 |
| 11. | Deckerville | 0.57% | 0.037%(+0.530)#11 | 0.22%(+0.351)#1,151 |
| 12. | East Tawas | 0.56% | 0.037%(+0.523)#12 | 0.22%(+0.345)#1,167 |
| 13. | Sparta | 0.49% | 0.037%(+0.458)#13 | 0.22%(+0.279)#1,300 |
| 14. | Jenison | 0.49% | 0.037%(+0.454)#14 | 0.22%(+0.276)#1,316 |
| 15. | Standish | 0.45% | 0.037%(+0.414)#15 | 0.22%(+0.236)#1,417 |
| 16. | Cheboygan | 0.42% | 0.037%(+0.381)#16 | 0.22%(+0.203)#1,488 |
| 17. | Three Oaks | 0.41% | 0.037%(+0.377)#17 | 0.22%(+0.199)#1,500 |
| 18. | Mount Clemens | 0.32% | 0.037%(+0.282)#18 | 0.22%(+0.104)#1,761 |
| 19. | West Branch | 0.32% | 0.037%(+0.282)#19 | 0.22%(+0.103)#1,762 |
| 20. | Adrian | 0.28% | 0.037%(+0.240)#20 | 0.22%(+0.061)#1,917 |
| 21. | Birmingham | 0.24% | 0.037%(+0.207)#21 | 0.22%(+0.029)#2,086 |
| 22. | Grandville | 0.24% | 0.037%(+0.207)#22 | 0.22%(+0.028)#2,087 |
| 23. | Ann Arbor | 0.23% | 0.037%(+0.192)#23 | 0.22%(+0.014)#2,142 |
| 24. | Allen Park | 0.23% | 0.037%(+0.188)#24 | 0.22%(+0.010)#2,154 |
| 25. | Forest Hills | 0.23% | 0.037%(+0.188)#25 | 0.22%(+0.010)#2,157 |
| 26. | Nashville | 0.21% | 0.037%(+0.171)#26 | 0.22%(-0.007)#2,244 |
| 27. | Howell | 0.20% | 0.037%(+0.162)#27 | 0.22%(-0.017)#2,295 |
| 28. | North Muskegon | 0.20% | 0.037%(+0.159)#28 | 0.22%(-0.019)#2,314 |
| 29. | Pleasant Ridge | 0.19% | 0.037%(+0.155)#29 | 0.22%(-0.024)#2,335 |
| 30. | Houghton | 0.18% | 0.037%(+0.144)#30 | 0.22%(-0.035)#2,398 |
| 31. | Utica | 0.17% | 0.037%(+0.136)#31 | 0.22%(-0.042)#2,436 |
| 32. | East Lansing | 0.17% | 0.037%(+0.133)#32 | 0.22%(-0.046)#2,456 |
| 33. | Grass Lake | 0.16% | 0.037%(+0.127)#33 | 0.22%(-0.052)#2,483 |
| 34. | Grosse Pointe | 0.16% | 0.037%(+0.123)#34 | 0.22%(-0.055)#2,509 |
| 35. | Mount Pleasant | 0.16% | 0.037%(+0.119)#35 | 0.22%(-0.059)#2,536 |
| 36. | Livonia | 0.15% | 0.037%(+0.110)#36 | 0.22%(-0.069)#2,595 |
| 37. | Saline | 0.14% | 0.037%(+0.108)#37 | 0.22%(-0.070)#2,604 |
| 38. | Niles | 0.14% | 0.037%(+0.106)#38 | 0.22%(-0.072)#2,615 |
| 39. | Grand Rapids | 0.11% | 0.037%(+0.076)#39 | 0.22%(-0.103)#2,814 |
| 40. | St Joseph | 0.10% | 0.037%(+0.065)#40 | 0.22%(-0.113)#2,885 |
| 41. | Waverly | 0.097% | 0.037%(+0.060)#41 | 0.22%(-0.118)#2,924 |
| 42. | Novi | 0.091% | 0.037%(+0.054)#42 | 0.22%(-0.124)#2,973 |
| 43. | Portage | 0.080% | 0.037%(+0.043)#43 | 0.22%(-0.136)#3,058 |
| 44. | Walker | 0.075% | 0.037%(+0.039)#44 | 0.22%(-0.140)#3,096 |
| 45. | Plymouth | 0.075% | 0.037%(+0.038)#45 | 0.22%(-0.140)#3,100 |
| 46. | Wyoming | 0.063% | 0.037%(+0.026)#46 | 0.22%(-0.153)#3,219 |
| 47. | Bingham Farms | 0.062% | 0.037%(+0.025)#47 | 0.22%(-0.154)#3,226 |
| 48. | Westland | 0.057% | 0.037%(+0.020)#48 | 0.22%(-0.159)#3,277 |
| 49. | Kalamazoo | 0.056% | 0.037%(+0.019)#49 | 0.22%(-0.159)#3,286 |
| 50. | Lincoln Park | 0.055% | 0.037%(+0.018)#50 | 0.22%(-0.160)#3,291 |
| 51. | Lansing | 0.047% | 0.037%(+0.010)#51 | 0.22%(-0.168)#3,363 |
| 52. | Farmington Hills | 0.045% | 0.037%(+0.009)#52 | 0.22%(-0.170)#3,375 |
| 53. | Ypsilanti | 0.045% | 0.037%(+0.008)#53 | 0.22%(-0.171)#3,389 |
| 54. | Muskegon | 0.044% | 0.037%(+0.008)#54 | 0.22%(-0.171)#3,391 |
| 55. | Kentwood | 0.037% | 0.037%(+0.000)#55 | 0.22%(-0.178)#3,459 |
| 56. | Auburn Hills | 0.037% | 0.037%(-0.000)#56 | 0.22%(-0.179)#3,464 |
| 57. | Rochester Hills | 0.028% | 0.037%(-0.009)#57 | 0.22%(-0.188)#3,541 |
| 58. | Royal Oak | 0.028% | 0.037%(-0.009)#58 | 0.22%(-0.188)#3,543 |
| 59. | St Clair Shores | 0.026% | 0.037%(-0.011)#59 | 0.22%(-0.190)#3,562 |
| 60. | Wyandotte | 0.024% | 0.037%(-0.013)#60 | 0.22%(-0.191)#3,574 |
| 61. | Southfield | 0.017% | 0.037%(-0.020)#61 | 0.22%(-0.198)#3,637 |
| 62. | Dearborn | 0.015% | 0.037%(-0.022)#62 | 0.22%(-0.201)#3,652 |
| 63. | Sterling Heights | 0.014% | 0.037%(-0.023)#63 | 0.22%(-0.201)#3,658 |
| 64. | Troy | 0.013% | 0.037%(-0.024)#64 | 0.22%(-0.203)#3,670 |
| 65. | Detroit | 0.0055% | 0.037%(-0.031)#65 | 0.22%(-0.210)#3,697 |
Common Questions
What are the Top 10 Cities with the Highest Percentage of Peruvian Population in Michigan?
Top 10 Cities with the Highest Percentage of Peruvian Population in Michigan are:
#1
2.87%
#2
2.60%
#3
1.40%
#4
1.33%
#5
1.23%
#6
1.09%
#7
1.09%
#8
0.83%
#9
0.63%
#10
0.60%
What city has the Highest Percentage of Peruvian Population in Michigan?
Manchester has the Highest Percentage of Peruvian Population in Michigan with 2.87%.
What is the Percentage of Peruvian Population in the State of Michigan?
Percentage of Peruvian Population in Michigan is 0.037%.
What is the Percentage of Peruvian Population in the United States?
Percentage of Peruvian Population in the United States is 0.22%.