Zip Codes with the Highest Percentage of Population Employed in Transportation & Warehousing in New York
RELATED REPORTS & OPTIONS
Transportation & Warehousing
New York
Compare Zip Codes
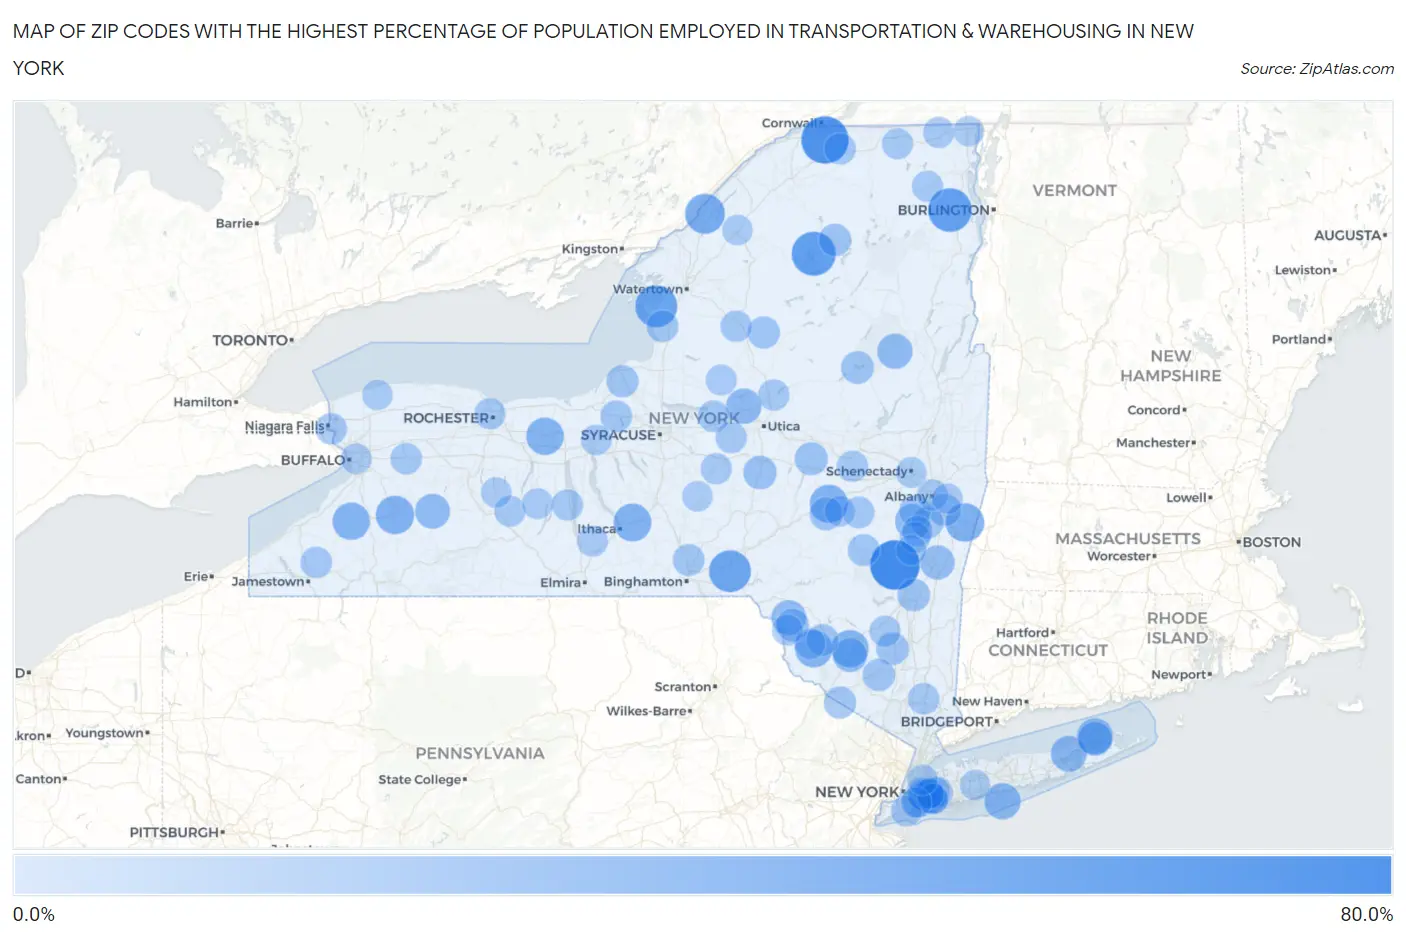
Map of Zip Codes with the Highest Percentage of Population Employed in Transportation & Warehousing in New York
0.0%
80.0%
Zip Codes with the Highest Percentage of Population Employed in Transportation & Warehousing in New York
| Zip Code | % Employed | vs State | vs National | |
| 1. | 12436 | 62.5% | 5.1%(+57.4)#1 | 4.9%(+57.6)#44 |
| 2. | 13649 | 56.2% | 5.1%(+51.2)#2 | 4.9%(+51.3)#58 |
| 3. | 12927 | 47.4% | 5.1%(+42.3)#3 | 4.9%(+42.4)#94 |
| 4. | 12924 | 46.3% | 5.1%(+41.2)#4 | 4.9%(+41.4)#98 |
| 5. | 13651 | 41.5% | 5.1%(+36.4)#5 | 4.9%(+36.5)#121 |
| 6. | 13813 | 41.0% | 5.1%(+36.0)#6 | 4.9%(+36.1)#124 |
| 7. | 13623 | 35.7% | 5.1%(+30.6)#7 | 4.9%(+30.8)#163 |
| 8. | 12195 | 32.4% | 5.1%(+27.3)#8 | 4.9%(+27.4)#195 |
| 9. | 14173 | 31.6% | 5.1%(+26.5)#9 | 4.9%(+26.7)#205 |
| 10. | 12064 | 30.8% | 5.1%(+25.7)#10 | 4.9%(+25.8)#213 |
| 11. | 13062 | 29.8% | 5.1%(+24.7)#11 | 4.9%(+24.9)#232 |
| 12. | 14537 | 29.5% | 5.1%(+24.4)#12 | 4.9%(+24.6)#237 |
| 13. | 12769 | 29.5% | 5.1%(+24.4)#13 | 4.9%(+24.6)#238 |
| 14. | 12762 | 29.3% | 5.1%(+24.2)#14 | 4.9%(+24.4)#242 |
| 15. | 14035 | 29.2% | 5.1%(+24.1)#15 | 4.9%(+24.2)#245 |
| 16. | 11770 | 26.3% | 5.1%(+21.2)#16 | 4.9%(+21.4)#304 |
| 17. | 11965 | 25.8% | 5.1%(+20.7)#17 | 4.9%(+20.9)#315 |
| 18. | 11948 | 24.9% | 5.1%(+19.8)#18 | 4.9%(+20.0)#341 |
| 19. | 13441 | 24.0% | 5.1%(+18.9)#19 | 4.9%(+19.1)#365 |
| 20. | 12811 | 23.1% | 5.1%(+18.0)#20 | 4.9%(+18.1)#392 |
| 21. | 12007 | 22.7% | 5.1%(+17.6)#21 | 4.9%(+17.7)#403 |
| 22. | 14130 | 22.5% | 5.1%(+17.4)#22 | 4.9%(+17.6)#409 |
| 23. | 12736 | 22.2% | 5.1%(+17.1)#23 | 4.9%(+17.3)#424 |
| 24. | 12513 | 21.1% | 5.1%(+16.0)#24 | 4.9%(+16.2)#472 |
| 25. | 12781 | 20.6% | 5.1%(+15.5)#25 | 4.9%(+15.6)#502 |
| 26. | 11964 | 20.6% | 5.1%(+15.5)#26 | 4.9%(+15.6)#506 |
| 27. | 13364 | 18.7% | 5.1%(+13.6)#27 | 4.9%(+13.7)#623 |
| 28. | 12036 | 17.7% | 5.1%(+12.7)#28 | 4.9%(+12.8)#707 |
| 29. | 13475 | 17.4% | 5.1%(+12.3)#29 | 4.9%(+12.4)#732 |
| 30. | 12766 | 16.9% | 5.1%(+11.8)#30 | 4.9%(+12.0)#781 |
| 31. | 12108 | 16.9% | 5.1%(+11.8)#31 | 4.9%(+11.9)#788 |
| 32. | 12507 | 16.5% | 5.1%(+11.4)#32 | 4.9%(+11.5)#854 |
| 33. | 12548 | 16.2% | 5.1%(+11.1)#33 | 4.9%(+11.2)#883 |
| 34. | 12973 | 16.1% | 5.1%(+11.0)#34 | 4.9%(+11.2)#890 |
| 35. | 11239 | 16.1% | 5.1%(+11.0)#35 | 4.9%(+11.2)#892 |
| 36. | 12543 | 15.8% | 5.1%(+10.8)#36 | 4.9%(+10.9)#930 |
| 37. | 13312 | 15.6% | 5.1%(+10.5)#37 | 4.9%(+10.7)#960 |
| 38. | 13115 | 15.4% | 5.1%(+10.4)#38 | 4.9%(+10.5)#981 |
| 39. | 10988 | 15.4% | 5.1%(+10.3)#39 | 4.9%(+10.5)#983 |
| 40. | 11436 | 15.4% | 5.1%(+10.3)#40 | 4.9%(+10.5)#985 |
| 41. | 11434 | 15.4% | 5.1%(+10.3)#41 | 4.9%(+10.4)#996 |
| 42. | 12063 | 15.1% | 5.1%(+9.98)#42 | 4.9%(+10.1)#1,054 |
| 43. | 11429 | 15.0% | 5.1%(+9.90)#43 | 4.9%(+10.0)#1,073 |
| 44. | 12045 | 14.9% | 5.1%(+9.85)#44 | 4.9%(+9.99)#1,078 |
| 45. | 12742 | 14.9% | 5.1%(+9.83)#45 | 4.9%(+9.97)#1,084 |
| 46. | 12407 | 14.7% | 5.1%(+9.62)#46 | 4.9%(+9.76)#1,122 |
| 47. | 11420 | 14.6% | 5.1%(+9.55)#47 | 4.9%(+9.69)#1,136 |
| 48. | 13636 | 14.3% | 5.1%(+9.20)#48 | 4.9%(+9.34)#1,211 |
| 49. | 13113 | 14.3% | 5.1%(+9.20)#49 | 4.9%(+9.34)#1,219 |
| 50. | 11418 | 14.3% | 5.1%(+9.20)#50 | 4.9%(+9.34)#1,223 |
| 51. | 13744 | 14.2% | 5.1%(+9.15)#51 | 4.9%(+9.29)#1,231 |
| 52. | 12071 | 13.9% | 5.1%(+8.81)#52 | 4.9%(+8.94)#1,306 |
| 53. | 13054 | 13.9% | 5.1%(+8.77)#53 | 4.9%(+8.91)#1,310 |
| 54. | 12957 | 13.7% | 5.1%(+8.65)#54 | 4.9%(+8.79)#1,337 |
| 55. | 11419 | 13.6% | 5.1%(+8.54)#55 | 4.9%(+8.68)#1,371 |
| 56. | 12067 | 13.5% | 5.1%(+8.46)#56 | 4.9%(+8.60)#1,381 |
| 57. | 14303 | 13.3% | 5.1%(+8.25)#57 | 4.9%(+8.39)#1,435 |
| 58. | 14040 | 13.3% | 5.1%(+8.25)#58 | 4.9%(+8.39)#1,436 |
| 59. | 14740 | 13.3% | 5.1%(+8.25)#59 | 4.9%(+8.39)#1,437 |
| 60. | 13404 | 13.2% | 5.1%(+8.13)#60 | 4.9%(+8.26)#1,479 |
| 61. | 10588 | 13.1% | 5.1%(+8.04)#61 | 4.9%(+8.18)#1,499 |
| 62. | 13435 | 13.0% | 5.1%(+7.88)#62 | 4.9%(+8.02)#1,544 |
| 63. | 13477 | 12.8% | 5.1%(+7.71)#63 | 4.9%(+7.85)#1,595 |
| 64. | 12440 | 12.8% | 5.1%(+7.70)#64 | 4.9%(+7.83)#1,601 |
| 65. | 13334 | 12.6% | 5.1%(+7.54)#65 | 4.9%(+7.68)#1,647 |
| 66. | 14613 | 12.6% | 5.1%(+7.49)#66 | 4.9%(+7.63)#1,657 |
| 67. | 14842 | 12.6% | 5.1%(+7.48)#67 | 4.9%(+7.61)#1,661 |
| 68. | 12166 | 12.5% | 5.1%(+7.42)#68 | 4.9%(+7.55)#1,673 |
| 69. | 12959 | 12.4% | 5.1%(+7.30)#69 | 4.9%(+7.44)#1,718 |
| 70. | 12207 | 12.4% | 5.1%(+7.28)#70 | 4.9%(+7.42)#1,725 |
| 71. | 12978 | 12.3% | 5.1%(+7.25)#71 | 4.9%(+7.38)#1,738 |
| 72. | 12749 | 12.3% | 5.1%(+7.23)#72 | 4.9%(+7.37)#1,748 |
| 73. | 14808 | 12.2% | 5.1%(+7.15)#73 | 4.9%(+7.28)#1,774 |
| 74. | 12920 | 12.1% | 5.1%(+7.02)#74 | 4.9%(+7.16)#1,808 |
| 75. | 11412 | 12.1% | 5.1%(+6.99)#75 | 4.9%(+7.12)#1,827 |
| 76. | 11003 | 11.9% | 5.1%(+6.84)#76 | 4.9%(+6.98)#1,896 |
| 77. | 12723 | 11.8% | 5.1%(+6.76)#77 | 4.9%(+6.90)#1,921 |
| 78. | 13471 | 11.8% | 5.1%(+6.74)#78 | 4.9%(+6.88)#1,931 |
| 79. | 12042 | 11.8% | 5.1%(+6.71)#79 | 4.9%(+6.85)#1,949 |
| 80. | 14418 | 11.8% | 5.1%(+6.68)#80 | 4.9%(+6.82)#1,962 |
| 81. | 14805 | 11.7% | 5.1%(+6.65)#81 | 4.9%(+6.78)#1,983 |
| 82. | 14212 | 11.7% | 5.1%(+6.59)#82 | 4.9%(+6.73)#1,998 |
| 83. | 11422 | 11.6% | 5.1%(+6.52)#83 | 4.9%(+6.66)#2,020 |
| 84. | 12175 | 11.6% | 5.1%(+6.51)#84 | 4.9%(+6.65)#2,028 |
| 85. | 13117 | 11.6% | 5.1%(+6.49)#85 | 4.9%(+6.62)#2,042 |
| 86. | 12196 | 11.4% | 5.1%(+6.35)#86 | 4.9%(+6.49)#2,101 |
| 87. | 12087 | 11.4% | 5.1%(+6.35)#87 | 4.9%(+6.49)#2,103 |
| 88. | 11413 | 11.3% | 5.1%(+6.25)#88 | 4.9%(+6.38)#2,160 |
| 89. | 11224 | 11.2% | 5.1%(+6.16)#89 | 4.9%(+6.29)#2,210 |
| 90. | 11433 | 11.1% | 5.1%(+6.02)#90 | 4.9%(+6.16)#2,281 |
| 91. | 12307 | 11.0% | 5.1%(+5.96)#91 | 4.9%(+6.10)#2,304 |
| 92. | 11236 | 10.9% | 5.1%(+5.87)#92 | 4.9%(+6.00)#2,347 |
| 93. | 14560 | 10.9% | 5.1%(+5.79)#93 | 4.9%(+5.93)#2,378 |
| 94. | 13124 | 10.8% | 5.1%(+5.73)#94 | 4.9%(+5.86)#2,416 |
| 95. | 13642 | 10.7% | 5.1%(+5.66)#95 | 4.9%(+5.79)#2,452 |
| 96. | 12919 | 10.7% | 5.1%(+5.58)#96 | 4.9%(+5.72)#2,488 |
| 97. | 11356 | 10.7% | 5.1%(+5.58)#97 | 4.9%(+5.71)#2,490 |
| 98. | 12451 | 10.6% | 5.1%(+5.47)#98 | 4.9%(+5.61)#2,558 |
| 99. | 11798 | 10.4% | 5.1%(+5.32)#99 | 4.9%(+5.45)#2,643 |
| 100. | 14008 | 10.4% | 5.1%(+5.30)#100 | 4.9%(+5.44)#2,650 |
Common Questions
What are the Top 10 Zip Codes with the Highest Percentage of Population Employed in Transportation & Warehousing in New York?
Top 10 Zip Codes with the Highest Percentage of Population Employed in Transportation & Warehousing in New York are:
What zip code has the Highest Percentage of Population Employed in Transportation & Warehousing in New York?
12436 has the Highest Percentage of Population Employed in Transportation & Warehousing in New York with 62.5%.
What is the Percentage of Population Employed in Transportation & Warehousing in the State of New York?
Percentage of Population Employed in Transportation & Warehousing in New York is 5.1%.
What is the Percentage of Population Employed in Transportation & Warehousing in the United States?
Percentage of Population Employed in Transportation & Warehousing in the United States is 4.9%.