Cities with the Largest Subsaharan African Community in Michigan
RELATED REPORTS & OPTIONS
Subsaharan African
Michigan
Compare Cities
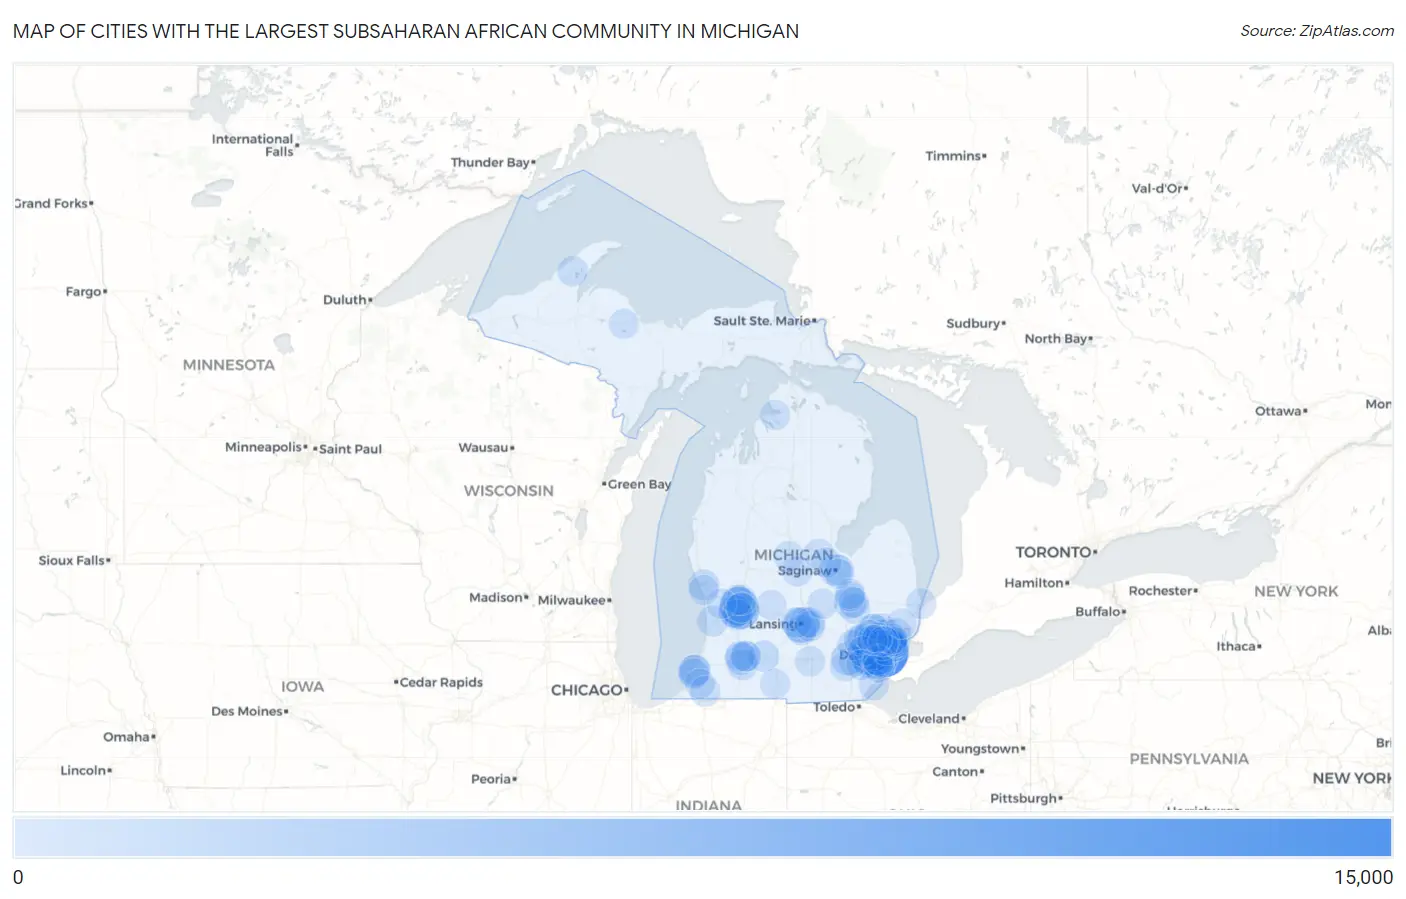
Map of Cities with the Largest Subsaharan African Community in Michigan
0
15,000
Cities with the Largest Subsaharan African Community in Michigan
| City | Subsaharan African | vs State | vs National | |
| 1. | Detroit | 11,539 | 82,845(13.93%)#1 | 4,023,199(0.29%)#35 |
| 2. | Grand Rapids | 4,779 | 82,845(5.77%)#2 | 4,023,199(0.12%)#100 |
| 3. | Westland | 3,769 | 82,845(4.55%)#3 | 4,023,199(0.09%)#132 |
| 4. | Kentwood | 3,329 | 82,845(4.02%)#4 | 4,023,199(0.08%)#162 |
| 5. | Lansing | 3,104 | 82,845(3.75%)#5 | 4,023,199(0.08%)#177 |
| 6. | Inkster | 2,175 | 82,845(2.63%)#6 | 4,023,199(0.05%)#272 |
| 7. | Southfield | 2,101 | 82,845(2.54%)#7 | 4,023,199(0.05%)#281 |
| 8. | Ann Arbor | 1,666 | 82,845(2.01%)#8 | 4,023,199(0.04%)#367 |
| 9. | Wyoming | 1,632 | 82,845(1.97%)#9 | 4,023,199(0.04%)#373 |
| 10. | Flint | 1,185 | 82,845(1.43%)#10 | 4,023,199(0.03%)#505 |
| 11. | Wayne | 1,179 | 82,845(1.42%)#11 | 4,023,199(0.03%)#507 |
| 12. | Benton Harbor | 1,119 | 82,845(1.35%)#12 | 4,023,199(0.03%)#533 |
| 13. | Taylor | 1,082 | 82,845(1.31%)#13 | 4,023,199(0.03%)#547 |
| 14. | Farmington Hills | 1,081 | 82,845(1.30%)#14 | 4,023,199(0.03%)#548 |
| 15. | Livonia | 1,052 | 82,845(1.27%)#15 | 4,023,199(0.03%)#566 |
| 16. | Kalamazoo | 1,028 | 82,845(1.24%)#16 | 4,023,199(0.03%)#576 |
| 17. | Saginaw | 1,016 | 82,845(1.23%)#17 | 4,023,199(0.03%)#585 |
| 18. | Novi | 942 | 82,845(1.14%)#18 | 4,023,199(0.02%)#626 |
| 19. | Sterling Heights | 883 | 82,845(1.07%)#19 | 4,023,199(0.02%)#650 |
| 20. | Romulus | 802 | 82,845(0.97%)#20 | 4,023,199(0.02%)#715 |
| 21. | Warren | 798 | 82,845(0.96%)#21 | 4,023,199(0.02%)#717 |
| 22. | Pontiac | 702 | 82,845(0.85%)#22 | 4,023,199(0.02%)#816 |
| 23. | Oak Park | 613 | 82,845(0.74%)#23 | 4,023,199(0.02%)#927 |
| 24. | Battle Creek | 569 | 82,845(0.69%)#24 | 4,023,199(0.01%)#981 |
| 25. | Muskegon | 561 | 82,845(0.68%)#25 | 4,023,199(0.01%)#994 |
| 26. | East Lansing | 556 | 82,845(0.67%)#26 | 4,023,199(0.01%)#1,003 |
| 27. | Dearborn | 513 | 82,845(0.62%)#27 | 4,023,199(0.01%)#1,065 |
| 28. | Cutlerville | 507 | 82,845(0.61%)#28 | 4,023,199(0.01%)#1,076 |
| 29. | Benton Heights | 500 | 82,845(0.60%)#29 | 4,023,199(0.01%)#1,087 |
| 30. | Holland | 433 | 82,845(0.52%)#30 | 4,023,199(0.01%)#1,230 |
| 31. | Troy | 428 | 82,845(0.52%)#31 | 4,023,199(0.01%)#1,240 |
| 32. | Highland Park | 394 | 82,845(0.48%)#32 | 4,023,199(0.01%)#1,318 |
| 33. | Garden City | 383 | 82,845(0.46%)#33 | 4,023,199(0.01%)#1,348 |
| 34. | Rochester Hills | 377 | 82,845(0.46%)#34 | 4,023,199(0.01%)#1,359 |
| 35. | Holt | 348 | 82,845(0.42%)#35 | 4,023,199(0.01%)#1,426 |
| 36. | Portage | 340 | 82,845(0.41%)#36 | 4,023,199(0.01%)#1,450 |
| 37. | Waverly | 337 | 82,845(0.41%)#37 | 4,023,199(0.01%)#1,463 |
| 38. | Fair Plain | 333 | 82,845(0.40%)#38 | 4,023,199(0.01%)#1,479 |
| 39. | Okemos | 326 | 82,845(0.39%)#39 | 4,023,199(0.01%)#1,501 |
| 40. | Niles | 322 | 82,845(0.39%)#40 | 4,023,199(0.01%)#1,516 |
| 41. | Mount Clemens | 303 | 82,845(0.37%)#41 | 4,023,199(0.01%)#1,570 |
| 42. | Eastpointe | 285 | 82,845(0.34%)#42 | 4,023,199(0.01%)#1,628 |
| 43. | Dearborn Heights | 283 | 82,845(0.34%)#43 | 4,023,199(0.01%)#1,635 |
| 44. | Ypsilanti | 260 | 82,845(0.31%)#44 | 4,023,199(0.01%)#1,727 |
| 45. | River Rouge | 244 | 82,845(0.29%)#45 | 4,023,199(0.01%)#1,802 |
| 46. | Ecorse | 234 | 82,845(0.28%)#46 | 4,023,199(0.01%)#1,852 |
| 47. | Stony Point | 225 | 82,845(0.27%)#47 | 4,023,199(0.01%)#1,902 |
| 48. | Eastwood | 220 | 82,845(0.27%)#48 | 4,023,199(0.01%)#1,936 |
| 49. | Buena Vista | 215 | 82,845(0.26%)#49 | 4,023,199(0.01%)#1,964 |
| 50. | Comstock Northwest | 213 | 82,845(0.26%)#50 | 4,023,199(0.01%)#1,976 |
| 51. | Port Huron | 212 | 82,845(0.26%)#51 | 4,023,199(0.01%)#1,981 |
| 52. | St Louis | 208 | 82,845(0.25%)#52 | 4,023,199(0.01%)#2,011 |
| 53. | Westwood | 207 | 82,845(0.25%)#53 | 4,023,199(0.01%)#2,017 |
| 54. | Southgate | 205 | 82,845(0.25%)#54 | 4,023,199(0.01%)#2,022 |
| 55. | Houghton | 194 | 82,845(0.23%)#55 | 4,023,199(0.00%)#2,099 |
| 56. | Mount Pleasant | 193 | 82,845(0.23%)#56 | 4,023,199(0.00%)#2,105 |
| 57. | Grand Blanc | 176 | 82,845(0.21%)#57 | 4,023,199(0.00%)#2,235 |
| 58. | Haslett | 170 | 82,845(0.21%)#58 | 4,023,199(0.00%)#2,282 |
| 59. | South Lyon | 164 | 82,845(0.20%)#59 | 4,023,199(0.00%)#2,326 |
| 60. | Royal Oak | 163 | 82,845(0.20%)#60 | 4,023,199(0.00%)#2,330 |
| 61. | Wixom | 158 | 82,845(0.19%)#61 | 4,023,199(0.00%)#2,384 |
| 62. | Harper Woods | 143 | 82,845(0.17%)#62 | 4,023,199(0.00%)#2,533 |
| 63. | Jackson | 142 | 82,845(0.17%)#63 | 4,023,199(0.00%)#2,545 |
| 64. | Lincoln Park | 141 | 82,845(0.17%)#64 | 4,023,199(0.00%)#2,551 |
| 65. | Hamtramck | 140 | 82,845(0.17%)#65 | 4,023,199(0.00%)#2,559 |
| 66. | St Clair Shores | 137 | 82,845(0.17%)#66 | 4,023,199(0.00%)#2,587 |
| 67. | Roseville | 137 | 82,845(0.17%)#67 | 4,023,199(0.00%)#2,588 |
| 68. | Auburn Hills | 137 | 82,845(0.17%)#68 | 4,023,199(0.00%)#2,592 |
| 69. | Mount Morris | 135 | 82,845(0.16%)#69 | 4,023,199(0.00%)#2,624 |
| 70. | Walled Lake | 131 | 82,845(0.16%)#70 | 4,023,199(0.00%)#2,663 |
| 71. | Burton | 120 | 82,845(0.14%)#71 | 4,023,199(0.00%)#2,797 |
| 72. | Coldwater | 120 | 82,845(0.14%)#72 | 4,023,199(0.00%)#2,801 |
| 73. | Saline | 115 | 82,845(0.14%)#73 | 4,023,199(0.00%)#2,848 |
| 74. | Midland | 114 | 82,845(0.14%)#74 | 4,023,199(0.00%)#2,856 |
| 75. | Ionia | 114 | 82,845(0.14%)#75 | 4,023,199(0.00%)#2,857 |
| 76. | Northview | 113 | 82,845(0.14%)#76 | 4,023,199(0.00%)#2,869 |
| 77. | Comstock Park | 107 | 82,845(0.13%)#77 | 4,023,199(0.00%)#2,940 |
| 78. | Orchard Lake Village | 101 | 82,845(0.12%)#78 | 4,023,199(0.00%)#3,052 |
| 79. | Plymouth | 100 | 82,845(0.12%)#79 | 4,023,199(0.00%)#3,062 |
| 80. | Owosso | 99 | 82,845(0.12%)#80 | 4,023,199(0.00%)#3,075 |
| 81. | Ferndale | 98 | 82,845(0.12%)#81 | 4,023,199(0.00%)#3,097 |
| 82. | Berrien Springs | 90 | 82,845(0.11%)#82 | 4,023,199(0.00%)#3,260 |
| 83. | Scotts | 90 | 82,845(0.11%)#83 | 4,023,199(0.00%)#3,263 |
| 84. | Fraser | 79 | 82,845(0.10%)#84 | 4,023,199(0.00%)#3,471 |
| 85. | Freeland | 79 | 82,845(0.10%)#85 | 4,023,199(0.00%)#3,475 |
| 86. | Allendale | 74 | 82,845(0.09%)#86 | 4,023,199(0.00%)#3,580 |
| 87. | Beverly Hills | 72 | 82,845(0.09%)#87 | 4,023,199(0.00%)#3,619 |
| 88. | Belleville | 69 | 82,845(0.08%)#88 | 4,023,199(0.00%)#3,710 |
| 89. | Allen Park | 63 | 82,845(0.08%)#89 | 4,023,199(0.00%)#3,848 |
| 90. | Birmingham | 63 | 82,845(0.08%)#90 | 4,023,199(0.00%)#3,850 |
| 91. | New Haven | 61 | 82,845(0.07%)#91 | 4,023,199(0.00%)#3,936 |
| 92. | Madison Heights | 60 | 82,845(0.07%)#92 | 4,023,199(0.00%)#3,950 |
| 93. | Ishpeming | 58 | 82,845(0.07%)#93 | 4,023,199(0.00%)#4,018 |
| 94. | Norton Shores | 53 | 82,845(0.06%)#94 | 4,023,199(0.00%)#4,157 |
| 95. | Beecher | 53 | 82,845(0.06%)#95 | 4,023,199(0.00%)#4,173 |
| 96. | Bridgeport | 53 | 82,845(0.06%)#96 | 4,023,199(0.00%)#4,177 |
| 97. | Petoskey | 53 | 82,845(0.06%)#97 | 4,023,199(0.00%)#4,181 |
| 98. | Franklin | 53 | 82,845(0.06%)#98 | 4,023,199(0.00%)#4,190 |
| 99. | Riverview | 50 | 82,845(0.06%)#99 | 4,023,199(0.00%)#4,263 |
| 100. | East Grand Rapids | 50 | 82,845(0.06%)#100 | 4,023,199(0.00%)#4,266 |
Common Questions
What are the Top 10 Cities with the Largest Subsaharan African Community in Michigan?
Top 10 Cities with the Largest Subsaharan African Community in Michigan are:
#1
11,539
#2
4,779
#3
3,769
#4
3,329
#5
3,104
#6
2,175
#7
2,101
#8
1,666
#9
1,632
#10
1,185
What city has the Largest Subsaharan African Community in Michigan?
Detroit has the Largest Subsaharan African Community in Michigan with 11,539.
What is the Total Subsaharan African Population in the State of Michigan?
Total Subsaharan African Population in Michigan is 82,845.
What is the Total Subsaharan African Population in the United States?
Total Subsaharan African Population in the United States is 4,023,199.