Cities with the Largest Subsaharan African Community in Missouri
RELATED REPORTS & OPTIONS
Subsaharan African
Missouri
Compare Cities
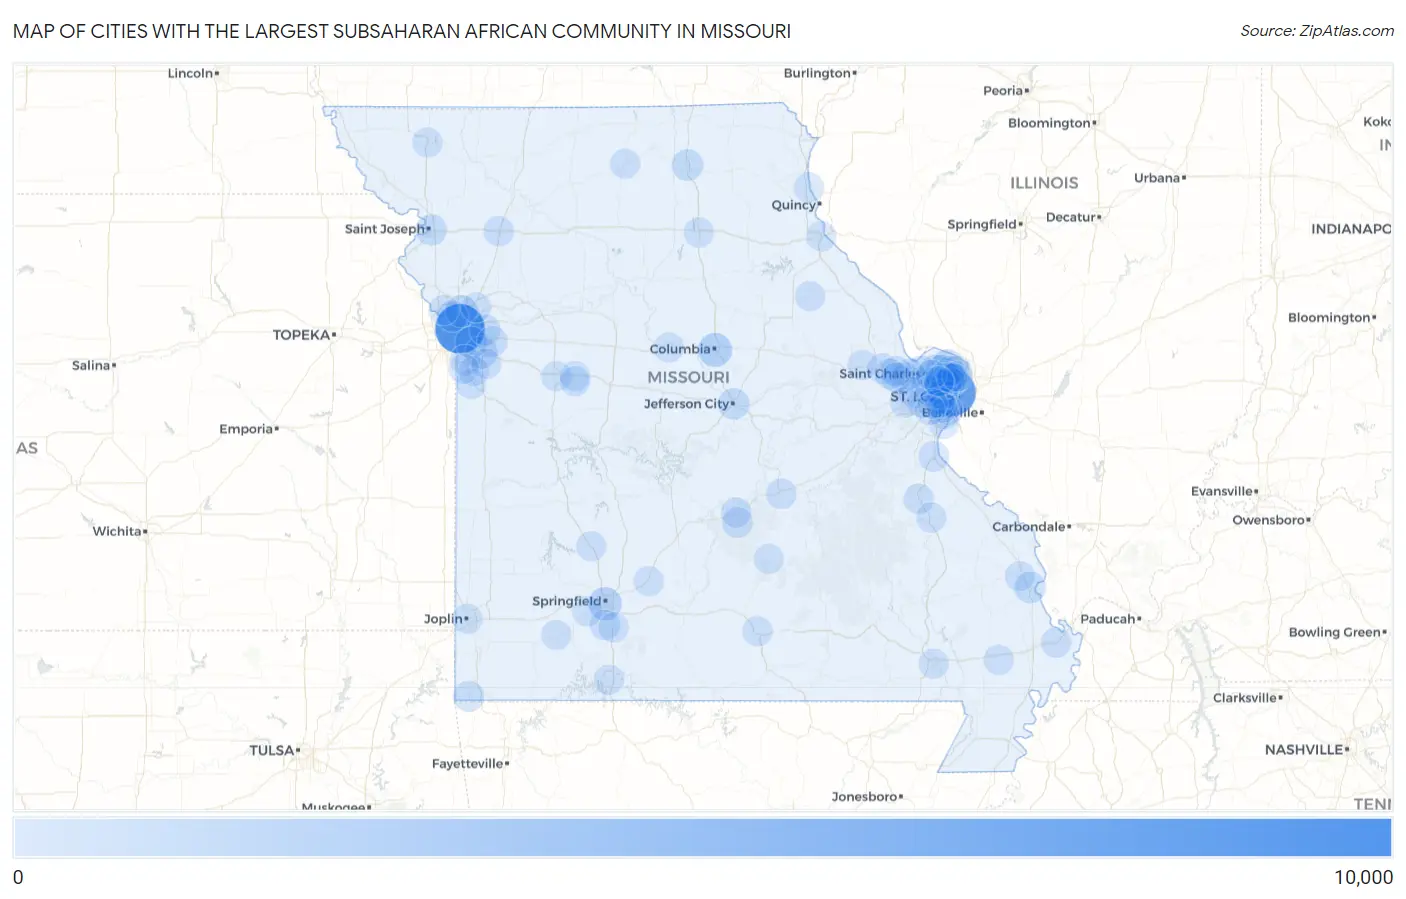
Map of Cities with the Largest Subsaharan African Community in Missouri
0
10,000
Cities with the Largest Subsaharan African Community in Missouri
| City | Subsaharan African | vs State | vs National | |
| 1. | Kansas City | 9,004 | 47,613(18.91%)#1 | 4,023,199(0.22%)#48 |
| 2. | St Louis | 7,710 | 47,613(16.19%)#2 | 4,023,199(0.19%)#60 |
| 3. | Columbia | 1,746 | 47,613(3.67%)#3 | 4,023,199(0.04%)#350 |
| 4. | Springfield | 1,421 | 47,613(2.98%)#4 | 4,023,199(0.04%)#439 |
| 5. | Hazelwood | 1,221 | 47,613(2.56%)#5 | 4,023,199(0.03%)#496 |
| 6. | Florissant | 947 | 47,613(1.99%)#6 | 4,023,199(0.02%)#621 |
| 7. | Lee S Summit | 944 | 47,613(1.98%)#7 | 4,023,199(0.02%)#622 |
| 8. | Raytown | 795 | 47,613(1.67%)#8 | 4,023,199(0.02%)#721 |
| 9. | Gladstone | 784 | 47,613(1.65%)#9 | 4,023,199(0.02%)#735 |
| 10. | Old Jamestown | 651 | 47,613(1.37%)#10 | 4,023,199(0.02%)#868 |
| 11. | Cape Girardeau | 646 | 47,613(1.36%)#11 | 4,023,199(0.02%)#878 |
| 12. | Kirksville | 628 | 47,613(1.32%)#12 | 4,023,199(0.02%)#902 |
| 13. | Jefferson City | 612 | 47,613(1.29%)#13 | 4,023,199(0.02%)#929 |
| 14. | University City | 600 | 47,613(1.26%)#14 | 4,023,199(0.01%)#941 |
| 15. | Spanish Lake | 541 | 47,613(1.14%)#15 | 4,023,199(0.01%)#1,022 |
| 16. | Ferguson | 539 | 47,613(1.13%)#16 | 4,023,199(0.01%)#1,026 |
| 17. | Maryland Heights | 520 | 47,613(1.09%)#17 | 4,023,199(0.01%)#1,055 |
| 18. | St Charles | 476 | 47,613(1.00%)#18 | 4,023,199(0.01%)#1,128 |
| 19. | St Joseph | 471 | 47,613(0.99%)#19 | 4,023,199(0.01%)#1,140 |
| 20. | Overland | 467 | 47,613(0.98%)#20 | 4,023,199(0.01%)#1,152 |
| 21. | Riverside | 443 | 47,613(0.93%)#21 | 4,023,199(0.01%)#1,207 |
| 22. | Independence | 431 | 47,613(0.91%)#22 | 4,023,199(0.01%)#1,235 |
| 23. | Noel | 390 | 47,613(0.82%)#23 | 4,023,199(0.01%)#1,328 |
| 24. | Bellefontaine Neighbors | 334 | 47,613(0.70%)#24 | 4,023,199(0.01%)#1,474 |
| 25. | Rock Hill | 317 | 47,613(0.67%)#25 | 4,023,199(0.01%)#1,527 |
| 26. | Berkeley | 308 | 47,613(0.65%)#26 | 4,023,199(0.01%)#1,553 |
| 27. | Fort Leonard Wood | 284 | 47,613(0.60%)#27 | 4,023,199(0.01%)#1,632 |
| 28. | St Ann | 270 | 47,613(0.57%)#28 | 4,023,199(0.01%)#1,688 |
| 29. | Dellwood | 269 | 47,613(0.56%)#29 | 4,023,199(0.01%)#1,692 |
| 30. | Wentzville | 256 | 47,613(0.54%)#30 | 4,023,199(0.01%)#1,749 |
| 31. | St Peters | 239 | 47,613(0.50%)#31 | 4,023,199(0.01%)#1,818 |
| 32. | Jennings | 220 | 47,613(0.46%)#32 | 4,023,199(0.01%)#1,935 |
| 33. | Cottleville | 208 | 47,613(0.44%)#33 | 4,023,199(0.01%)#2,013 |
| 34. | Richmond Heights | 205 | 47,613(0.43%)#34 | 4,023,199(0.01%)#2,025 |
| 35. | Olivette | 192 | 47,613(0.40%)#35 | 4,023,199(0.00%)#2,121 |
| 36. | Cameron | 186 | 47,613(0.39%)#36 | 4,023,199(0.00%)#2,154 |
| 37. | Rolla | 185 | 47,613(0.39%)#37 | 4,023,199(0.00%)#2,159 |
| 38. | Blue Springs | 182 | 47,613(0.38%)#38 | 4,023,199(0.00%)#2,184 |
| 39. | Chesterfield | 179 | 47,613(0.38%)#39 | 4,023,199(0.00%)#2,213 |
| 40. | O Fallon | 177 | 47,613(0.37%)#40 | 4,023,199(0.00%)#2,226 |
| 41. | Calverton Park | 176 | 47,613(0.37%)#41 | 4,023,199(0.00%)#2,236 |
| 42. | Festus | 174 | 47,613(0.37%)#42 | 4,023,199(0.00%)#2,251 |
| 43. | Manchester | 166 | 47,613(0.35%)#43 | 4,023,199(0.00%)#2,311 |
| 44. | Clayton | 164 | 47,613(0.34%)#44 | 4,023,199(0.00%)#2,323 |
| 45. | Wildwood | 160 | 47,613(0.34%)#45 | 4,023,199(0.00%)#2,361 |
| 46. | Mehlville | 159 | 47,613(0.33%)#46 | 4,023,199(0.00%)#2,371 |
| 47. | Nixa | 157 | 47,613(0.33%)#47 | 4,023,199(0.00%)#2,395 |
| 48. | Creve Coeur | 157 | 47,613(0.33%)#48 | 4,023,199(0.00%)#2,397 |
| 49. | St John | 153 | 47,613(0.32%)#49 | 4,023,199(0.00%)#2,433 |
| 50. | Grandview | 149 | 47,613(0.31%)#50 | 4,023,199(0.00%)#2,472 |
| 51. | Peculiar | 140 | 47,613(0.29%)#51 | 4,023,199(0.00%)#2,566 |
| 52. | Charleston | 135 | 47,613(0.28%)#52 | 4,023,199(0.00%)#2,623 |
| 53. | Lake St Louis | 133 | 47,613(0.28%)#53 | 4,023,199(0.00%)#2,644 |
| 54. | St Robert | 123 | 47,613(0.26%)#54 | 4,023,199(0.00%)#2,768 |
| 55. | Normandy | 120 | 47,613(0.25%)#55 | 4,023,199(0.00%)#2,805 |
| 56. | Bonne Terre | 118 | 47,613(0.25%)#56 | 4,023,199(0.00%)#2,816 |
| 57. | Moline Acres | 118 | 47,613(0.25%)#57 | 4,023,199(0.00%)#2,819 |
| 58. | Lemay | 101 | 47,613(0.21%)#58 | 4,023,199(0.00%)#3,037 |
| 59. | Aurora | 100 | 47,613(0.21%)#59 | 4,023,199(0.00%)#3,065 |
| 60. | Oakville | 99 | 47,613(0.21%)#60 | 4,023,199(0.00%)#3,069 |
| 61. | Raymore | 99 | 47,613(0.21%)#61 | 4,023,199(0.00%)#3,070 |
| 62. | Farmington | 99 | 47,613(0.21%)#62 | 4,023,199(0.00%)#3,072 |
| 63. | Wright City | 96 | 47,613(0.20%)#63 | 4,023,199(0.00%)#3,152 |
| 64. | Breckenridge Hills | 96 | 47,613(0.20%)#64 | 4,023,199(0.00%)#3,153 |
| 65. | Black Jack | 88 | 47,613(0.18%)#65 | 4,023,199(0.00%)#3,290 |
| 66. | Belton | 83 | 47,613(0.17%)#66 | 4,023,199(0.00%)#3,382 |
| 67. | Blue Summit | 82 | 47,613(0.17%)#67 | 4,023,199(0.00%)#3,418 |
| 68. | Macon | 81 | 47,613(0.17%)#68 | 4,023,199(0.00%)#3,437 |
| 69. | Joplin | 80 | 47,613(0.17%)#69 | 4,023,199(0.00%)#3,443 |
| 70. | Castle Point | 80 | 47,613(0.17%)#70 | 4,023,199(0.00%)#3,462 |
| 71. | Bridgeton | 78 | 47,613(0.16%)#71 | 4,023,199(0.00%)#3,488 |
| 72. | Liberty | 77 | 47,613(0.16%)#72 | 4,023,199(0.00%)#3,506 |
| 73. | Branson | 74 | 47,613(0.16%)#73 | 4,023,199(0.00%)#3,586 |
| 74. | Bolivar | 74 | 47,613(0.16%)#74 | 4,023,199(0.00%)#3,587 |
| 75. | Dardenne Prairie | 71 | 47,613(0.15%)#75 | 4,023,199(0.00%)#3,646 |
| 76. | Greenwood | 68 | 47,613(0.14%)#76 | 4,023,199(0.00%)#3,729 |
| 77. | Willow Springs | 68 | 47,613(0.14%)#77 | 4,023,199(0.00%)#3,735 |
| 78. | Milan | 68 | 47,613(0.14%)#78 | 4,023,199(0.00%)#3,736 |
| 79. | Marshfield | 66 | 47,613(0.14%)#79 | 4,023,199(0.00%)#3,778 |
| 80. | Webster Groves | 64 | 47,613(0.13%)#80 | 4,023,199(0.00%)#3,817 |
| 81. | Jackson | 64 | 47,613(0.13%)#81 | 4,023,199(0.00%)#3,823 |
| 82. | Glasgow Village | 63 | 47,613(0.13%)#82 | 4,023,199(0.00%)#3,862 |
| 83. | Ozark | 62 | 47,613(0.13%)#83 | 4,023,199(0.00%)#3,886 |
| 84. | Warrensburg | 62 | 47,613(0.13%)#84 | 4,023,199(0.00%)#3,887 |
| 85. | Boonville | 59 | 47,613(0.12%)#85 | 4,023,199(0.00%)#3,984 |
| 86. | Penermon | 59 | 47,613(0.12%)#86 | 4,023,199(0.00%)#3,999 |
| 87. | Knob Noster | 57 | 47,613(0.12%)#87 | 4,023,199(0.00%)#4,060 |
| 88. | Affton | 55 | 47,613(0.12%)#88 | 4,023,199(0.00%)#4,092 |
| 89. | Maryville | 55 | 47,613(0.12%)#89 | 4,023,199(0.00%)#4,101 |
| 90. | Whiteman Afb | 53 | 47,613(0.11%)#90 | 4,023,199(0.00%)#4,187 |
| 91. | Fenton | 53 | 47,613(0.11%)#91 | 4,023,199(0.00%)#4,188 |
| 92. | Republic | 52 | 47,613(0.11%)#92 | 4,023,199(0.00%)#4,196 |
| 93. | Hannibal | 52 | 47,613(0.11%)#93 | 4,023,199(0.00%)#4,198 |
| 94. | Parkville | 52 | 47,613(0.11%)#94 | 4,023,199(0.00%)#4,206 |
| 95. | Licking | 50 | 47,613(0.11%)#95 | 4,023,199(0.00%)#4,281 |
| 96. | Poplar Bluff | 49 | 47,613(0.10%)#96 | 4,023,199(0.00%)#4,292 |
| 97. | Kirkwood | 48 | 47,613(0.10%)#97 | 4,023,199(0.00%)#4,326 |
| 98. | Woodson Terrace | 46 | 47,613(0.10%)#98 | 4,023,199(0.00%)#4,441 |
| 99. | La Grange | 43 | 47,613(0.09%)#99 | 4,023,199(0.00%)#4,584 |
| 100. | Vandalia | 42 | 47,613(0.09%)#100 | 4,023,199(0.00%)#4,608 |
Common Questions
What are the Top 10 Cities with the Largest Subsaharan African Community in Missouri?
Top 10 Cities with the Largest Subsaharan African Community in Missouri are:
#1
9,004
#2
7,710
#3
1,746
#4
1,421
#5
1,221
#6
947
#7
944
#8
795
#9
784
#10
651
What city has the Largest Subsaharan African Community in Missouri?
Kansas City has the Largest Subsaharan African Community in Missouri with 9,004.
What is the Total Subsaharan African Population in the State of Missouri?
Total Subsaharan African Population in Missouri is 47,613.
What is the Total Subsaharan African Population in the United States?
Total Subsaharan African Population in the United States is 4,023,199.