Cities with the Largest Subsaharan African Community in Indiana
RELATED REPORTS & OPTIONS
Subsaharan African
Indiana
Compare Cities
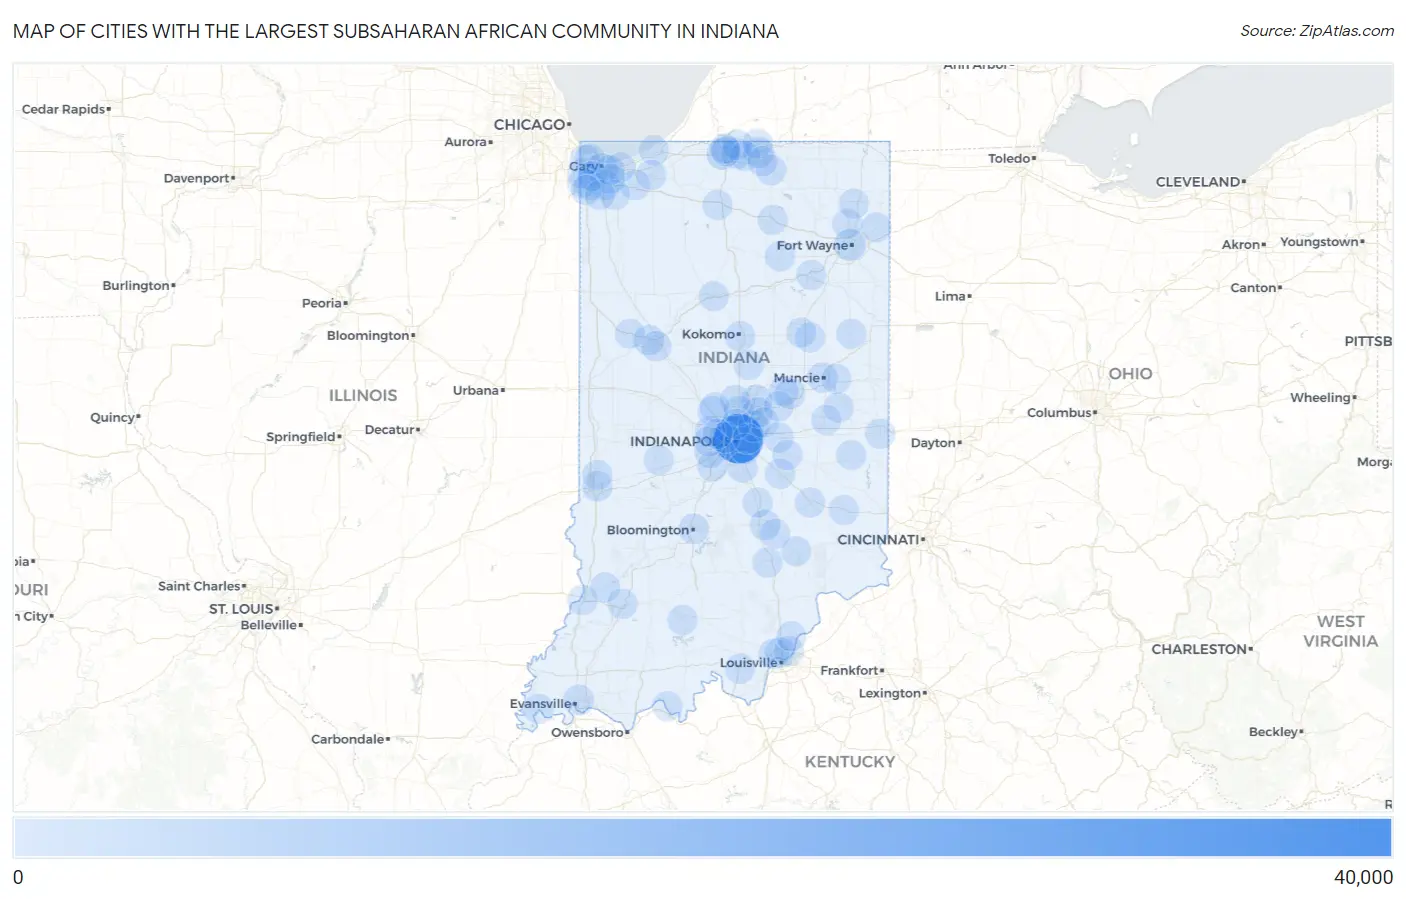
Map of Cities with the Largest Subsaharan African Community in Indiana
0
40,000
Cities with the Largest Subsaharan African Community in Indiana
| City | Subsaharan African | vs State | vs National | |
| 1. | Indianapolis | 37,322 | 71,723(52.04%)#1 | 4,023,199(0.93%)#7 |
| 2. | Fort Wayne | 3,149 | 71,723(4.39%)#2 | 4,023,199(0.08%)#175 |
| 3. | South Bend | 3,027 | 71,723(4.22%)#3 | 4,023,199(0.08%)#184 |
| 4. | Lawrence | 1,902 | 71,723(2.65%)#4 | 4,023,199(0.05%)#319 |
| 5. | Speedway | 1,383 | 71,723(1.93%)#5 | 4,023,199(0.03%)#448 |
| 6. | Noblesville | 1,368 | 71,723(1.91%)#6 | 4,023,199(0.03%)#455 |
| 7. | Gary | 1,055 | 71,723(1.47%)#7 | 4,023,199(0.03%)#565 |
| 8. | Plainfield | 1,002 | 71,723(1.40%)#8 | 4,023,199(0.02%)#591 |
| 9. | Brownsburg | 886 | 71,723(1.24%)#9 | 4,023,199(0.02%)#649 |
| 10. | Mishawaka | 858 | 71,723(1.20%)#10 | 4,023,199(0.02%)#666 |
| 11. | West Lafayette | 832 | 71,723(1.16%)#11 | 4,023,199(0.02%)#685 |
| 12. | Elkhart | 803 | 71,723(1.12%)#12 | 4,023,199(0.02%)#714 |
| 13. | Carmel | 783 | 71,723(1.09%)#13 | 4,023,199(0.02%)#736 |
| 14. | Evansville | 722 | 71,723(1.01%)#14 | 4,023,199(0.02%)#789 |
| 15. | Goshen | 582 | 71,723(0.81%)#15 | 4,023,199(0.01%)#964 |
| 16. | Kokomo | 574 | 71,723(0.80%)#16 | 4,023,199(0.01%)#978 |
| 17. | Bloomington | 556 | 71,723(0.78%)#17 | 4,023,199(0.01%)#1,001 |
| 18. | Lafayette | 556 | 71,723(0.78%)#18 | 4,023,199(0.01%)#1,002 |
| 19. | Granger | 548 | 71,723(0.76%)#19 | 4,023,199(0.01%)#1,012 |
| 20. | Hammond | 510 | 71,723(0.71%)#20 | 4,023,199(0.01%)#1,072 |
| 21. | Anderson | 492 | 71,723(0.69%)#21 | 4,023,199(0.01%)#1,097 |
| 22. | Fishers | 458 | 71,723(0.64%)#22 | 4,023,199(0.01%)#1,167 |
| 23. | Avon | 414 | 71,723(0.58%)#23 | 4,023,199(0.01%)#1,266 |
| 24. | Terre Haute | 380 | 71,723(0.53%)#24 | 4,023,199(0.01%)#1,355 |
| 25. | Muncie | 360 | 71,723(0.50%)#25 | 4,023,199(0.01%)#1,394 |
| 26. | New Albany | 356 | 71,723(0.50%)#26 | 4,023,199(0.01%)#1,407 |
| 27. | Columbus | 340 | 71,723(0.47%)#27 | 4,023,199(0.01%)#1,449 |
| 28. | Greenwood | 334 | 71,723(0.47%)#28 | 4,023,199(0.01%)#1,471 |
| 29. | Huntertown | 320 | 71,723(0.45%)#29 | 4,023,199(0.01%)#1,522 |
| 30. | Shelbyville | 280 | 71,723(0.39%)#30 | 4,023,199(0.01%)#1,646 |
| 31. | Merrillville | 266 | 71,723(0.37%)#31 | 4,023,199(0.01%)#1,706 |
| 32. | Clarksville | 232 | 71,723(0.32%)#32 | 4,023,199(0.01%)#1,861 |
| 33. | Munster | 226 | 71,723(0.32%)#33 | 4,023,199(0.01%)#1,896 |
| 34. | Greenfield | 224 | 71,723(0.31%)#34 | 4,023,199(0.01%)#1,907 |
| 35. | Jeffersonville | 223 | 71,723(0.31%)#35 | 4,023,199(0.01%)#1,912 |
| 36. | Valparaiso | 219 | 71,723(0.31%)#36 | 4,023,199(0.01%)#1,939 |
| 37. | Richmond | 196 | 71,723(0.27%)#37 | 4,023,199(0.00%)#2,075 |
| 38. | Portage | 194 | 71,723(0.27%)#38 | 4,023,199(0.00%)#2,092 |
| 39. | Hobart | 186 | 71,723(0.26%)#39 | 4,023,199(0.00%)#2,152 |
| 40. | Westfield | 129 | 71,723(0.18%)#40 | 4,023,199(0.00%)#2,687 |
| 41. | Schererville | 121 | 71,723(0.17%)#41 | 4,023,199(0.00%)#2,784 |
| 42. | Whitestown | 117 | 71,723(0.16%)#42 | 4,023,199(0.00%)#2,825 |
| 43. | Michigan City | 110 | 71,723(0.15%)#43 | 4,023,199(0.00%)#2,901 |
| 44. | Beech Grove | 99 | 71,723(0.14%)#44 | 4,023,199(0.00%)#3,074 |
| 45. | Washington | 99 | 71,723(0.14%)#45 | 4,023,199(0.00%)#3,077 |
| 46. | Vincennes | 98 | 71,723(0.14%)#46 | 4,023,199(0.00%)#3,099 |
| 47. | Putnamville | 96 | 71,723(0.13%)#47 | 4,023,199(0.00%)#3,156 |
| 48. | East Chicago | 90 | 71,723(0.13%)#48 | 4,023,199(0.00%)#3,247 |
| 49. | Zionsville | 89 | 71,723(0.12%)#49 | 4,023,199(0.00%)#3,265 |
| 50. | Connersville | 84 | 71,723(0.12%)#50 | 4,023,199(0.00%)#3,366 |
| 51. | Warsaw | 81 | 71,723(0.11%)#51 | 4,023,199(0.00%)#3,428 |
| 52. | Seymour | 76 | 71,723(0.11%)#52 | 4,023,199(0.00%)#3,533 |
| 53. | Upland | 74 | 71,723(0.10%)#53 | 4,023,199(0.00%)#3,594 |
| 54. | Lakes Of The Four Seasons | 71 | 71,723(0.10%)#54 | 4,023,199(0.00%)#3,653 |
| 55. | Logansport | 69 | 71,723(0.10%)#55 | 4,023,199(0.00%)#3,694 |
| 56. | Dyer | 63 | 71,723(0.09%)#56 | 4,023,199(0.00%)#3,852 |
| 57. | Tipton | 63 | 71,723(0.09%)#57 | 4,023,199(0.00%)#3,863 |
| 58. | Charlestown | 62 | 71,723(0.09%)#58 | 4,023,199(0.00%)#3,900 |
| 59. | Greencastle | 61 | 71,723(0.09%)#59 | 4,023,199(0.00%)#3,931 |
| 60. | Griffith | 56 | 71,723(0.08%)#60 | 4,023,199(0.00%)#4,074 |
| 61. | Huntington | 48 | 71,723(0.07%)#61 | 4,023,199(0.00%)#4,332 |
| 62. | Tell City | 36 | 71,723(0.05%)#62 | 4,023,199(0.00%)#4,876 |
| 63. | St John | 35 | 71,723(0.05%)#63 | 4,023,199(0.00%)#4,918 |
| 64. | Corydon | 33 | 71,723(0.05%)#64 | 4,023,199(0.00%)#5,043 |
| 65. | Osceola | 31 | 71,723(0.04%)#65 | 4,023,199(0.00%)#5,142 |
| 66. | Mccordsville | 26 | 71,723(0.04%)#66 | 4,023,199(0.00%)#5,408 |
| 67. | North Manchester | 26 | 71,723(0.04%)#67 | 4,023,199(0.00%)#5,429 |
| 68. | Selma | 26 | 71,723(0.04%)#68 | 4,023,199(0.00%)#5,464 |
| 69. | Pendleton | 24 | 71,723(0.03%)#69 | 4,023,199(0.00%)#5,570 |
| 70. | Simonton Lake | 24 | 71,723(0.03%)#70 | 4,023,199(0.00%)#5,571 |
| 71. | French Lick | 24 | 71,723(0.03%)#71 | 4,023,199(0.00%)#5,600 |
| 72. | Ardmore | 24 | 71,723(0.03%)#72 | 4,023,199(0.00%)#5,601 |
| 73. | Pennville | 24 | 71,723(0.03%)#73 | 4,023,199(0.00%)#5,607 |
| 74. | Greensburg | 23 | 71,723(0.03%)#74 | 4,023,199(0.00%)#5,627 |
| 75. | North Terre Haute | 23 | 71,723(0.03%)#75 | 4,023,199(0.00%)#5,649 |
| 76. | Plymouth | 22 | 71,723(0.03%)#76 | 4,023,199(0.00%)#5,706 |
| 77. | Dunlap | 22 | 71,723(0.03%)#77 | 4,023,199(0.00%)#5,718 |
| 78. | Elizabethtown | 22 | 71,723(0.03%)#78 | 4,023,199(0.00%)#5,771 |
| 79. | Bicknell | 20 | 71,723(0.03%)#79 | 4,023,199(0.00%)#5,909 |
| 80. | Garrett | 19 | 71,723(0.03%)#80 | 4,023,199(0.00%)#5,967 |
| 81. | Edgewood | 19 | 71,723(0.03%)#81 | 4,023,199(0.00%)#5,996 |
| 82. | Otterbein | 19 | 71,723(0.03%)#82 | 4,023,199(0.00%)#6,005 |
| 83. | Batesville | 18 | 71,723(0.03%)#83 | 4,023,199(0.00%)#6,064 |
| 84. | Crown Point | 16 | 71,723(0.02%)#84 | 4,023,199(0.00%)#6,243 |
| 85. | Mooresville | 16 | 71,723(0.02%)#85 | 4,023,199(0.00%)#6,259 |
| 86. | North Vernon | 16 | 71,723(0.02%)#86 | 4,023,199(0.00%)#6,271 |
| 87. | Gas City | 16 | 71,723(0.02%)#87 | 4,023,199(0.00%)#6,275 |
| 88. | Westville | 16 | 71,723(0.02%)#88 | 4,023,199(0.00%)#6,276 |
| 89. | Clermont | 16 | 71,723(0.02%)#89 | 4,023,199(0.00%)#6,321 |
| 90. | Lake Station | 15 | 71,723(0.02%)#90 | 4,023,199(0.00%)#6,360 |
| 91. | Harlan | 15 | 71,723(0.02%)#91 | 4,023,199(0.00%)#6,450 |
| 92. | Mooreland | 15 | 71,723(0.02%)#92 | 4,023,199(0.00%)#6,476 |
| 93. | New Castle | 14 | 71,723(0.02%)#93 | 4,023,199(0.00%)#6,492 |
| 94. | Notre Dame | 14 | 71,723(0.02%)#94 | 4,023,199(0.00%)#6,518 |
| 95. | Warren Park | 14 | 71,723(0.02%)#95 | 4,023,199(0.00%)#6,574 |
| 96. | Morristown | 14 | 71,723(0.02%)#96 | 4,023,199(0.00%)#6,582 |
| 97. | Edinburgh | 13 | 71,723(0.02%)#97 | 4,023,199(0.00%)#6,642 |
| 98. | Meridian Hills | 12 | 71,723(0.02%)#98 | 4,023,199(0.00%)#6,818 |
| 99. | Roseland | 12 | 71,723(0.02%)#99 | 4,023,199(0.00%)#6,847 |
| 100. | Mount Vernon | 11 | 71,723(0.02%)#100 | 4,023,199(0.00%)#6,919 |
Common Questions
What are the Top 10 Cities with the Largest Subsaharan African Community in Indiana?
Top 10 Cities with the Largest Subsaharan African Community in Indiana are:
#1
37,322
#2
3,149
#3
3,027
#4
1,902
#5
1,383
#6
1,368
#7
1,055
#8
1,002
#9
886
#10
858
What city has the Largest Subsaharan African Community in Indiana?
Indianapolis has the Largest Subsaharan African Community in Indiana with 37,322.
What is the Total Subsaharan African Population in the State of Indiana?
Total Subsaharan African Population in Indiana is 71,723.
What is the Total Subsaharan African Population in the United States?
Total Subsaharan African Population in the United States is 4,023,199.