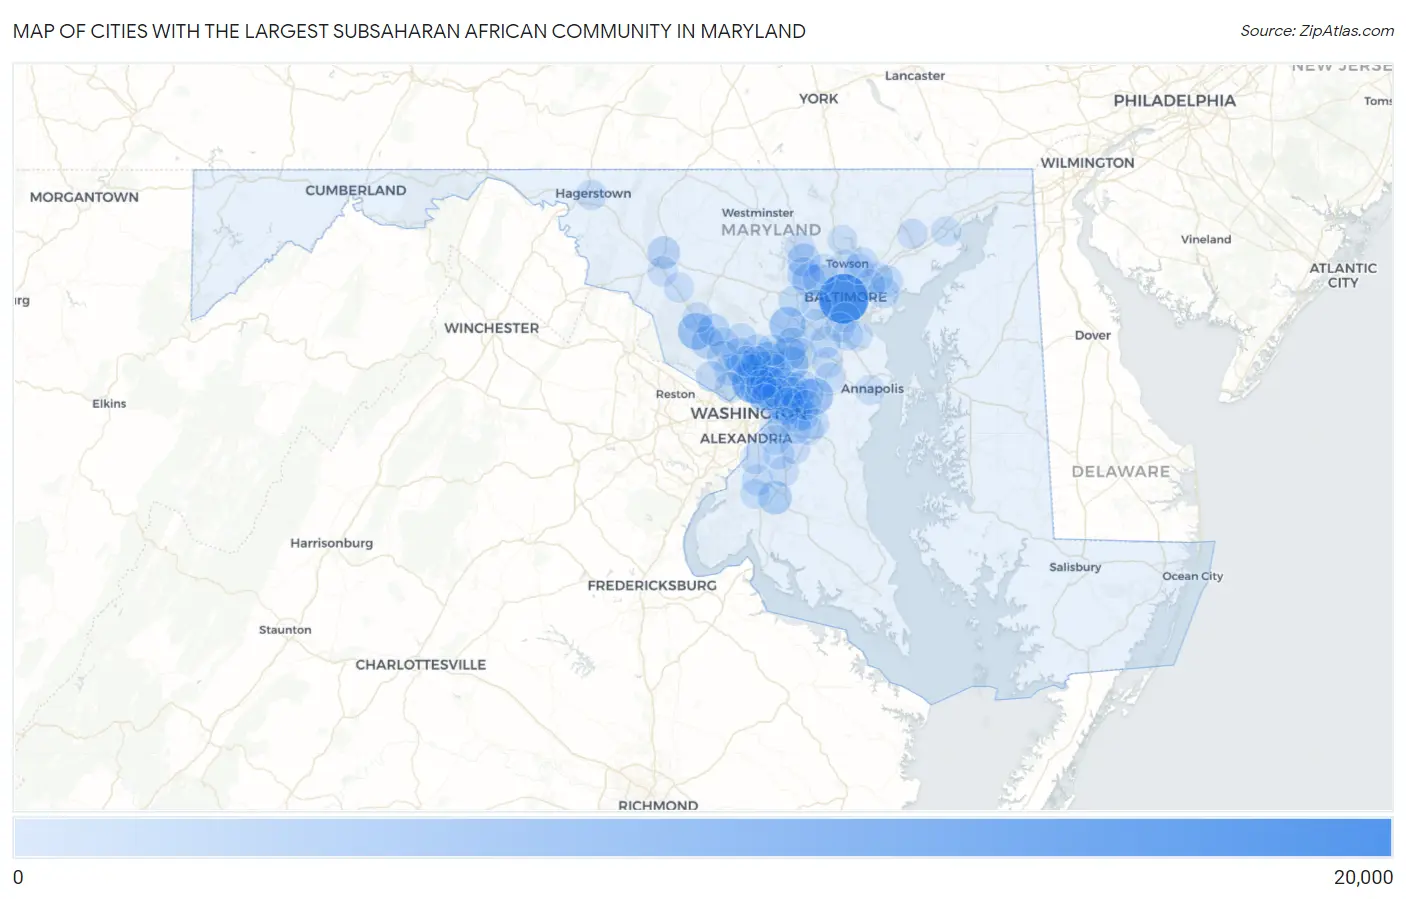
Cities with the Largest Subsaharan African Community in Maryland
RELATED REPORTS & OPTIONS
Subsaharan African
Maryland
Compare Cities
Map of Cities with the Largest Subsaharan African Community in Maryland
0
20,000
Cities with the Largest Subsaharan African Community in Maryland
| City | Subsaharan African | vs State | vs National | |
| 1. | Baltimore | 19,212 | 258,856(7.42%)#1 | 4,023,199(0.48%)#21 |
| 2. | Silver Spring | 10,750 | 258,856(4.15%)#2 | 4,023,199(0.27%)#38 |
| 3. | Germantown | 6,662 | 258,856(2.57%)#3 | 4,023,199(0.17%)#69 |
| 4. | Bowie | 6,356 | 258,856(2.46%)#4 | 4,023,199(0.16%)#74 |
| 5. | Columbia | 6,302 | 258,856(2.43%)#5 | 4,023,199(0.16%)#75 |
| 6. | Fairland | 5,394 | 258,856(2.08%)#6 | 4,023,199(0.13%)#89 |
| 7. | Chillum | 4,973 | 258,856(1.92%)#7 | 4,023,199(0.12%)#97 |
| 8. | White Oak | 4,761 | 258,856(1.84%)#8 | 4,023,199(0.12%)#102 |
| 9. | Wheaton | 4,515 | 258,856(1.74%)#9 | 4,023,199(0.11%)#108 |
| 10. | South Laurel | 4,482 | 258,856(1.73%)#10 | 4,023,199(0.11%)#110 |
| 11. | Waldorf | 3,841 | 258,856(1.48%)#11 | 4,023,199(0.10%)#128 |
| 12. | Aspen Hill | 3,644 | 258,856(1.41%)#12 | 4,023,199(0.09%)#138 |
| 13. | Landover | 3,551 | 258,856(1.37%)#13 | 4,023,199(0.09%)#143 |
| 14. | Laurel | 3,465 | 258,856(1.34%)#14 | 4,023,199(0.09%)#154 |
| 15. | Seabrook | 3,465 | 258,856(1.34%)#15 | 4,023,199(0.09%)#155 |
| 16. | Owings Mills | 3,307 | 258,856(1.28%)#16 | 4,023,199(0.08%)#165 |
| 17. | Gaithersburg | 3,299 | 258,856(1.27%)#17 | 4,023,199(0.08%)#166 |
| 18. | Takoma Park | 3,286 | 258,856(1.27%)#18 | 4,023,199(0.08%)#167 |
| 19. | Milford Mill | 3,285 | 258,856(1.27%)#19 | 4,023,199(0.08%)#168 |
| 20. | Randallstown | 3,280 | 258,856(1.27%)#20 | 4,023,199(0.08%)#169 |
| 21. | New Carrollton | 3,098 | 258,856(1.20%)#21 | 4,023,199(0.08%)#178 |
| 22. | Frederick | 3,012 | 258,856(1.16%)#22 | 4,023,199(0.07%)#185 |
| 23. | North Laurel | 2,879 | 258,856(1.11%)#23 | 4,023,199(0.07%)#198 |
| 24. | Calverton | 2,817 | 258,856(1.09%)#24 | 4,023,199(0.07%)#205 |
| 25. | Adelphi | 2,688 | 258,856(1.04%)#25 | 4,023,199(0.07%)#217 |
| 26. | Greenbelt | 2,680 | 258,856(1.04%)#26 | 4,023,199(0.07%)#218 |
| 27. | Montgomery Village | 2,669 | 258,856(1.03%)#27 | 4,023,199(0.07%)#220 |
| 28. | Lake Arbor | 2,541 | 258,856(0.98%)#28 | 4,023,199(0.06%)#233 |
| 29. | Glenn Dale | 2,495 | 258,856(0.96%)#29 | 4,023,199(0.06%)#235 |
| 30. | Largo | 2,308 | 258,856(0.89%)#30 | 4,023,199(0.06%)#260 |
| 31. | Summerfield | 2,290 | 258,856(0.88%)#31 | 4,023,199(0.06%)#262 |
| 32. | Lochearn | 2,284 | 258,856(0.88%)#32 | 4,023,199(0.06%)#263 |
| 33. | Bladensburg | 2,072 | 258,856(0.80%)#33 | 4,023,199(0.05%)#290 |
| 34. | Severn | 2,041 | 258,856(0.79%)#34 | 4,023,199(0.05%)#295 |
| 35. | North Bethesda | 2,001 | 258,856(0.77%)#35 | 4,023,199(0.05%)#303 |
| 36. | Beltsville | 1,914 | 258,856(0.74%)#36 | 4,023,199(0.05%)#315 |
| 37. | Elkridge | 1,852 | 258,856(0.72%)#37 | 4,023,199(0.05%)#326 |
| 38. | Mitchellville | 1,794 | 258,856(0.69%)#38 | 4,023,199(0.04%)#342 |
| 39. | Burtonsville | 1,783 | 258,856(0.69%)#39 | 4,023,199(0.04%)#344 |
| 40. | Essex | 1,773 | 258,856(0.68%)#40 | 4,023,199(0.04%)#346 |
| 41. | Middle River | 1,738 | 258,856(0.67%)#41 | 4,023,199(0.04%)#351 |
| 42. | Cloverly | 1,733 | 258,856(0.67%)#42 | 4,023,199(0.04%)#353 |
| 43. | Woodlawn Cdp Baltimore County | 1,682 | 258,856(0.65%)#43 | 4,023,199(0.04%)#363 |
| 44. | Rossville | 1,637 | 258,856(0.63%)#44 | 4,023,199(0.04%)#372 |
| 45. | Kemp Mill | 1,594 | 258,856(0.62%)#45 | 4,023,199(0.04%)#382 |
| 46. | Maryland City | 1,572 | 258,856(0.61%)#46 | 4,023,199(0.04%)#388 |
| 47. | Accokeek | 1,535 | 258,856(0.59%)#47 | 4,023,199(0.04%)#399 |
| 48. | Bethesda | 1,497 | 258,856(0.58%)#48 | 4,023,199(0.04%)#407 |
| 49. | Brock Hall | 1,494 | 258,856(0.58%)#49 | 4,023,199(0.04%)#409 |
| 50. | Rockville | 1,485 | 258,856(0.57%)#50 | 4,023,199(0.04%)#413 |
| 51. | Olney | 1,477 | 258,856(0.57%)#51 | 4,023,199(0.04%)#416 |
| 52. | Towson | 1,470 | 258,856(0.57%)#52 | 4,023,199(0.04%)#419 |
| 53. | Kettering | 1,440 | 258,856(0.56%)#53 | 4,023,199(0.04%)#433 |
| 54. | College Park | 1,405 | 258,856(0.54%)#54 | 4,023,199(0.03%)#442 |
| 55. | Glen Burnie | 1,381 | 258,856(0.53%)#55 | 4,023,199(0.03%)#449 |
| 56. | Ellicott City | 1,355 | 258,856(0.52%)#56 | 4,023,199(0.03%)#459 |
| 57. | Suitland | 1,343 | 258,856(0.52%)#57 | 4,023,199(0.03%)#465 |
| 58. | Clinton | 1,337 | 258,856(0.52%)#58 | 4,023,199(0.03%)#466 |
| 59. | Odenton | 1,330 | 258,856(0.51%)#59 | 4,023,199(0.03%)#468 |
| 60. | Rosedale | 1,330 | 258,856(0.51%)#60 | 4,023,199(0.03%)#469 |
| 61. | Hyattsville | 1,277 | 258,856(0.49%)#61 | 4,023,199(0.03%)#481 |
| 62. | Glenmont | 1,233 | 258,856(0.48%)#62 | 4,023,199(0.03%)#489 |
| 63. | Catonsville | 1,186 | 258,856(0.46%)#63 | 4,023,199(0.03%)#504 |
| 64. | Carney | 1,175 | 258,856(0.45%)#64 | 4,023,199(0.03%)#508 |
| 65. | Fort Washington | 1,168 | 258,856(0.45%)#65 | 4,023,199(0.03%)#512 |
| 66. | Hagerstown | 1,104 | 258,856(0.43%)#66 | 4,023,199(0.03%)#537 |
| 67. | Potomac | 1,074 | 258,856(0.41%)#67 | 4,023,199(0.03%)#554 |
| 68. | Lanham | 1,069 | 258,856(0.41%)#68 | 4,023,199(0.03%)#558 |
| 69. | East Riverdale | 1,064 | 258,856(0.41%)#69 | 4,023,199(0.03%)#560 |
| 70. | Parkville | 1,048 | 258,856(0.40%)#70 | 4,023,199(0.03%)#569 |
| 71. | Ballenger Creek | 1,001 | 258,856(0.39%)#71 | 4,023,199(0.02%)#592 |
| 72. | Langley Park | 994 | 258,856(0.38%)#72 | 4,023,199(0.02%)#597 |
| 73. | Bel Air South | 969 | 258,856(0.37%)#73 | 4,023,199(0.02%)#609 |
| 74. | Clarksburg | 968 | 258,856(0.37%)#74 | 4,023,199(0.02%)#610 |
| 75. | Rosaryville | 961 | 258,856(0.37%)#75 | 4,023,199(0.02%)#611 |
| 76. | Brandywine | 956 | 258,856(0.37%)#76 | 4,023,199(0.02%)#615 |
| 77. | Marlboro Village | 935 | 258,856(0.36%)#77 | 4,023,199(0.02%)#631 |
| 78. | Westphalia | 850 | 258,856(0.33%)#78 | 4,023,199(0.02%)#674 |
| 79. | Fairwood | 822 | 258,856(0.32%)#79 | 4,023,199(0.02%)#697 |
| 80. | Crofton | 821 | 258,856(0.32%)#80 | 4,023,199(0.02%)#698 |
| 81. | Colesville | 794 | 258,856(0.31%)#81 | 4,023,199(0.02%)#724 |
| 82. | Reisterstown | 769 | 258,856(0.30%)#82 | 4,023,199(0.02%)#745 |
| 83. | Urbana | 739 | 258,856(0.29%)#83 | 4,023,199(0.02%)#773 |
| 84. | Redland | 716 | 258,856(0.28%)#84 | 4,023,199(0.02%)#795 |
| 85. | Woodlawn Cdp Prince George S County | 704 | 258,856(0.27%)#85 | 4,023,199(0.02%)#813 |
| 86. | Ferndale | 684 | 258,856(0.26%)#86 | 4,023,199(0.02%)#827 |
| 87. | Woodmore | 676 | 258,856(0.26%)#87 | 4,023,199(0.02%)#836 |
| 88. | Glenarden | 662 | 258,856(0.26%)#88 | 4,023,199(0.02%)#856 |
| 89. | Brooklyn Park | 661 | 258,856(0.26%)#89 | 4,023,199(0.02%)#857 |
| 90. | Annapolis | 645 | 258,856(0.25%)#90 | 4,023,199(0.02%)#880 |
| 91. | District Heights | 633 | 258,856(0.24%)#91 | 4,023,199(0.02%)#897 |
| 92. | Bensville | 624 | 258,856(0.24%)#92 | 4,023,199(0.02%)#906 |
| 93. | Honeygo | 618 | 258,856(0.24%)#93 | 4,023,199(0.02%)#919 |
| 94. | Aberdeen | 615 | 258,856(0.24%)#94 | 4,023,199(0.02%)#925 |
| 95. | Mount Rainier | 602 | 258,856(0.23%)#95 | 4,023,199(0.01%)#937 |
| 96. | Green Valley | 588 | 258,856(0.23%)#96 | 4,023,199(0.01%)#956 |
| 97. | Pikesville | 584 | 258,856(0.23%)#97 | 4,023,199(0.01%)#959 |
| 98. | Camp Springs | 583 | 258,856(0.23%)#98 | 4,023,199(0.01%)#961 |
| 99. | Pasadena | 577 | 258,856(0.22%)#99 | 4,023,199(0.01%)#972 |
| 100. | Cockeysville | 577 | 258,856(0.22%)#100 | 4,023,199(0.01%)#973 |
Common Questions
What are the Top 10 Cities with the Largest Subsaharan African Community in Maryland?
Top 10 Cities with the Largest Subsaharan African Community in Maryland are:
#1
19,212
#2
10,750
#3
6,662
#4
6,356
#5
6,302
#6
5,394
#7
4,973
#8
4,761
#9
4,515
#10
4,482
What city has the Largest Subsaharan African Community in Maryland?
Baltimore has the Largest Subsaharan African Community in Maryland with 19,212.
What is the Total Subsaharan African Population in the State of Maryland?
Total Subsaharan African Population in Maryland is 258,856.
What is the Total Subsaharan African Population in the United States?
Total Subsaharan African Population in the United States is 4,023,199.