Zip Codes with the Highest Percentage of Population with a Degree in Liberal Arts and History in Lowell, MA
RELATED REPORTS & OPTIONS
Liberal Arts and History
Lowell
Compare Zip Codes
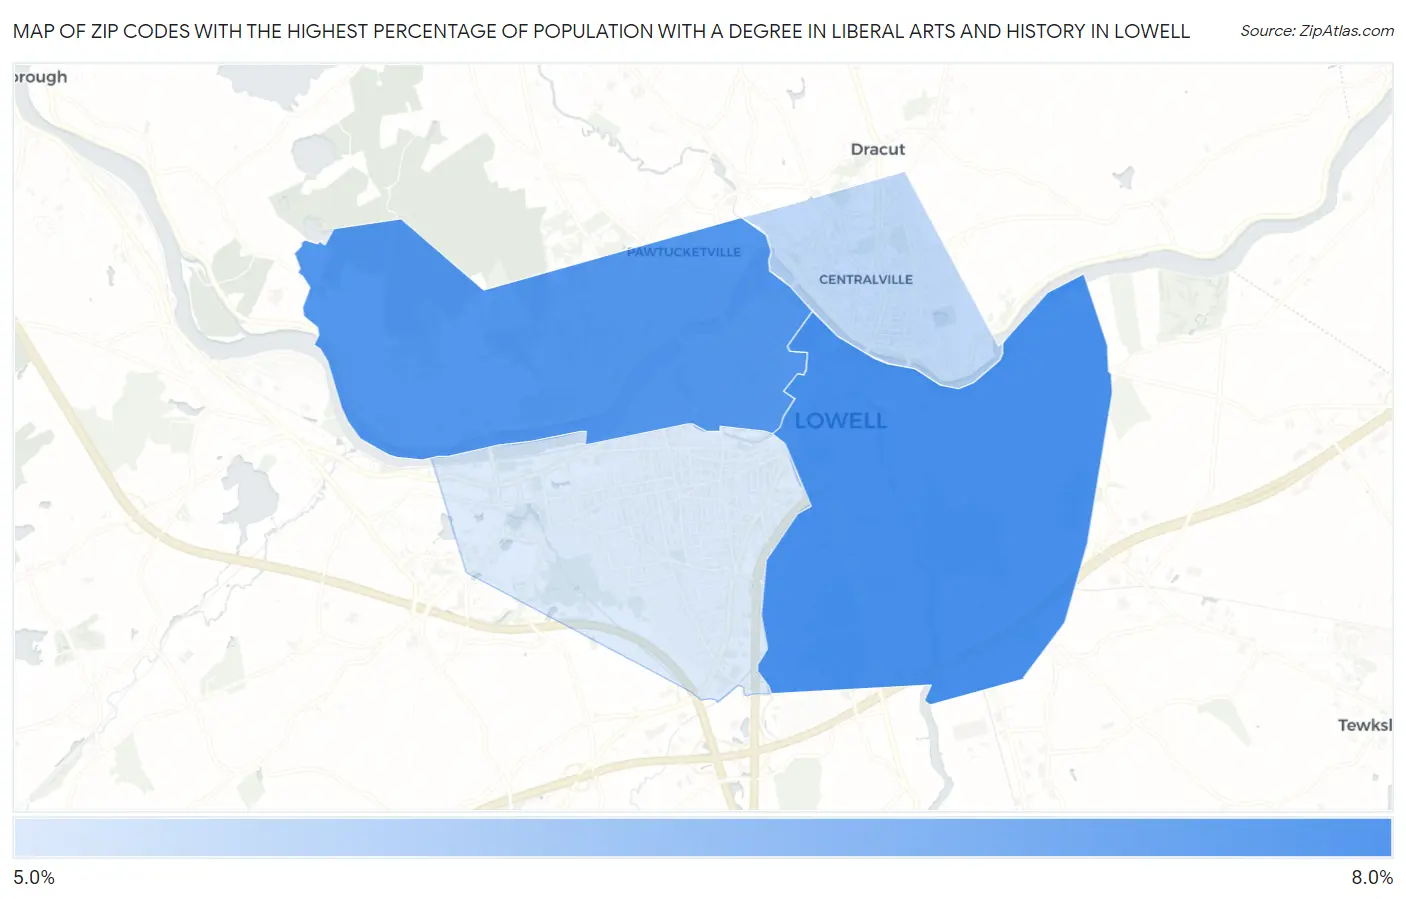
Map of Zip Codes with the Highest Percentage of Population with a Degree in Liberal Arts and History in Lowell
5.1%
7.8%
Zip Codes with the Highest Percentage of Population with a Degree in Liberal Arts and History in Lowell, MA
| Zip Code | % Graduates | vs State | vs National | |
| 1. | 01852 | 7.8% | 5.5%(+2.34)#111 | 4.9%(+2.95)#5,136 |
| 2. | 01854 | 7.6% | 5.5%(+2.15)#120 | 4.9%(+2.76)#5,396 |
| 3. | 01850 | 5.6% | 5.5%(+0.157)#222 | 4.9%(+0.766)#9,464 |
| 4. | 01851 | 5.1% | 5.5%(-0.380)#264 | 4.9%(+0.228)#11,038 |
1
Common Questions
What are the Top 3 Zip Codes with the Highest Percentage of Population with a Degree in Liberal Arts and History in Lowell, MA?
Top 3 Zip Codes with the Highest Percentage of Population with a Degree in Liberal Arts and History in Lowell, MA are:
What zip code has the Highest Percentage of Population with a Degree in Liberal Arts and History in Lowell, MA?
01852 has the Highest Percentage of Population with a Degree in Liberal Arts and History in Lowell, MA with 7.8%.
What is the Percentage of Population with a Degree in Liberal Arts and History in Lowell, MA?
Percentage of Population with a Degree in Liberal Arts and History in Lowell is 6.8%.
What is the Percentage of Population with a Degree in Liberal Arts and History in Massachusetts?
Percentage of Population with a Degree in Liberal Arts and History in Massachusetts is 5.5%.
What is the Percentage of Population with a Degree in Liberal Arts and History in the United States?
Percentage of Population with a Degree in Liberal Arts and History in the United States is 4.9%.