Zip Codes with the Highest Percentage of Population with a Degree in Liberal Arts and History in Massachusetts
RELATED REPORTS & OPTIONS
Liberal Arts and History
Massachusetts
Compare Zip Codes
Map of Zip Codes with the Highest Percentage of Population with a Degree in Liberal Arts and History in Massachusetts
0.0%
100.0%
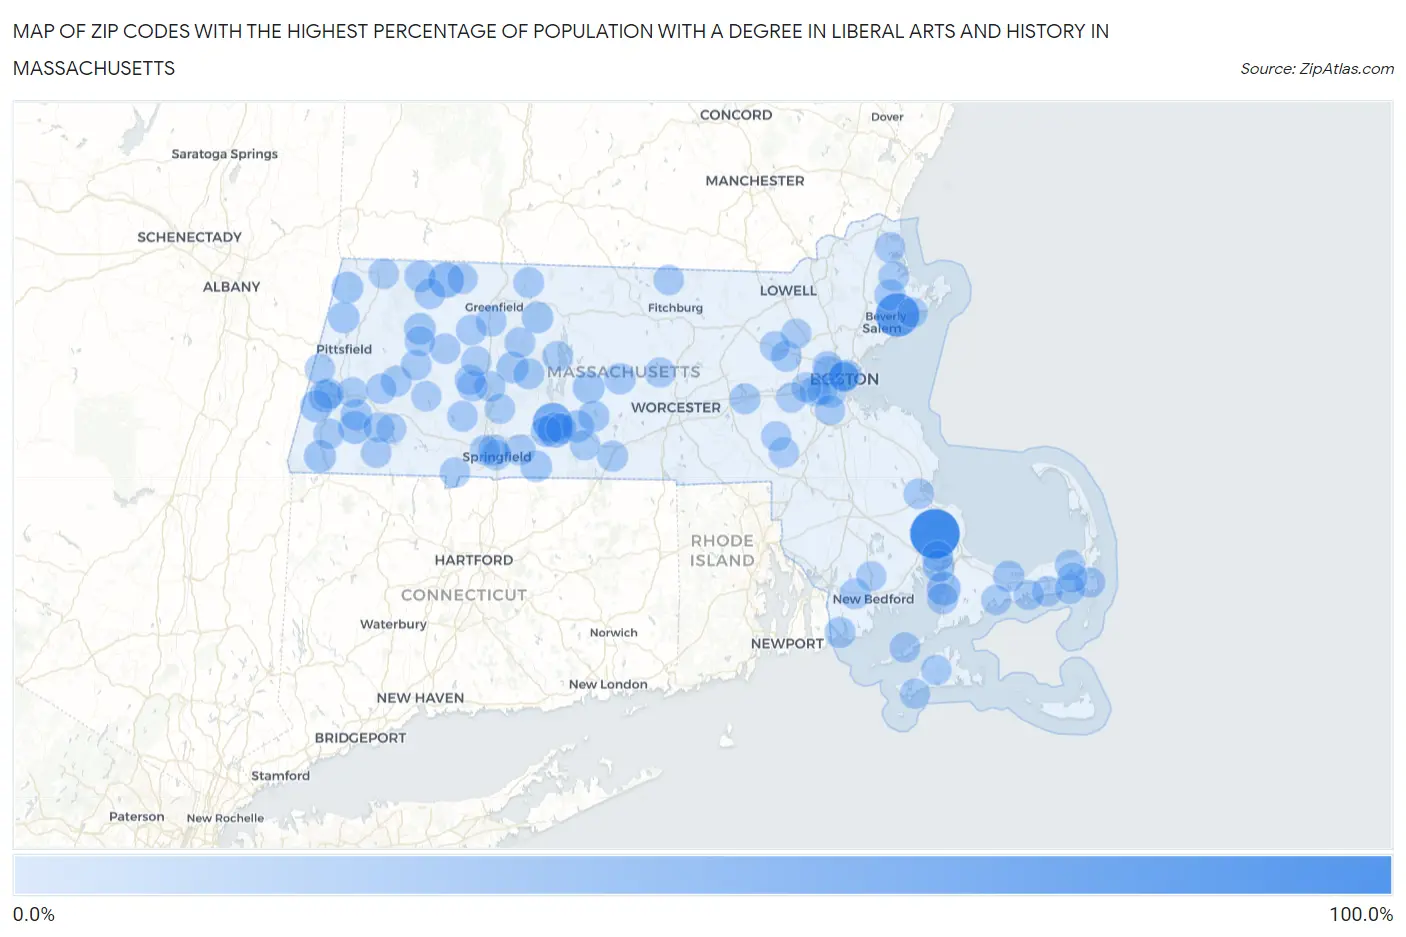
Zip Codes with the Highest Percentage of Population with a Degree in Liberal Arts and History in Massachusetts
| Zip Code | % Graduates | vs State | vs National | |
| 1. | 02366 | 100.0% | 5.5%(+94.5)#1 | 4.9%(+95.1)#28 |
| 2. | 01965 | 70.9% | 5.5%(+65.4)#2 | 4.9%(+66.0)#80 |
| 3. | 01009 | 50.5% | 5.5%(+45.1)#3 | 4.9%(+45.7)#141 |
| 4. | 01346 | 32.1% | 5.5%(+26.6)#4 | 4.9%(+27.2)#376 |
| 5. | 01079 | 31.9% | 5.5%(+26.4)#5 | 4.9%(+27.0)#383 |
| 6. | 02534 | 24.6% | 5.5%(+19.1)#6 | 4.9%(+19.7)#605 |
| 7. | 01245 | 20.6% | 5.5%(+15.2)#7 | 4.9%(+15.8)#821 |
| 8. | 01229 | 18.2% | 5.5%(+12.7)#8 | 4.9%(+13.3)#1,017 |
| 9. | 01092 | 17.4% | 5.5%(+11.9)#9 | 4.9%(+12.5)#1,094 |
| 10. | 01257 | 16.8% | 5.5%(+11.4)#10 | 4.9%(+12.0)#1,146 |
| 11. | 01236 | 16.2% | 5.5%(+10.7)#11 | 4.9%(+11.3)#1,229 |
| 12. | 01031 | 15.9% | 5.5%(+10.4)#12 | 4.9%(+11.1)#1,271 |
| 13. | 02558 | 15.5% | 5.5%(+9.99)#13 | 4.9%(+10.6)#1,331 |
| 14. | 01267 | 14.6% | 5.5%(+9.16)#14 | 4.9%(+9.77)#1,489 |
| 15. | 01003 | 14.6% | 5.5%(+9.15)#15 | 4.9%(+9.76)#1,491 |
| 16. | 01070 | 14.6% | 5.5%(+9.11)#16 | 4.9%(+9.72)#1,501 |
| 17. | 01379 | 14.6% | 5.5%(+9.09)#17 | 4.9%(+9.69)#1,509 |
| 18. | 01036 | 14.3% | 5.5%(+8.84)#18 | 4.9%(+9.45)#1,552 |
| 19. | 01585 | 14.1% | 5.5%(+8.62)#19 | 4.9%(+9.22)#1,615 |
| 20. | 01237 | 13.6% | 5.5%(+8.16)#20 | 4.9%(+8.76)#1,724 |
| 21. | 01264 | 13.5% | 5.5%(+7.98)#21 | 4.9%(+8.59)#1,780 |
| 22. | 02668 | 13.4% | 5.5%(+7.95)#22 | 4.9%(+8.56)#1,795 |
| 23. | 01367 | 13.3% | 5.5%(+7.79)#23 | 4.9%(+8.40)#1,834 |
| 24. | 01068 | 13.2% | 5.5%(+7.67)#24 | 4.9%(+8.28)#1,861 |
| 25. | 01982 | 12.4% | 5.5%(+6.93)#25 | 4.9%(+7.54)#2,077 |
| 26. | 02791 | 11.8% | 5.5%(+6.30)#26 | 4.9%(+6.91)#2,266 |
| 27. | 01080 | 11.8% | 5.5%(+6.28)#27 | 4.9%(+6.89)#2,269 |
| 28. | 01129 | 11.6% | 5.5%(+6.14)#28 | 4.9%(+6.75)#2,326 |
| 29. | 01566 | 11.6% | 5.5%(+6.08)#29 | 4.9%(+6.69)#2,343 |
| 30. | 02538 | 11.4% | 5.5%(+5.91)#30 | 4.9%(+6.52)#2,404 |
| 31. | 01002 | 11.4% | 5.5%(+5.88)#31 | 4.9%(+6.49)#2,422 |
| 32. | 01107 | 11.2% | 5.5%(+5.68)#32 | 4.9%(+6.29)#2,487 |
| 33. | 01243 | 11.1% | 5.5%(+5.63)#33 | 4.9%(+6.24)#2,523 |
| 34. | 02113 | 11.1% | 5.5%(+5.60)#34 | 4.9%(+6.21)#2,528 |
| 35. | 01773 | 11.0% | 5.5%(+5.56)#35 | 4.9%(+6.17)#2,542 |
| 36. | 01745 | 10.9% | 5.5%(+5.47)#36 | 4.9%(+6.08)#2,588 |
| 37. | 02556 | 10.5% | 5.5%(+5.07)#37 | 4.9%(+5.68)#2,793 |
| 38. | 01073 | 10.5% | 5.5%(+5.06)#38 | 4.9%(+5.67)#2,796 |
| 39. | 02747 | 10.5% | 5.5%(+5.05)#39 | 4.9%(+5.66)#2,798 |
| 40. | 01339 | 10.4% | 5.5%(+4.92)#40 | 4.9%(+5.53)#2,865 |
| 41. | 01360 | 10.3% | 5.5%(+4.85)#41 | 4.9%(+5.46)#2,904 |
| 42. | 01342 | 10.3% | 5.5%(+4.78)#42 | 4.9%(+5.38)#2,962 |
| 43. | 01230 | 10.2% | 5.5%(+4.74)#43 | 4.9%(+5.35)#2,986 |
| 44. | 01060 | 10.2% | 5.5%(+4.73)#44 | 4.9%(+5.34)#2,989 |
| 45. | 01032 | 10.1% | 5.5%(+4.63)#45 | 4.9%(+5.23)#3,056 |
| 46. | 01062 | 10.1% | 5.5%(+4.62)#46 | 4.9%(+5.23)#3,057 |
| 47. | 01103 | 10.1% | 5.5%(+4.58)#47 | 4.9%(+5.19)#3,073 |
| 48. | 02543 | 10.0% | 5.5%(+4.53)#48 | 4.9%(+5.14)#3,095 |
| 49. | 01054 | 10.0% | 5.5%(+4.48)#49 | 4.9%(+5.09)#3,138 |
| 50. | 01098 | 9.9% | 5.5%(+4.44)#50 | 4.9%(+5.05)#3,150 |
| 51. | 01069 | 9.8% | 5.5%(+4.32)#51 | 4.9%(+4.93)#3,235 |
| 52. | 01255 | 9.8% | 5.5%(+4.30)#52 | 4.9%(+4.91)#3,248 |
| 53. | 02364 | 9.6% | 5.5%(+4.10)#53 | 4.9%(+4.71)#3,385 |
| 54. | 01341 | 9.6% | 5.5%(+4.09)#54 | 4.9%(+4.70)#3,395 |
| 55. | 01238 | 9.5% | 5.5%(+3.99)#55 | 4.9%(+4.60)#3,481 |
| 56. | 01340 | 9.5% | 5.5%(+3.97)#56 | 4.9%(+4.58)#3,495 |
| 57. | 01223 | 9.4% | 5.5%(+3.96)#57 | 4.9%(+4.57)#3,499 |
| 58. | 02138 | 9.4% | 5.5%(+3.94)#58 | 4.9%(+4.55)#3,516 |
| 59. | 02670 | 9.3% | 5.5%(+3.82)#59 | 4.9%(+4.43)#3,597 |
| 60. | 02633 | 9.2% | 5.5%(+3.73)#60 | 4.9%(+4.33)#3,678 |
| 61. | 01938 | 9.2% | 5.5%(+3.67)#61 | 4.9%(+4.28)#3,712 |
| 62. | 01951 | 9.1% | 5.5%(+3.66)#62 | 4.9%(+4.27)#3,719 |
| 63. | 01053 | 9.0% | 5.5%(+3.56)#63 | 4.9%(+4.17)#3,808 |
| 64. | 01431 | 9.0% | 5.5%(+3.51)#64 | 4.9%(+4.12)#3,863 |
| 65. | 01262 | 9.0% | 5.5%(+3.50)#65 | 4.9%(+4.11)#3,880 |
| 66. | 01253 | 9.0% | 5.5%(+3.49)#66 | 4.9%(+4.10)#3,886 |
| 67. | 02631 | 8.9% | 5.5%(+3.42)#67 | 4.9%(+4.03)#3,939 |
| 68. | 02646 | 8.9% | 5.5%(+3.41)#68 | 4.9%(+4.02)#3,945 |
| 69. | 01355 | 8.9% | 5.5%(+3.41)#69 | 4.9%(+4.02)#3,950 |
| 70. | 01247 | 8.9% | 5.5%(+3.40)#70 | 4.9%(+4.01)#3,962 |
| 71. | 02535 | 8.9% | 5.5%(+3.39)#71 | 4.9%(+4.00)#3,964 |
| 72. | 02459 | 8.8% | 5.5%(+3.36)#72 | 4.9%(+3.96)#3,992 |
| 73. | 01039 | 8.8% | 5.5%(+3.32)#73 | 4.9%(+3.93)#4,032 |
| 74. | 02056 | 8.8% | 5.5%(+3.31)#74 | 4.9%(+3.92)#4,037 |
| 75. | 02673 | 8.7% | 5.5%(+3.26)#75 | 4.9%(+3.87)#4,088 |
| 76. | 01077 | 8.7% | 5.5%(+3.26)#76 | 4.9%(+3.86)#4,096 |
| 77. | 01026 | 8.7% | 5.5%(+3.25)#77 | 4.9%(+3.86)#4,098 |
| 78. | 02645 | 8.7% | 5.5%(+3.21)#78 | 4.9%(+3.82)#4,140 |
| 79. | 01075 | 8.6% | 5.5%(+3.17)#79 | 4.9%(+3.77)#4,172 |
| 80. | 02575 | 8.6% | 5.5%(+3.13)#80 | 4.9%(+3.74)#4,220 |
| 81. | 01029 | 8.6% | 5.5%(+3.11)#81 | 4.9%(+3.72)#4,251 |
| 82. | 01050 | 8.6% | 5.5%(+3.10)#82 | 4.9%(+3.71)#4,254 |
| 83. | 02130 | 8.5% | 5.5%(+3.04)#83 | 4.9%(+3.65)#4,316 |
| 84. | 02108 | 8.5% | 5.5%(+3.02)#84 | 4.9%(+3.63)#4,335 |
| 85. | 02655 | 8.5% | 5.5%(+3.00)#85 | 4.9%(+3.61)#4,352 |
| 86. | 02482 | 8.5% | 5.5%(+2.98)#86 | 4.9%(+3.59)#4,371 |
| 87. | 01010 | 8.4% | 5.5%(+2.95)#87 | 4.9%(+3.55)#4,411 |
| 88. | 02467 | 8.4% | 5.5%(+2.91)#88 | 4.9%(+3.52)#4,452 |
| 89. | 02745 | 8.3% | 5.5%(+2.85)#89 | 4.9%(+3.46)#4,501 |
| 90. | 01730 | 8.3% | 5.5%(+2.83)#90 | 4.9%(+3.44)#4,541 |
| 91. | 01742 | 8.2% | 5.5%(+2.73)#91 | 4.9%(+3.34)#4,648 |
| 92. | 01089 | 8.2% | 5.5%(+2.71)#92 | 4.9%(+3.32)#4,677 |
| 93. | 02136 | 8.2% | 5.5%(+2.68)#93 | 4.9%(+3.29)#4,710 |
| 94. | 01944 | 8.1% | 5.5%(+2.66)#94 | 4.9%(+3.27)#4,735 |
| 95. | 02468 | 8.1% | 5.5%(+2.65)#95 | 4.9%(+3.26)#4,750 |
| 96. | 01522 | 8.1% | 5.5%(+2.62)#96 | 4.9%(+3.23)#4,779 |
| 97. | 02054 | 8.1% | 5.5%(+2.60)#97 | 4.9%(+3.21)#4,799 |
| 98. | 02114 | 8.0% | 5.5%(+2.56)#98 | 4.9%(+3.17)#4,846 |
| 99. | 02140 | 8.0% | 5.5%(+2.55)#99 | 4.9%(+3.16)#4,858 |
| 100. | 01254 | 8.0% | 5.5%(+2.55)#100 | 4.9%(+3.16)#4,865 |
Common Questions
What are the Top 10 Zip Codes with the Highest Percentage of Population with a Degree in Liberal Arts and History in Massachusetts?
Top 10 Zip Codes with the Highest Percentage of Population with a Degree in Liberal Arts and History in Massachusetts are:
What zip code has the Highest Percentage of Population with a Degree in Liberal Arts and History in Massachusetts?
02366 has the Highest Percentage of Population with a Degree in Liberal Arts and History in Massachusetts with 100.0%.
What is the Percentage of Population with a Degree in Liberal Arts and History in the State of Massachusetts?
Percentage of Population with a Degree in Liberal Arts and History in Massachusetts is 5.5%.
What is the Percentage of Population with a Degree in Liberal Arts and History in the United States?
Percentage of Population with a Degree in Liberal Arts and History in the United States is 4.9%.