Zip Codes with the Highest Percentage of Population with a Degree in Liberal Arts and History in Fall River, MA
RELATED REPORTS & OPTIONS
Liberal Arts and History
Fall River
Compare Zip Codes
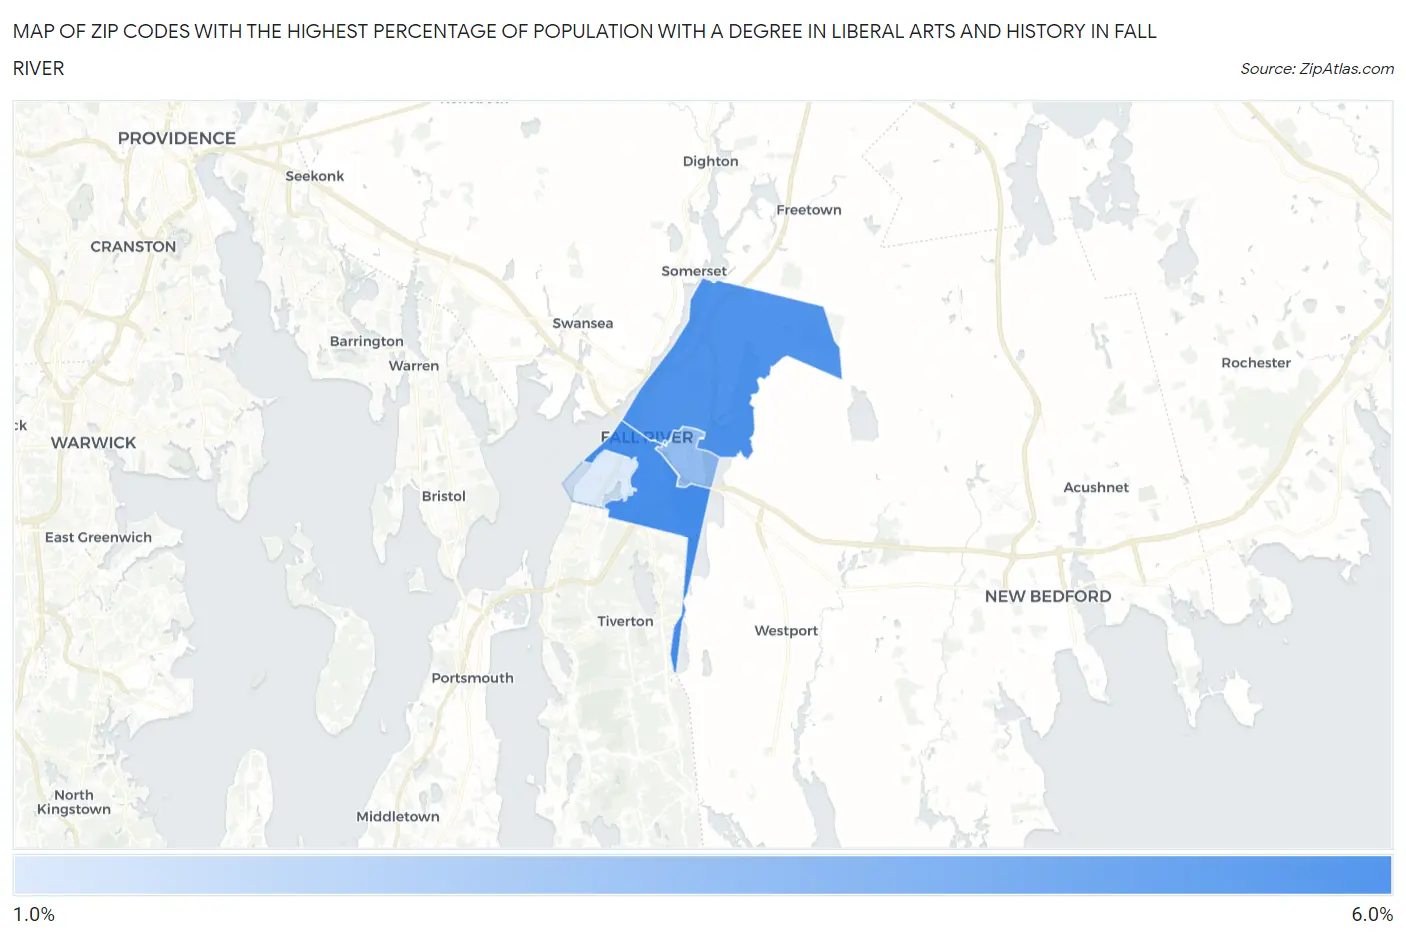
Map of Zip Codes with the Highest Percentage of Population with a Degree in Liberal Arts and History in Fall River
1.7%
5.5%
Zip Codes with the Highest Percentage of Population with a Degree in Liberal Arts and History in Fall River, MA
| Zip Code | % Graduates | vs State | vs National | |
| 1. | 02721 | 5.5% | 5.5%(-0.010)#234 | 4.9%(+0.598)#9,950 |
| 2. | 02720 | 5.3% | 5.5%(-0.228)#251 | 4.9%(+0.381)#10,589 |
| 3. | 02723 | 3.5% | 5.5%(-1.97)#390 | 4.9%(-1.36)#16,539 |
| 4. | 02724 | 1.7% | 5.5%(-3.80)#477 | 4.9%(-3.19)#22,134 |
1
Common Questions
What are the Top 3 Zip Codes with the Highest Percentage of Population with a Degree in Liberal Arts and History in Fall River, MA?
Top 3 Zip Codes with the Highest Percentage of Population with a Degree in Liberal Arts and History in Fall River, MA are:
What zip code has the Highest Percentage of Population with a Degree in Liberal Arts and History in Fall River, MA?
02721 has the Highest Percentage of Population with a Degree in Liberal Arts and History in Fall River, MA with 5.5%.
What is the Percentage of Population with a Degree in Liberal Arts and History in Fall River, MA?
Percentage of Population with a Degree in Liberal Arts and History in Fall River is 4.3%.
What is the Percentage of Population with a Degree in Liberal Arts and History in Massachusetts?
Percentage of Population with a Degree in Liberal Arts and History in Massachusetts is 5.5%.
What is the Percentage of Population with a Degree in Liberal Arts and History in the United States?
Percentage of Population with a Degree in Liberal Arts and History in the United States is 4.9%.