Zip Codes with the Highest Percentage of Population with a Degree in Liberal Arts and History in Haverhill, MA
RELATED REPORTS & OPTIONS
Liberal Arts and History
Haverhill
Compare Zip Codes
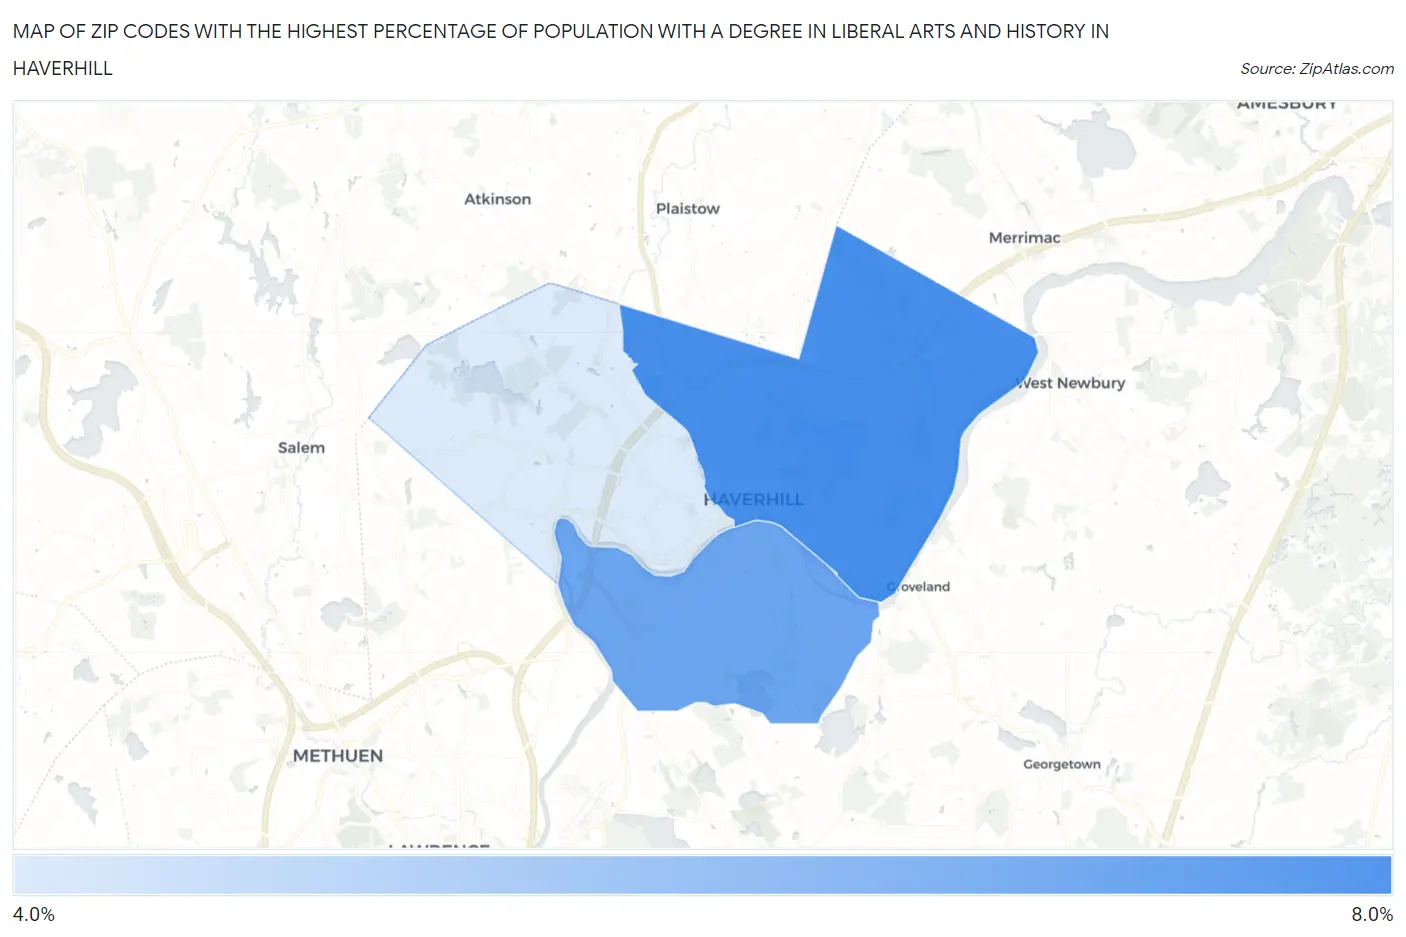
Map of Zip Codes with the Highest Percentage of Population with a Degree in Liberal Arts and History in Haverhill
4.9%
6.4%
Zip Codes with the Highest Percentage of Population with a Degree in Liberal Arts and History in Haverhill, MA
| Zip Code | % Graduates | vs State | vs National | |
| 1. | 01830 | 6.4% | 5.5%(+0.938)#166 | 4.9%(+1.55)#7,521 |
| 2. | 01835 | 6.0% | 5.5%(+0.555)#190 | 4.9%(+1.16)#8,423 |
| 3. | 01832 | 4.9% | 5.5%(-0.617)#283 | 4.9%(-0.008)#11,773 |
1
Common Questions
What are the Top Zip Codes with the Highest Percentage of Population with a Degree in Liberal Arts and History in Haverhill, MA?
Top Zip Codes with the Highest Percentage of Population with a Degree in Liberal Arts and History in Haverhill, MA are:
What zip code has the Highest Percentage of Population with a Degree in Liberal Arts and History in Haverhill, MA?
01830 has the Highest Percentage of Population with a Degree in Liberal Arts and History in Haverhill, MA with 6.4%.
What is the Percentage of Population with a Degree in Liberal Arts and History in Haverhill, MA?
Percentage of Population with a Degree in Liberal Arts and History in Haverhill is 5.8%.
What is the Percentage of Population with a Degree in Liberal Arts and History in Massachusetts?
Percentage of Population with a Degree in Liberal Arts and History in Massachusetts is 5.5%.
What is the Percentage of Population with a Degree in Liberal Arts and History in the United States?
Percentage of Population with a Degree in Liberal Arts and History in the United States is 4.9%.