Zip Codes with the Highest Percentage of Population with a Degree in Liberal Arts and History in Lynn, MA
RELATED REPORTS & OPTIONS
Liberal Arts and History
Lynn
Compare Zip Codes
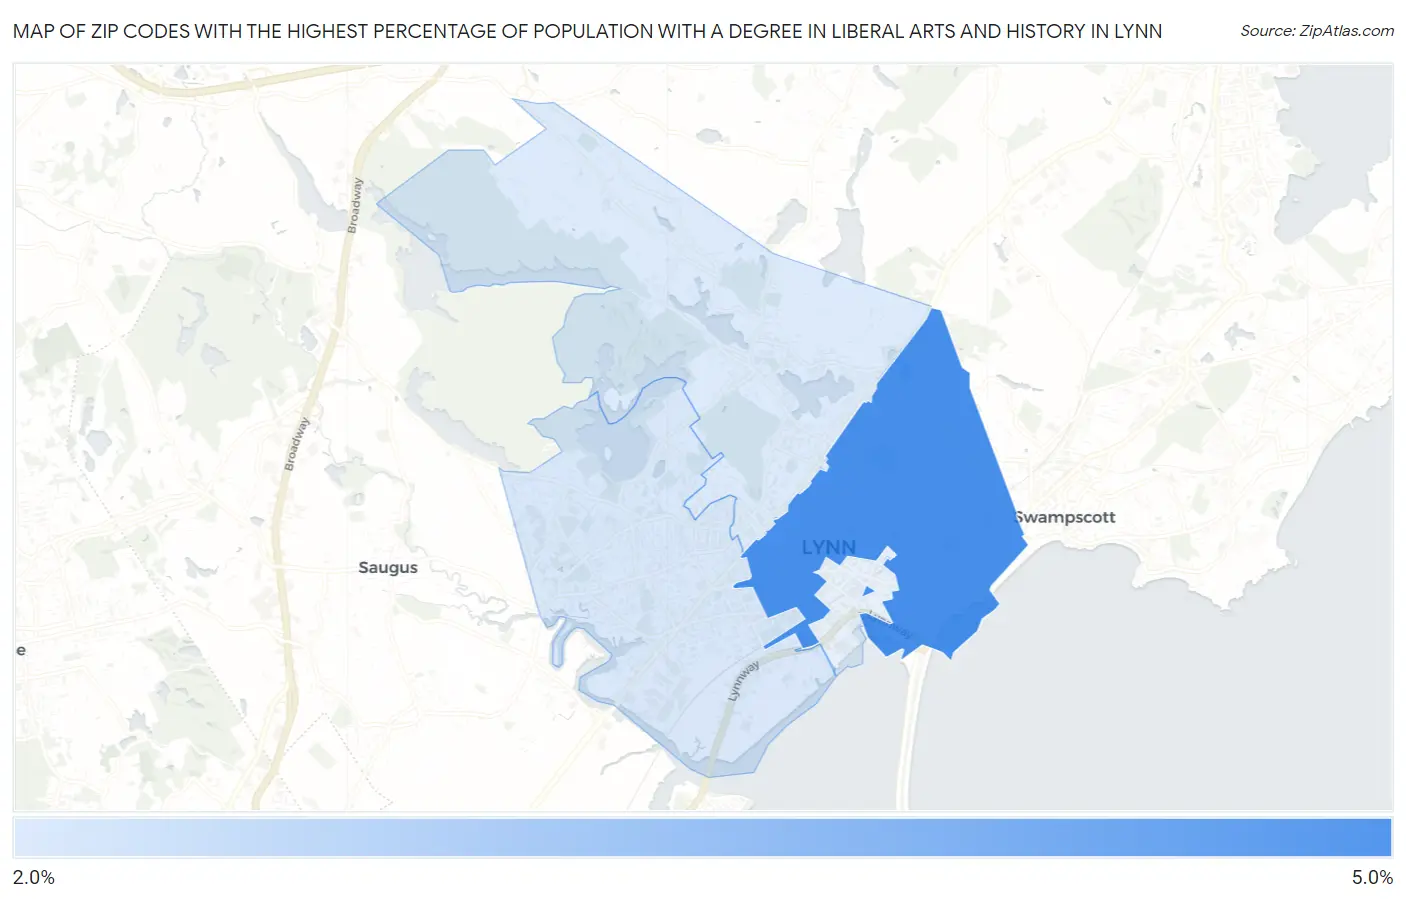
Map of Zip Codes with the Highest Percentage of Population with a Degree in Liberal Arts and History in Lynn
2.5%
4.8%
Zip Codes with the Highest Percentage of Population with a Degree in Liberal Arts and History in Lynn, MA
| Zip Code | % Graduates | vs State | vs National | |
| 1. | 01902 | 4.8% | 5.5%(-0.652)#289 | 4.9%(-0.043)#11,884 |
| 2. | 01905 | 2.6% | 5.5%(-2.92)#455 | 4.9%(-2.31)#19,791 |
| 3. | 01904 | 2.5% | 5.5%(-2.99)#458 | 4.9%(-2.38)#20,031 |
1
Common Questions
What are the Top 3 Zip Codes with the Highest Percentage of Population with a Degree in Liberal Arts and History in Lynn, MA?
Top 3 Zip Codes with the Highest Percentage of Population with a Degree in Liberal Arts and History in Lynn, MA are:
What zip code has the Highest Percentage of Population with a Degree in Liberal Arts and History in Lynn, MA?
01902 has the Highest Percentage of Population with a Degree in Liberal Arts and History in Lynn, MA with 4.8%.
What is the Percentage of Population with a Degree in Liberal Arts and History in Lynn, MA?
Percentage of Population with a Degree in Liberal Arts and History in Lynn is 3.5%.
What is the Percentage of Population with a Degree in Liberal Arts and History in Massachusetts?
Percentage of Population with a Degree in Liberal Arts and History in Massachusetts is 5.5%.
What is the Percentage of Population with a Degree in Liberal Arts and History in the United States?
Percentage of Population with a Degree in Liberal Arts and History in the United States is 4.9%.