Zip Codes with the Highest Percentage of Population with a Degree in Liberal Arts and History in Waltham, MA
RELATED REPORTS & OPTIONS
Liberal Arts and History
Waltham
Compare Zip Codes
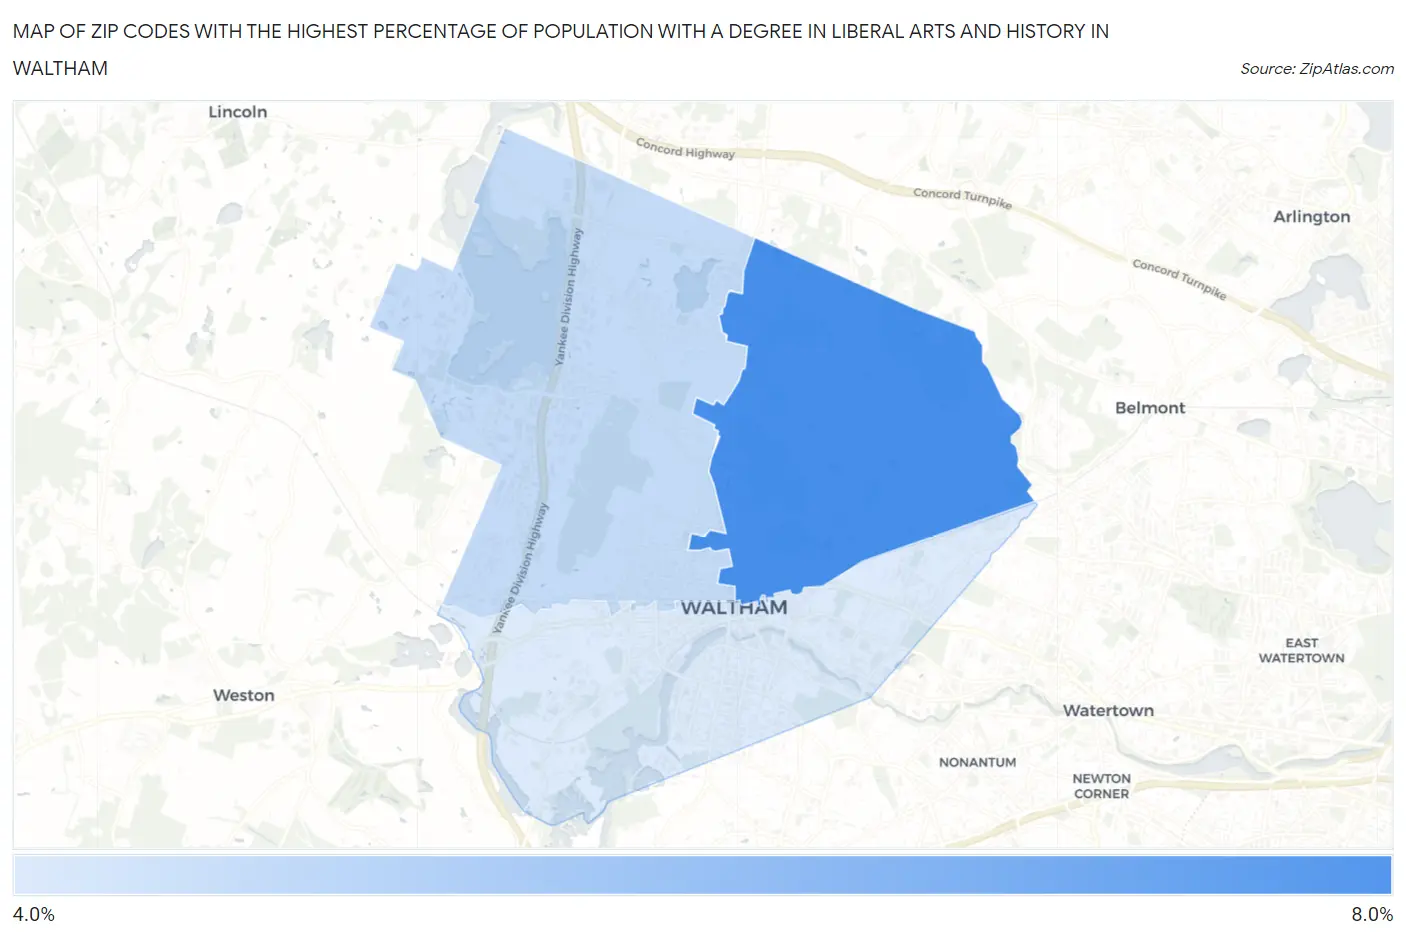
Map of Zip Codes with the Highest Percentage of Population with a Degree in Liberal Arts and History in Waltham
4.4%
7.9%
Zip Codes with the Highest Percentage of Population with a Degree in Liberal Arts and History in Waltham, MA
| Zip Code | % Graduates | vs State | vs National | |
| 1. | 02452 | 7.9% | 5.5%(+2.38)#108 | 4.9%(+2.99)#5,075 |
| 2. | 02451 | 5.0% | 5.5%(-0.457)#274 | 4.9%(+0.151)#11,275 |
| 3. | 02453 | 4.4% | 5.5%(-1.04)#317 | 4.9%(-0.430)#13,152 |
1
Common Questions
What are the Top Zip Codes with the Highest Percentage of Population with a Degree in Liberal Arts and History in Waltham, MA?
Top Zip Codes with the Highest Percentage of Population with a Degree in Liberal Arts and History in Waltham, MA are:
What zip code has the Highest Percentage of Population with a Degree in Liberal Arts and History in Waltham, MA?
02452 has the Highest Percentage of Population with a Degree in Liberal Arts and History in Waltham, MA with 7.9%.
What is the Percentage of Population with a Degree in Liberal Arts and History in Waltham, MA?
Percentage of Population with a Degree in Liberal Arts and History in Waltham is 5.3%.
What is the Percentage of Population with a Degree in Liberal Arts and History in Massachusetts?
Percentage of Population with a Degree in Liberal Arts and History in Massachusetts is 5.5%.
What is the Percentage of Population with a Degree in Liberal Arts and History in the United States?
Percentage of Population with a Degree in Liberal Arts and History in the United States is 4.9%.