Zip Codes with the Highest Percentage of Population with a Degree in Liberal Arts and History in Chicopee, MA
RELATED REPORTS & OPTIONS
Liberal Arts and History
Chicopee
Compare Zip Codes
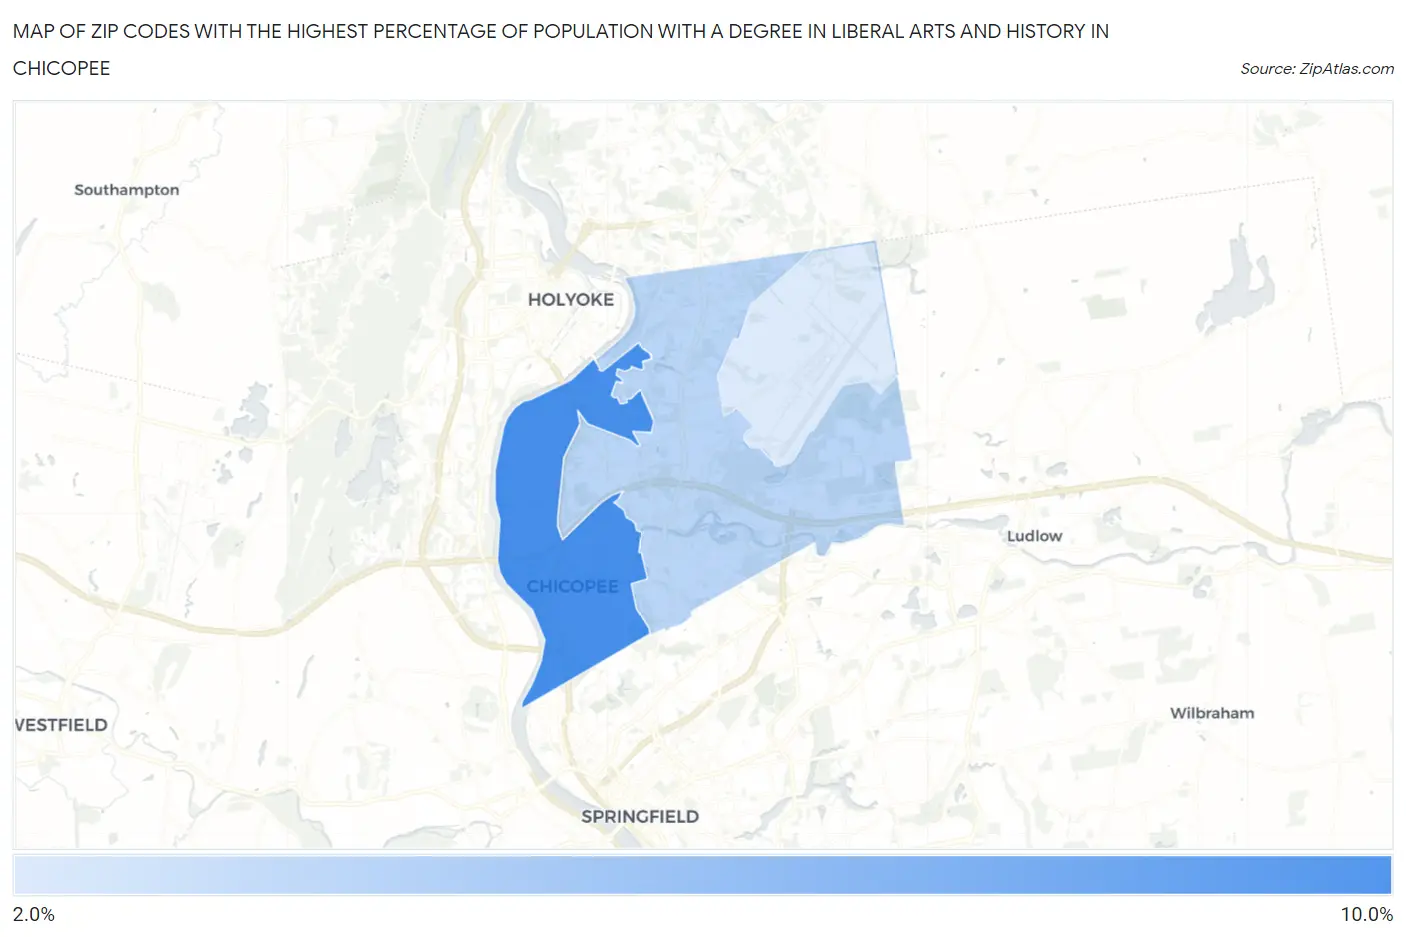
Map of Zip Codes with the Highest Percentage of Population with a Degree in Liberal Arts and History in Chicopee
2.6%
8.0%
Zip Codes with the Highest Percentage of Population with a Degree in Liberal Arts and History in Chicopee, MA
| Zip Code | % Graduates | vs State | vs National | |
| 1. | 01013 | 8.0% | 5.5%(+2.54)#101 | 4.9%(+3.15)#4,871 |
| 2. | 01020 | 3.8% | 5.5%(-1.66)#364 | 4.9%(-1.05)#15,430 |
| 3. | 01022 | 2.6% | 5.5%(-2.91)#450 | 4.9%(-2.30)#19,733 |
1
Common Questions
What are the Top Zip Codes with the Highest Percentage of Population with a Degree in Liberal Arts and History in Chicopee, MA?
Top Zip Codes with the Highest Percentage of Population with a Degree in Liberal Arts and History in Chicopee, MA are:
What zip code has the Highest Percentage of Population with a Degree in Liberal Arts and History in Chicopee, MA?
01013 has the Highest Percentage of Population with a Degree in Liberal Arts and History in Chicopee, MA with 8.0%.
What is the Percentage of Population with a Degree in Liberal Arts and History in Chicopee, MA?
Percentage of Population with a Degree in Liberal Arts and History in Chicopee is 5.5%.
What is the Percentage of Population with a Degree in Liberal Arts and History in Massachusetts?
Percentage of Population with a Degree in Liberal Arts and History in Massachusetts is 5.5%.
What is the Percentage of Population with a Degree in Liberal Arts and History in the United States?
Percentage of Population with a Degree in Liberal Arts and History in the United States is 4.9%.