Zip Codes with the Highest Percentage of Households With Three or more Vehicles in Lexington, MA
RELATED REPORTS & OPTIONS
Households with 3 or more Cars
Lexington
Compare Zip Codes
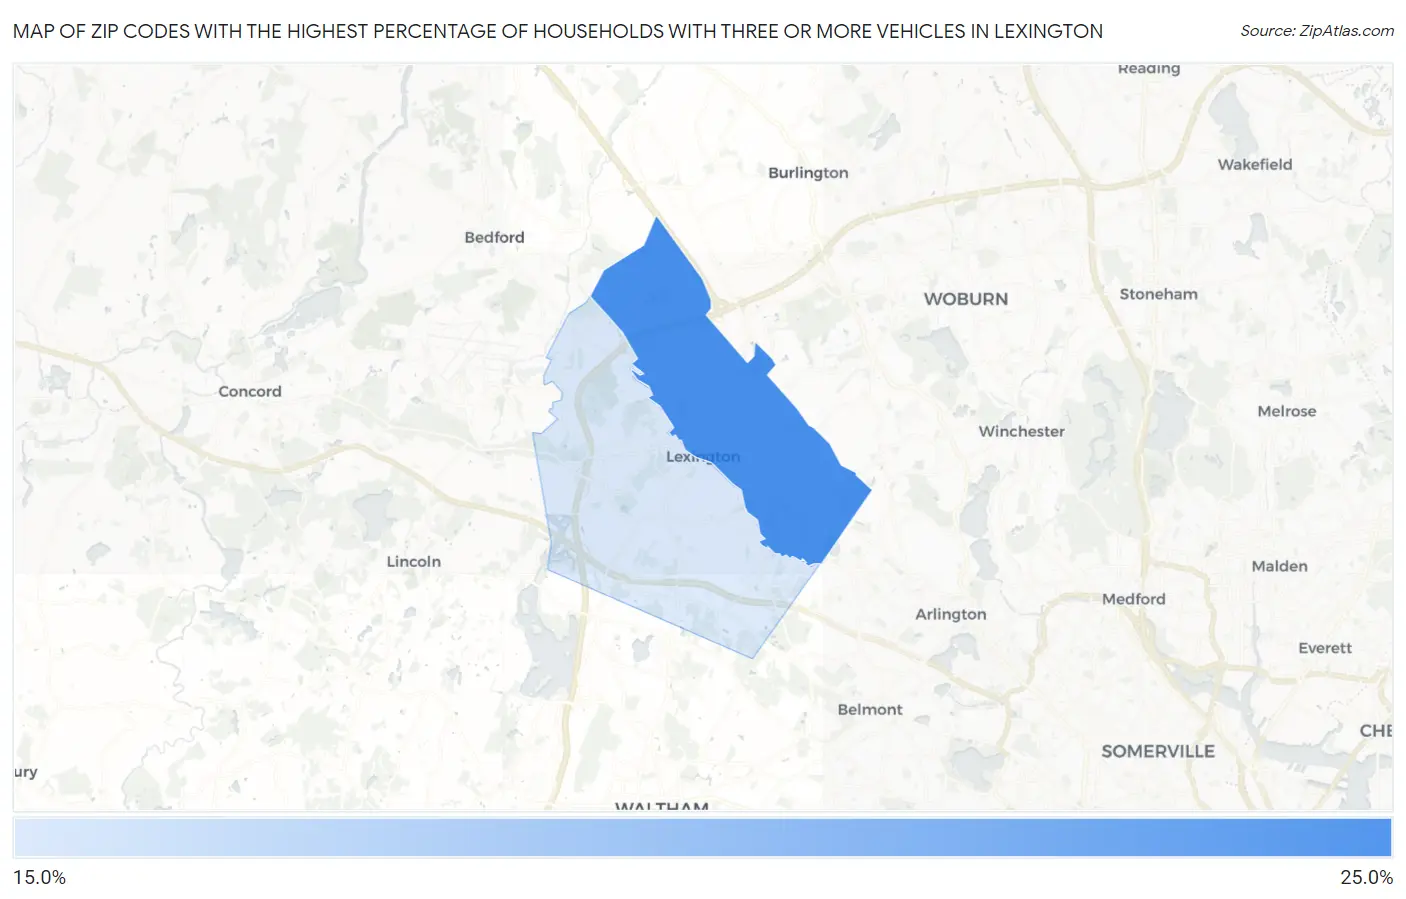
Map of Zip Codes with the Highest Percentage of Households With Three or more Vehicles in Lexington
17.4%
21.0%
Zip Codes with the Highest Percentage of Households With Three or more Vehicles in Lexington, MA
| Zip Code | Housholds With 3+ Cars | vs State | vs National | |
| 1. | 02420 | 21.0% | 23.7%(-2.70)#341 | 29.0%(-8.00)#25,994 |
| 2. | 02421 | 17.4% | 23.7%(-6.30)#412 | 29.0%(-11.6)#28,117 |
1
Common Questions
What are the Top Zip Codes with the Highest Percentage of Households With Three or more Vehicles in Lexington, MA?
Top Zip Codes with the Highest Percentage of Households With Three or more Vehicles in Lexington, MA are:
What zip code has the Highest Percentage of Households With Three or more Vehicles in Lexington, MA?
02420 has the Highest Percentage of Households With Three or more Vehicles in Lexington, MA with 21.0%.
What is the Percentage of Households With Three or more Vehicles in Lexington, MA?
Percentage of Households With Three or more Vehicles in Lexington is 19.1%.
What is the Percentage of Households With Three or more Vehicles in Massachusetts?
Percentage of Households With Three or more Vehicles in Massachusetts is 23.7%.
What is the Percentage of Households With Three or more Vehicles in the United States?
Percentage of Households With Three or more Vehicles in the United States is 29.0%.