Zip Codes with the Highest Percentage of Population with a Degree in Psychology in Peoria, IL
RELATED REPORTS & OPTIONS
Psychology
Peoria
Compare Zip Codes
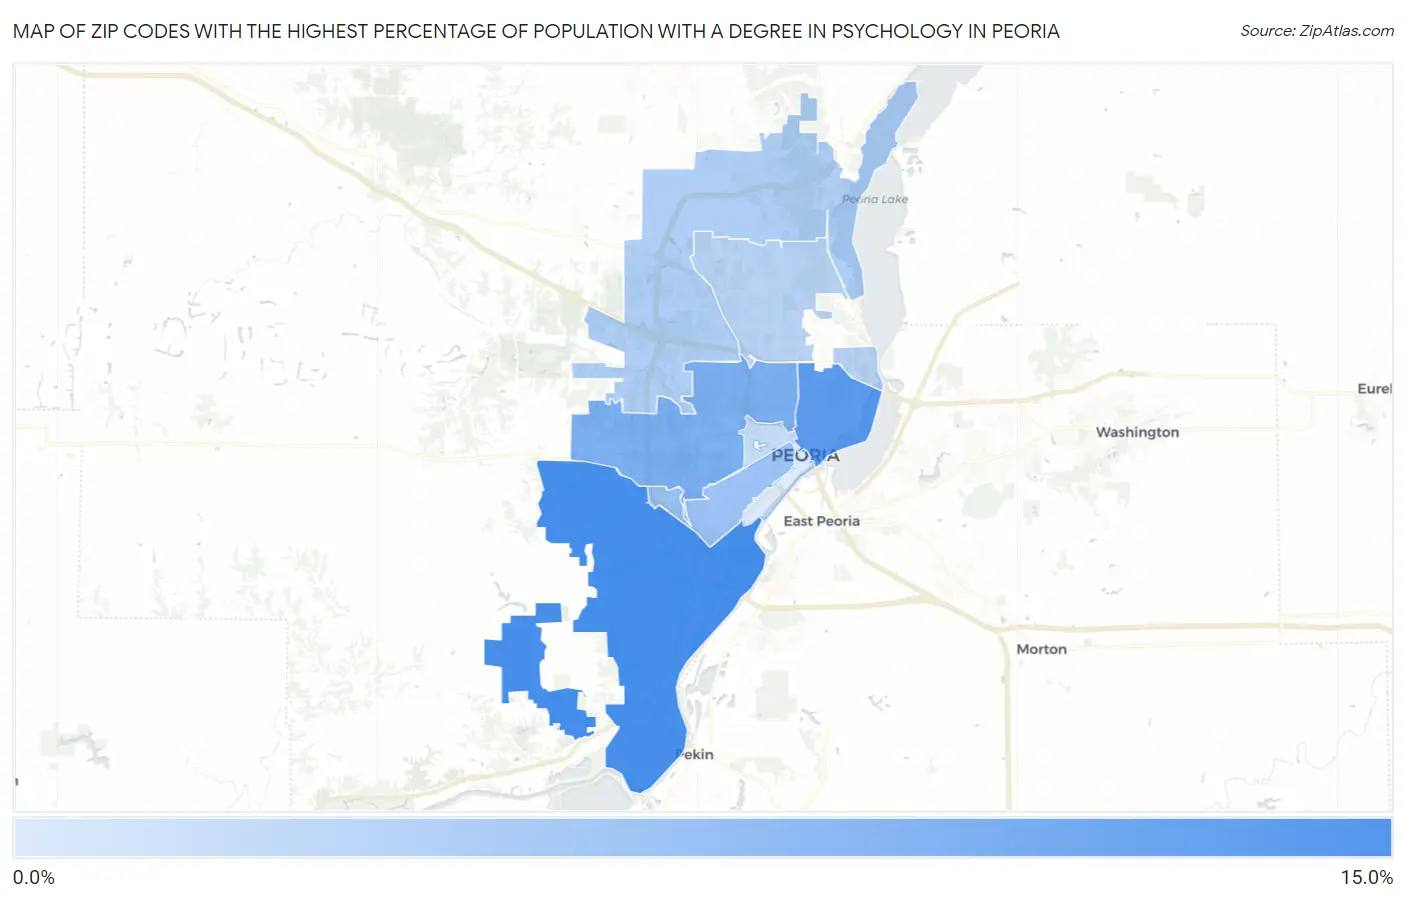
Map of Zip Codes with the Highest Percentage of Population with a Degree in Psychology in Peoria
3.1%
10.2%
Zip Codes with the Highest Percentage of Population with a Degree in Psychology in Peoria, IL
| Zip Code | % Graduates | vs State | vs National | |
| 1. | 61607 | 10.2% | 4.9%(+5.36)#96 | 5.1%(+5.16)#2,382 |
| 2. | 61603 | 9.3% | 4.9%(+4.46)#119 | 5.1%(+4.27)#2,895 |
| 3. | 61604 | 7.6% | 4.9%(+2.77)#177 | 5.1%(+2.58)#4,612 |
| 4. | 61605 | 6.1% | 4.9%(+1.28)#268 | 5.1%(+1.09)#7,553 |
| 5. | 61615 | 5.1% | 4.9%(+0.236)#425 | 5.1%(+0.043)#10,923 |
| 6. | 61614 | 4.8% | 4.9%(-0.071)#469 | 5.1%(-0.265)#11,998 |
| 7. | 61606 | 4.2% | 4.9%(-0.677)#558 | 5.1%(-0.871)#14,300 |
| 8. | 61602 | 3.1% | 4.9%(-1.79)#728 | 5.1%(-1.98)#18,022 |
1
Common Questions
What are the Top 5 Zip Codes with the Highest Percentage of Population with a Degree in Psychology in Peoria, IL?
Top 5 Zip Codes with the Highest Percentage of Population with a Degree in Psychology in Peoria, IL are:
What zip code has the Highest Percentage of Population with a Degree in Psychology in Peoria, IL?
61607 has the Highest Percentage of Population with a Degree in Psychology in Peoria, IL with 10.2%.
What is the Percentage of Population with a Degree in Psychology in Peoria, IL?
Percentage of Population with a Degree in Psychology in Peoria is 5.4%.
What is the Percentage of Population with a Degree in Psychology in Illinois?
Percentage of Population with a Degree in Psychology in Illinois is 4.9%.
What is the Percentage of Population with a Degree in Psychology in the United States?
Percentage of Population with a Degree in Psychology in the United States is 5.1%.