Zip Codes with the Highest Percentage of Population with a Degree in Psychology in Danville, IL
RELATED REPORTS & OPTIONS
Psychology
Danville
Compare Zip Codes
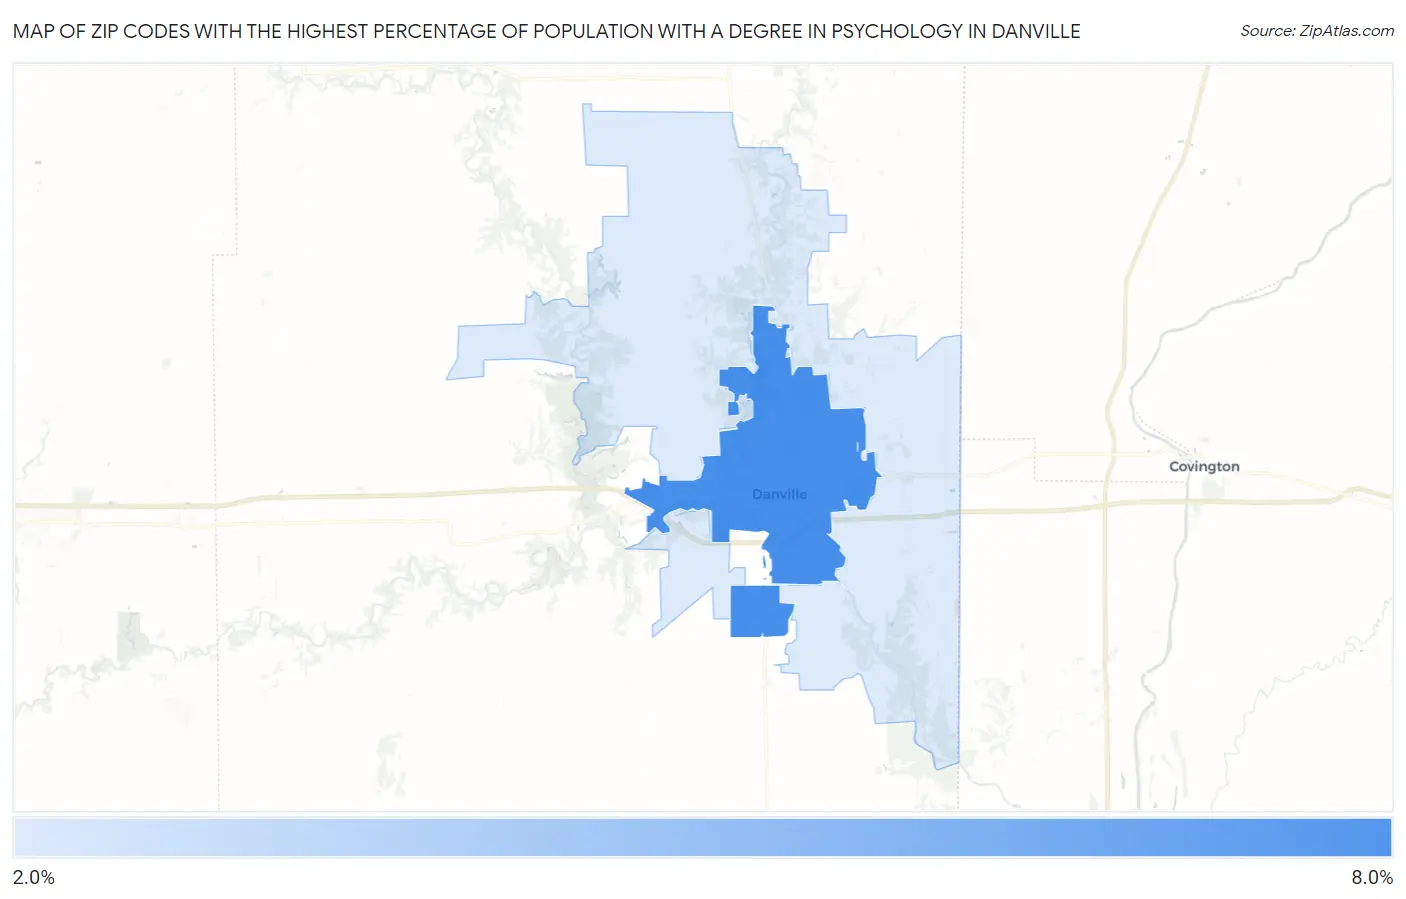
Map of Zip Codes with the Highest Percentage of Population with a Degree in Psychology in Danville
2.3%
6.5%
Zip Codes with the Highest Percentage of Population with a Degree in Psychology in Danville, IL
| Zip Code | % Graduates | vs State | vs National | |
| 1. | 61832 | 6.5% | 4.9%(+1.65)#248 | 5.1%(+1.46)#6,636 |
| 2. | 61834 | 2.3% | 4.9%(-2.54)#820 | 5.1%(-2.73)#20,068 |
1
Common Questions
What are the Top Zip Codes with the Highest Percentage of Population with a Degree in Psychology in Danville, IL?
Top Zip Codes with the Highest Percentage of Population with a Degree in Psychology in Danville, IL are:
What zip code has the Highest Percentage of Population with a Degree in Psychology in Danville, IL?
61832 has the Highest Percentage of Population with a Degree in Psychology in Danville, IL with 6.5%.
What is the Percentage of Population with a Degree in Psychology in Danville, IL?
Percentage of Population with a Degree in Psychology in Danville is 6.0%.
What is the Percentage of Population with a Degree in Psychology in Illinois?
Percentage of Population with a Degree in Psychology in Illinois is 4.9%.
What is the Percentage of Population with a Degree in Psychology in the United States?
Percentage of Population with a Degree in Psychology in the United States is 5.1%.