St Peter, IL Map & Demographics
St Peter Map
St Peter Overview
$30,547
PER CAPITA INCOME
$67,083
AVG FAMILY INCOME
$65,208
AVG HOUSEHOLD INCOME
37.6%
WAGE / INCOME GAP [ % ]
62.4¢/ $1
WAGE / INCOME GAP [ $ ]
0.40
INEQUALITY / GINI INDEX
289
TOTAL POPULATION
146
MALE POPULATION
143
FEMALE POPULATION
102.10
MALES / 100 FEMALES
97.95
FEMALES / 100 MALES
39.7
MEDIAN AGE
3.3
AVG FAMILY SIZE
2.7
AVG HOUSEHOLD SIZE
121
LABOR FORCE [ PEOPLE ]
54.5%
PERCENT IN LABOR FORCE
Income in St Peter
Income Overview in St Peter
Per Capita Income in St Peter is $30,547, while median incomes of families and households are $67,083 and $65,208 respectively.
| Characteristic | Number | Measure |
| Per Capita Income | 289 | $30,547 |
| Median Family Income | 74 | $67,083 |
| Mean Family Income | 74 | $83,662 |
| Median Household Income | 107 | $65,208 |
| Mean Household Income | 107 | $78,341 |
| Income Deficit | 74 | $0 |
| Wage / Income Gap (%) | 289 | 37.60% |
| Wage / Income Gap ($) | 289 | 62.40¢ per $1 |
| Gini / Inequality Index | 289 | 0.40 |
Earnings by Sex in St Peter
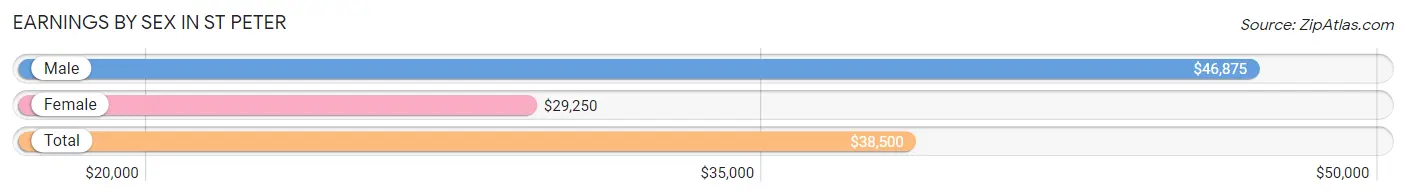
Average Earnings in St Peter are $38,500, $46,875 for men and $29,250 for women, a difference of 37.6%.
| Sex | Number | Average Earnings |
| Male | 71 (52.2%) | $46,875 |
| Female | 65 (47.8%) | $29,250 |
| Total | 136 (100.0%) | $38,500 |
Earnings by Sex by Income Bracket in St Peter
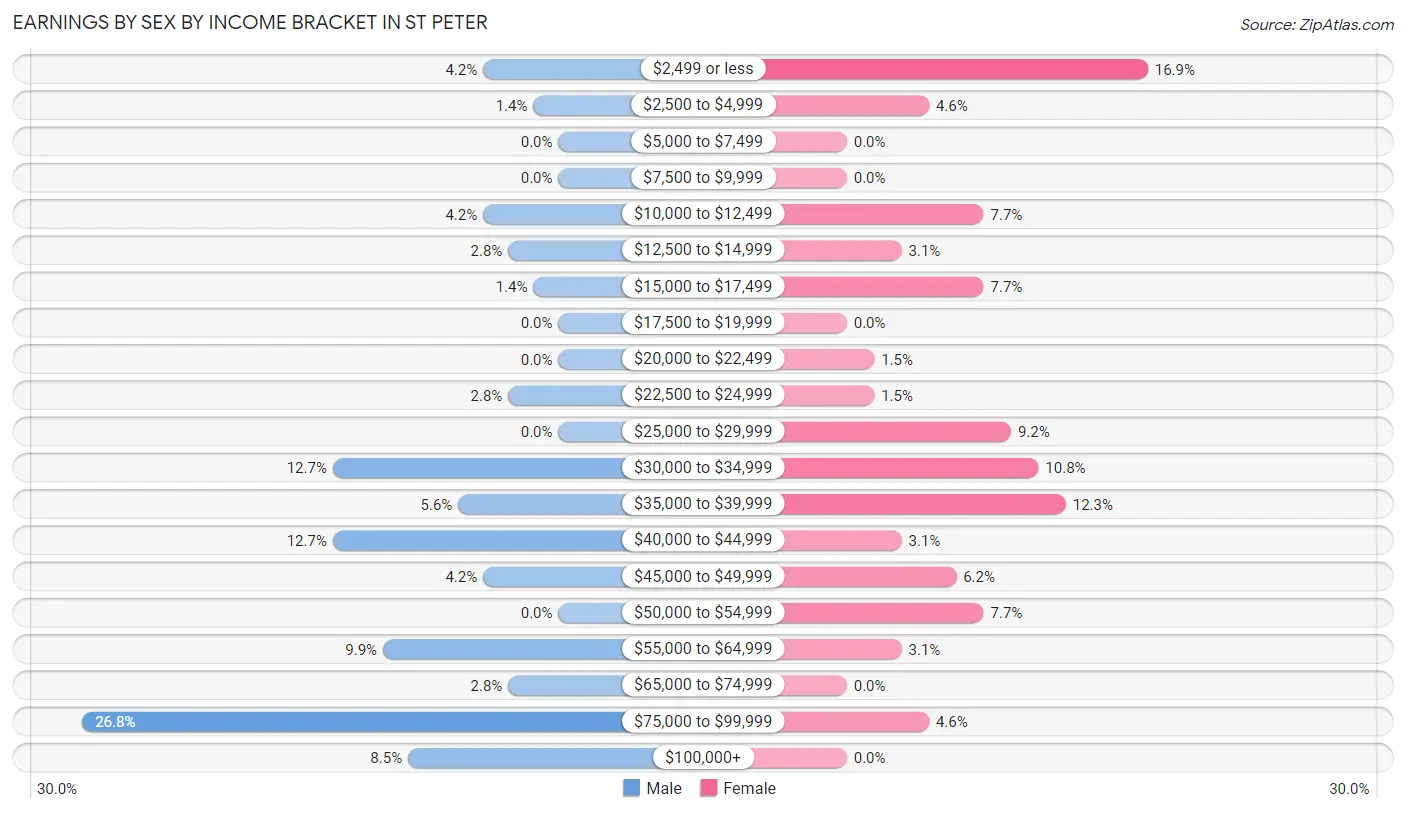
The most common earnings brackets in St Peter are $75,000 to $99,999 for men (19 | 26.8%) and $2,499 or less for women (11 | 16.9%).
| Income | Male | Female |
| $2,499 or less | 3 (4.2%) | 11 (16.9%) |
| $2,500 to $4,999 | 1 (1.4%) | 3 (4.6%) |
| $5,000 to $7,499 | 0 (0.0%) | 0 (0.0%) |
| $7,500 to $9,999 | 0 (0.0%) | 0 (0.0%) |
| $10,000 to $12,499 | 3 (4.2%) | 5 (7.7%) |
| $12,500 to $14,999 | 2 (2.8%) | 2 (3.1%) |
| $15,000 to $17,499 | 1 (1.4%) | 5 (7.7%) |
| $17,500 to $19,999 | 0 (0.0%) | 0 (0.0%) |
| $20,000 to $22,499 | 0 (0.0%) | 1 (1.5%) |
| $22,500 to $24,999 | 2 (2.8%) | 1 (1.5%) |
| $25,000 to $29,999 | 0 (0.0%) | 6 (9.2%) |
| $30,000 to $34,999 | 9 (12.7%) | 7 (10.8%) |
| $35,000 to $39,999 | 4 (5.6%) | 8 (12.3%) |
| $40,000 to $44,999 | 9 (12.7%) | 2 (3.1%) |
| $45,000 to $49,999 | 3 (4.2%) | 4 (6.1%) |
| $50,000 to $54,999 | 0 (0.0%) | 5 (7.7%) |
| $55,000 to $64,999 | 7 (9.9%) | 2 (3.1%) |
| $65,000 to $74,999 | 2 (2.8%) | 0 (0.0%) |
| $75,000 to $99,999 | 19 (26.8%) | 3 (4.6%) |
| $100,000+ | 6 (8.5%) | 0 (0.0%) |
| Total | 71 (100.0%) | 65 (100.0%) |
Earnings by Sex by Educational Attainment in St Peter
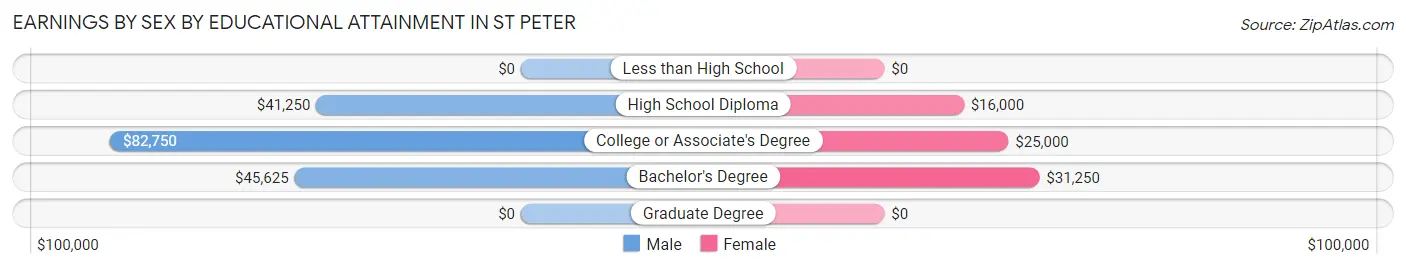
Average earnings in St Peter are $55,250 for men and $29,000 for women, a difference of 47.5%. Men with an educational attainment of college or associate's degree enjoy the highest average annual earnings of $82,750, while those with high school diploma education earn the least with $41,250. Women with an educational attainment of bachelor's degree earn the most with the average annual earnings of $31,250, while those with high school diploma education have the smallest earnings of $16,000.
| Educational Attainment | Male Income | Female Income |
| Less than High School | - | - |
| High School Diploma | $41,250 | $16,000 |
| College or Associate's Degree | $82,750 | $25,000 |
| Bachelor's Degree | $45,625 | $31,250 |
| Graduate Degree | - | - |
| Total | $55,250 | $29,000 |
Family Income in St Peter
Family Income Brackets in St Peter
According to the St Peter family income data, there are 23 families falling into the $100,000 to $149,999 income range, which is the most common income bracket and makes up 31.1% of all families. Conversely, the $150,000 to $199,999 income bracket is the least frequent group with only 1 families (1.3%) belonging to this category.
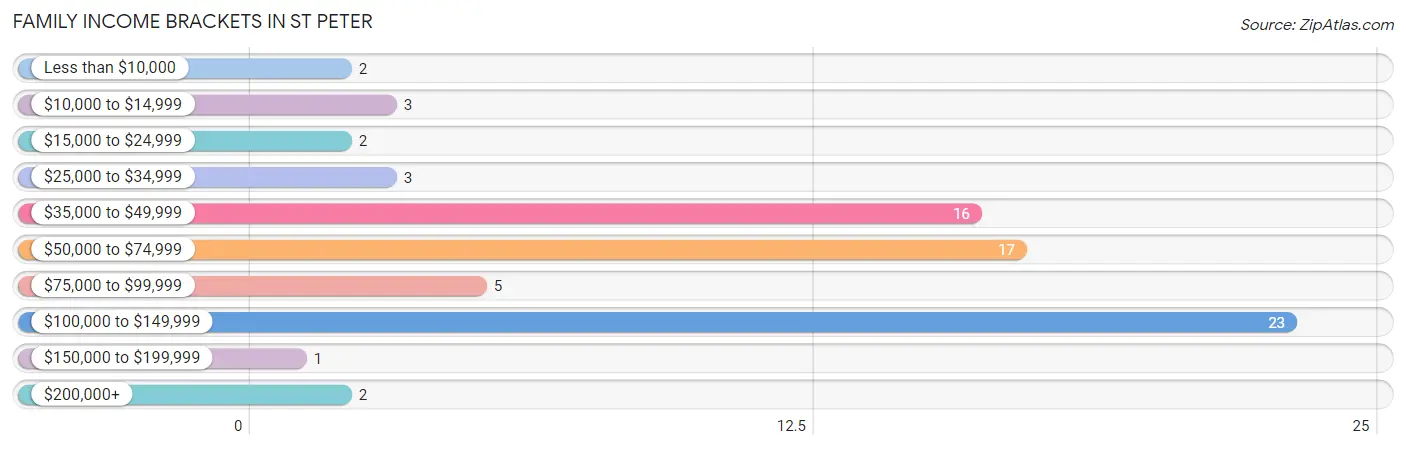
| Income Bracket | # Families | % Families |
| Less than $10,000 | 2 | 2.7% |
| $10,000 to $14,999 | 3 | 4.1% |
| $15,000 to $24,999 | 2 | 2.7% |
| $25,000 to $34,999 | 3 | 4.1% |
| $35,000 to $49,999 | 16 | 21.6% |
| $50,000 to $74,999 | 17 | 23.0% |
| $75,000 to $99,999 | 5 | 6.8% |
| $100,000 to $149,999 | 23 | 31.1% |
| $150,000 to $199,999 | 1 | 1.4% |
| $200,000+ | 2 | 2.7% |
Family Income by Famaliy Size in St Peter
4-person families (14 | 18.9%) account for the highest median family income in St Peter with $108,750 per family, while 2-person families (38 | 51.3%) have the highest median income of $34,375 per family member.
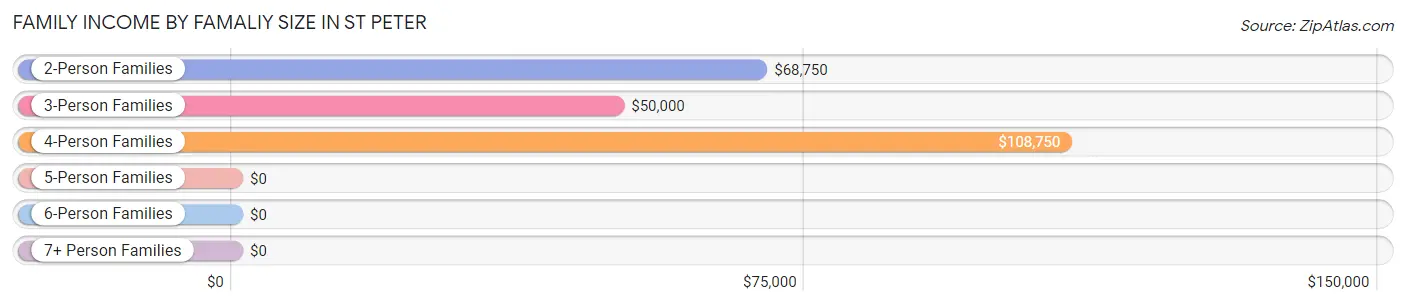
| Income Bracket | # Families | Median Income |
| 2-Person Families | 38 (51.3%) | $68,750 |
| 3-Person Families | 14 (18.9%) | $50,000 |
| 4-Person Families | 14 (18.9%) | $108,750 |
| 5-Person Families | 4 (5.4%) | $0 |
| 6-Person Families | 3 (4.1%) | $0 |
| 7+ Person Families | 1 (1.3%) | $0 |
| Total | 74 (100.0%) | $67,083 |
Family Income by Number of Earners in St Peter
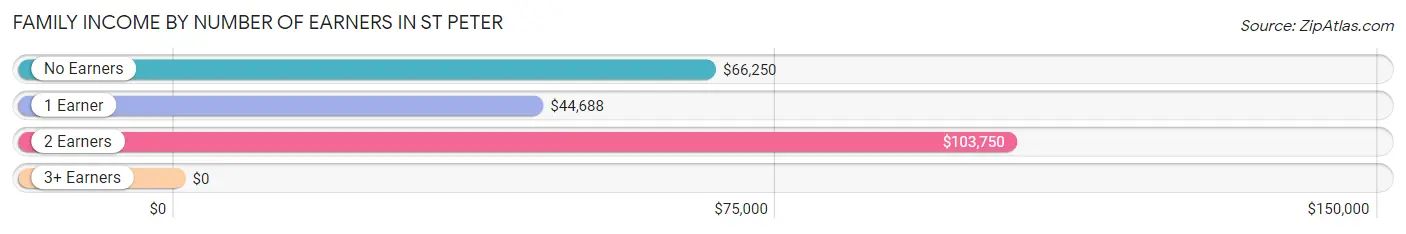
| Number of Earners | # Families | Median Income |
| No Earners | 7 (9.5%) | $66,250 |
| 1 Earner | 29 (39.2%) | $44,688 |
| 2 Earners | 36 (48.6%) | $103,750 |
| 3+ Earners | 2 (2.7%) | $0 |
| Total | 74 (100.0%) | $67,083 |
Household Income in St Peter
Household Income Brackets in St Peter
With 23 households falling in the category, the $100,000 to $149,999 income range is the most frequent in St Peter, accounting for 21.5% of all households. In contrast, only 1 households (0.9%) fall into the $150,000 to $199,999 income bracket, making it the least populous group.
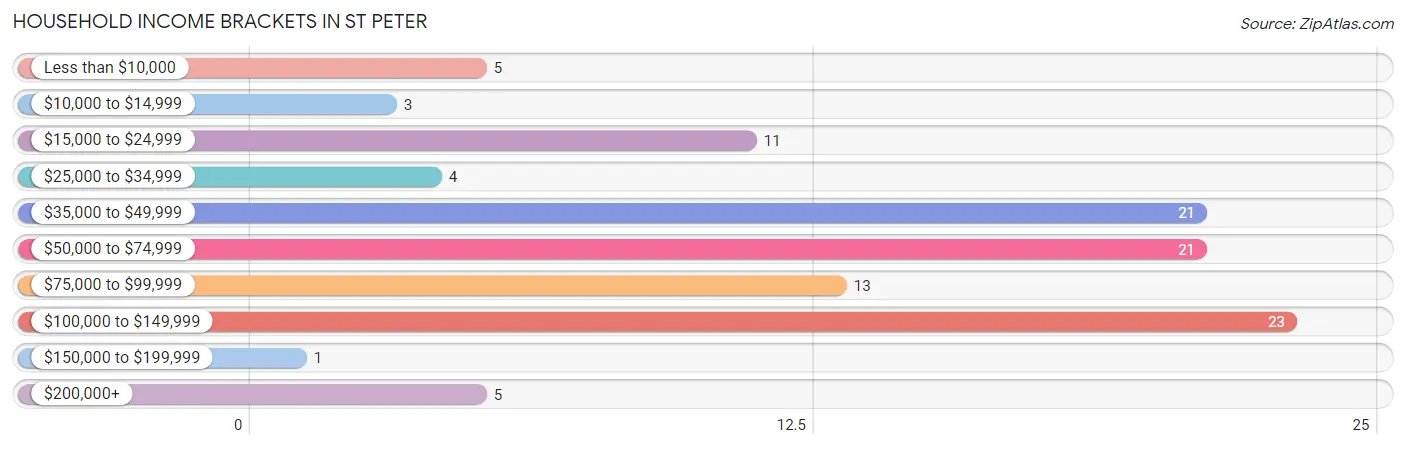
| Income Bracket | # Households | % Households |
| Less than $10,000 | 5 | 4.7% |
| $10,000 to $14,999 | 3 | 2.8% |
| $15,000 to $24,999 | 11 | 10.3% |
| $25,000 to $34,999 | 4 | 3.7% |
| $35,000 to $49,999 | 21 | 19.6% |
| $50,000 to $74,999 | 21 | 19.6% |
| $75,000 to $99,999 | 13 | 12.1% |
| $100,000 to $149,999 | 23 | 21.5% |
| $150,000 to $199,999 | 1 | 0.9% |
| $200,000+ | 5 | 4.7% |
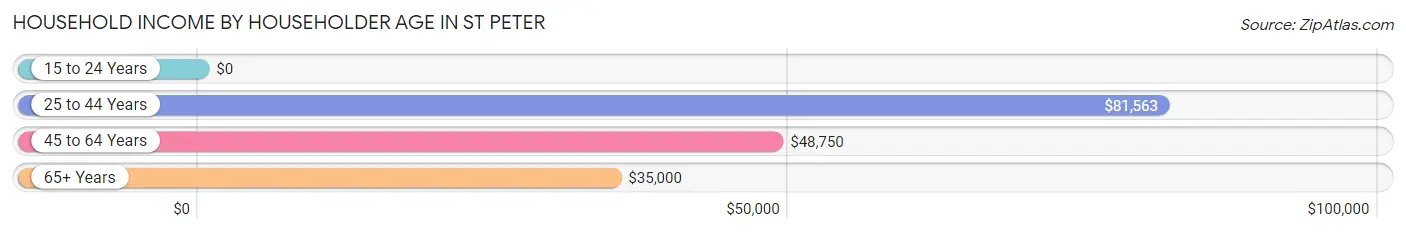
Household Income by Householder Age in St Peter
The median household income in St Peter is $65,208, with the highest median household income of $81,563 found in the 25 to 44 years age bracket for the primary householder. A total of 35 households (32.7%) fall into this category. Meanwhile, the 15 to 24 years age bracket for the primary householder has the lowest median household income of $0, with 3 households (2.8%) in this group.
| Income Bracket | # Households | Median Income |
| 15 to 24 Years | 3 (2.8%) | $0 |
| 25 to 44 Years | 35 (32.7%) | $81,563 |
| 45 to 64 Years | 33 (30.8%) | $48,750 |
| 65+ Years | 36 (33.6%) | $35,000 |
| Total | 107 (100.0%) | $65,208 |
Poverty in St Peter
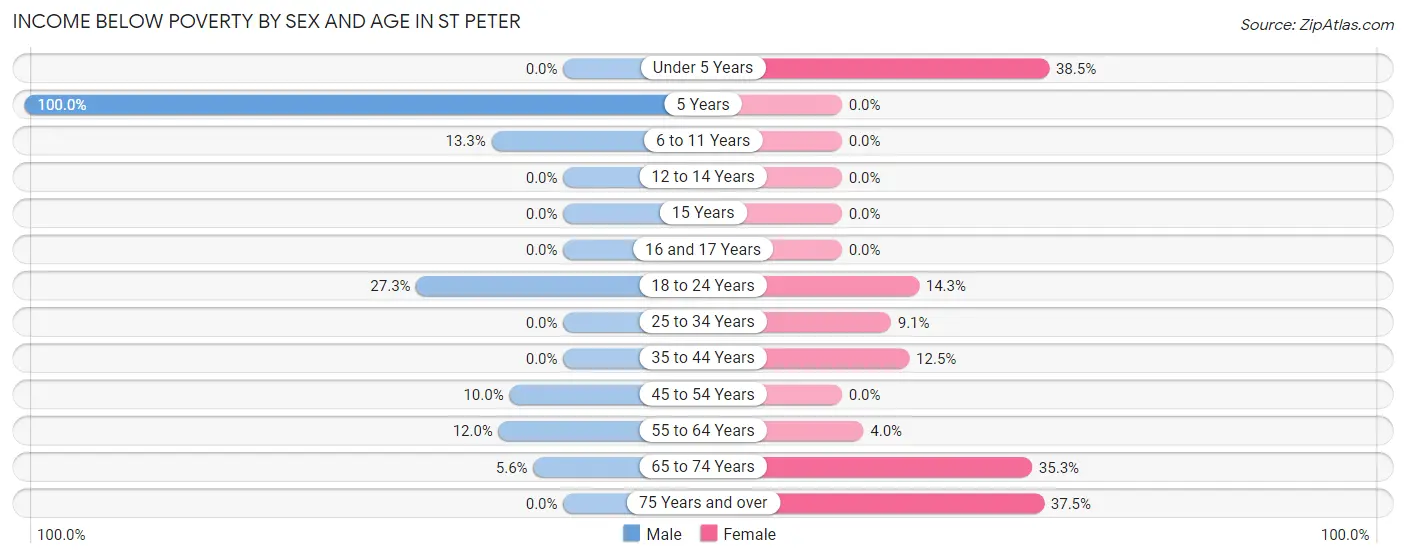
Income Below Poverty by Sex and Age in St Peter
With 8.2% poverty level for males and 15.4% for females among the residents of St Peter, 5 year old males and under 5 year old females are the most vulnerable to poverty, with 2 males (100.0%) and 5 females (38.5%) in their respective age groups living below the poverty level.
| Age Bracket | Male | Female |
| Under 5 Years | 0 (0.0%) | 5 (38.5%) |
| 5 Years | 2 (100.0%) | 0 (0.0%) |
| 6 to 11 Years | 2 (13.3%) | 0 (0.0%) |
| 12 to 14 Years | 0 (0.0%) | 0 (0.0%) |
| 15 Years | 0 (0.0%) | 0 (0.0%) |
| 16 and 17 Years | 0 (0.0%) | 0 (0.0%) |
| 18 to 24 Years | 3 (27.3%) | 1 (14.3%) |
| 25 to 34 Years | 0 (0.0%) | 1 (9.1%) |
| 35 to 44 Years | 0 (0.0%) | 2 (12.5%) |
| 45 to 54 Years | 1 (10.0%) | 0 (0.0%) |
| 55 to 64 Years | 3 (12.0%) | 1 (4.0%) |
| 65 to 74 Years | 1 (5.6%) | 6 (35.3%) |
| 75 Years and over | 0 (0.0%) | 6 (37.5%) |
| Total | 12 (8.2%) | 22 (15.4%) |
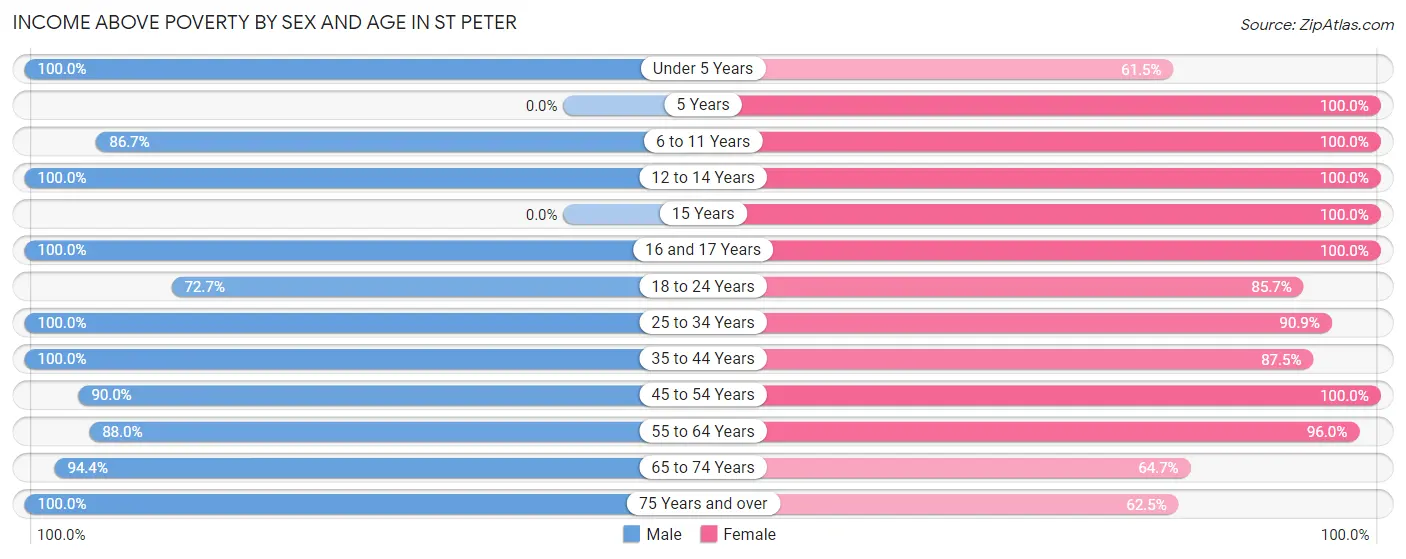
Income Above Poverty by Sex and Age in St Peter
According to the poverty statistics in St Peter, males aged under 5 years and females aged 5 years are the age groups that are most secure financially, with 100.0% of males and 100.0% of females in these age groups living above the poverty line.
| Age Bracket | Male | Female |
| Under 5 Years | 11 (100.0%) | 8 (61.5%) |
| 5 Years | 0 (0.0%) | 10 (100.0%) |
| 6 to 11 Years | 13 (86.7%) | 3 (100.0%) |
| 12 to 14 Years | 5 (100.0%) | 7 (100.0%) |
| 15 Years | 0 (0.0%) | 1 (100.0%) |
| 16 and 17 Years | 5 (100.0%) | 8 (100.0%) |
| 18 to 24 Years | 8 (72.7%) | 6 (85.7%) |
| 25 to 34 Years | 15 (100.0%) | 10 (90.9%) |
| 35 to 44 Years | 24 (100.0%) | 14 (87.5%) |
| 45 to 54 Years | 9 (90.0%) | 9 (100.0%) |
| 55 to 64 Years | 22 (88.0%) | 24 (96.0%) |
| 65 to 74 Years | 17 (94.4%) | 11 (64.7%) |
| 75 Years and over | 5 (100.0%) | 10 (62.5%) |
| Total | 134 (91.8%) | 121 (84.6%) |
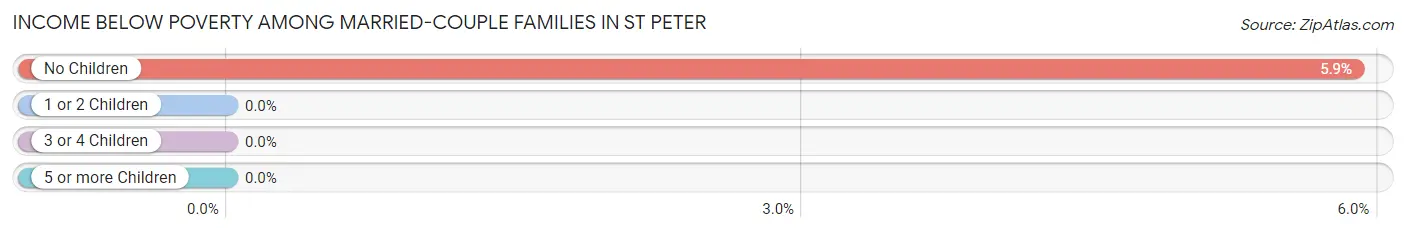
Income Below Poverty Among Married-Couple Families in St Peter
The poverty statistics for married-couple families in St Peter show that 3.4% or 2 of the total 59 families live below the poverty line. Families with no children have the highest poverty rate of 5.9%, comprising of 2 families. On the other hand, families with 1 or 2 children have the lowest poverty rate of 0.0%, which includes 0 families.
| Children | Above Poverty | Below Poverty |
| No Children | 32 (94.1%) | 2 (5.9%) |
| 1 or 2 Children | 19 (100.0%) | 0 (0.0%) |
| 3 or 4 Children | 5 (100.0%) | 0 (0.0%) |
| 5 or more Children | 1 (100.0%) | 0 (0.0%) |
| Total | 57 (96.6%) | 2 (3.4%) |
Income Below Poverty Among Single-Parent Households in St Peter
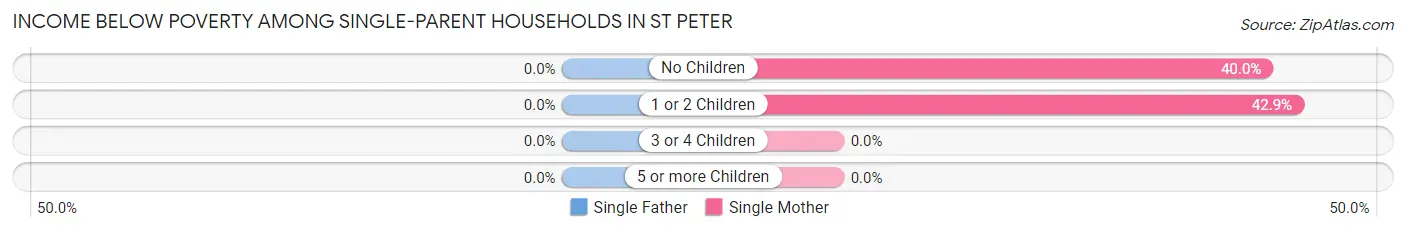
| Children | Single Father | Single Mother |
| No Children | 0 (0.0%) | 2 (40.0%) |
| 1 or 2 Children | 0 (0.0%) | 3 (42.9%) |
| 3 or 4 Children | 0 (0.0%) | 0 (0.0%) |
| 5 or more Children | 0 (0.0%) | 0 (0.0%) |
| Total | 0 (0.0%) | 5 (41.7%) |
Income Below Poverty Among Married-Couple vs Single-Parent Households in St Peter
The poverty data for St Peter shows that 2 of the married-couple family households (3.4%) and 5 of the single-parent households (33.3%) are living below the poverty level. Within the married-couple family households, those with no children have the highest poverty rate, with 2 households (5.9%) falling below the poverty line. Among the single-parent households, those with no children have the highest poverty rate, with 2 household (40.0%) living below poverty.
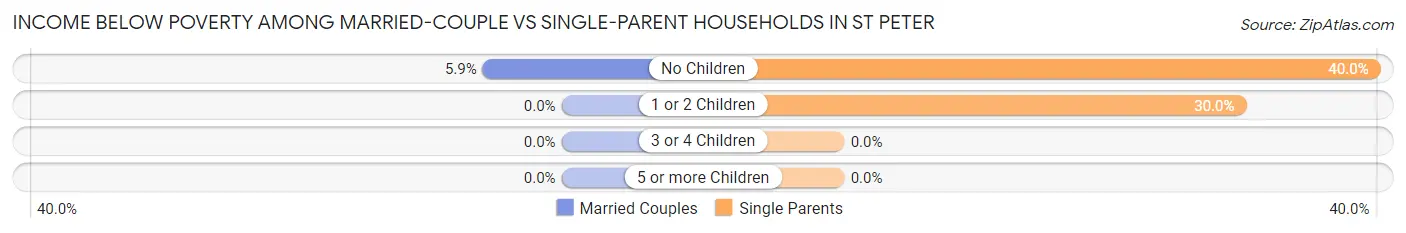
| Children | Married-Couple Families | Single-Parent Households |
| No Children | 2 (5.9%) | 2 (40.0%) |
| 1 or 2 Children | 0 (0.0%) | 3 (30.0%) |
| 3 or 4 Children | 0 (0.0%) | 0 (0.0%) |
| 5 or more Children | 0 (0.0%) | 0 (0.0%) |
| Total | 2 (3.4%) | 5 (33.3%) |
Race in St Peter
The most populous races in St Peter are White / Caucasian (282 | 97.6%), and Two or more Races (7 | 2.4%).
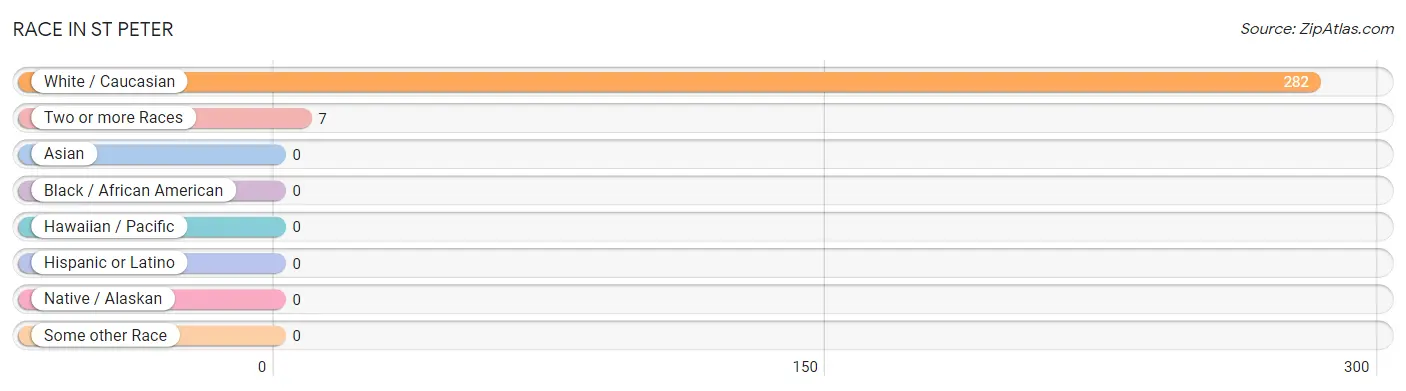
| Race | # Population | % Population |
| Asian | 0 | 0.0% |
| Black / African American | 0 | 0.0% |
| Hawaiian / Pacific | 0 | 0.0% |
| Hispanic or Latino | 0 | 0.0% |
| Native / Alaskan | 0 | 0.0% |
| White / Caucasian | 282 | 97.6% |
| Two or more Races | 7 | 2.4% |
| Some other Race | 0 | 0.0% |
| Total | 289 | 100.0% |
Ancestry in St Peter
The most populous ancestries reported in St Peter are German (139 | 48.1%), American (36 | 12.5%), Irish (21 | 7.3%), English (8 | 2.8%), and Dutch (6 | 2.1%), together accounting for 72.7% of all St Peter residents.
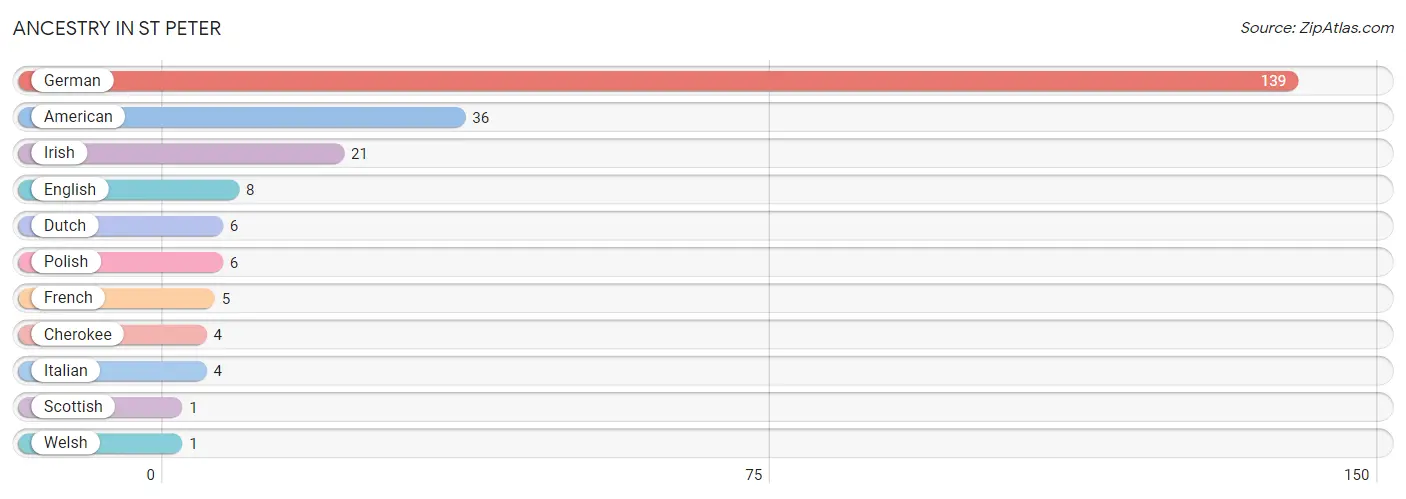
| Ancestry | # Population | % Population |
| American | 36 | 12.5% |
| Cherokee | 4 | 1.4% |
| Dutch | 6 | 2.1% |
| English | 8 | 2.8% |
| French | 5 | 1.7% |
| German | 139 | 48.1% |
| Irish | 21 | 7.3% |
| Italian | 4 | 1.4% |
| Polish | 6 | 2.1% |
| Scottish | 1 | 0.4% |
| Welsh | 1 | 0.4% | View All 11 Rows |
Immigrants in St Peter

| Immigration Origin | # Population | % Population | View All 0 Rows |
Sex and Age in St Peter
Sex and Age in St Peter
The most populous age groups in St Peter are 35 to 39 Years (16 | 11.0%) for men and 55 to 59 Years (14 | 9.8%) for women.
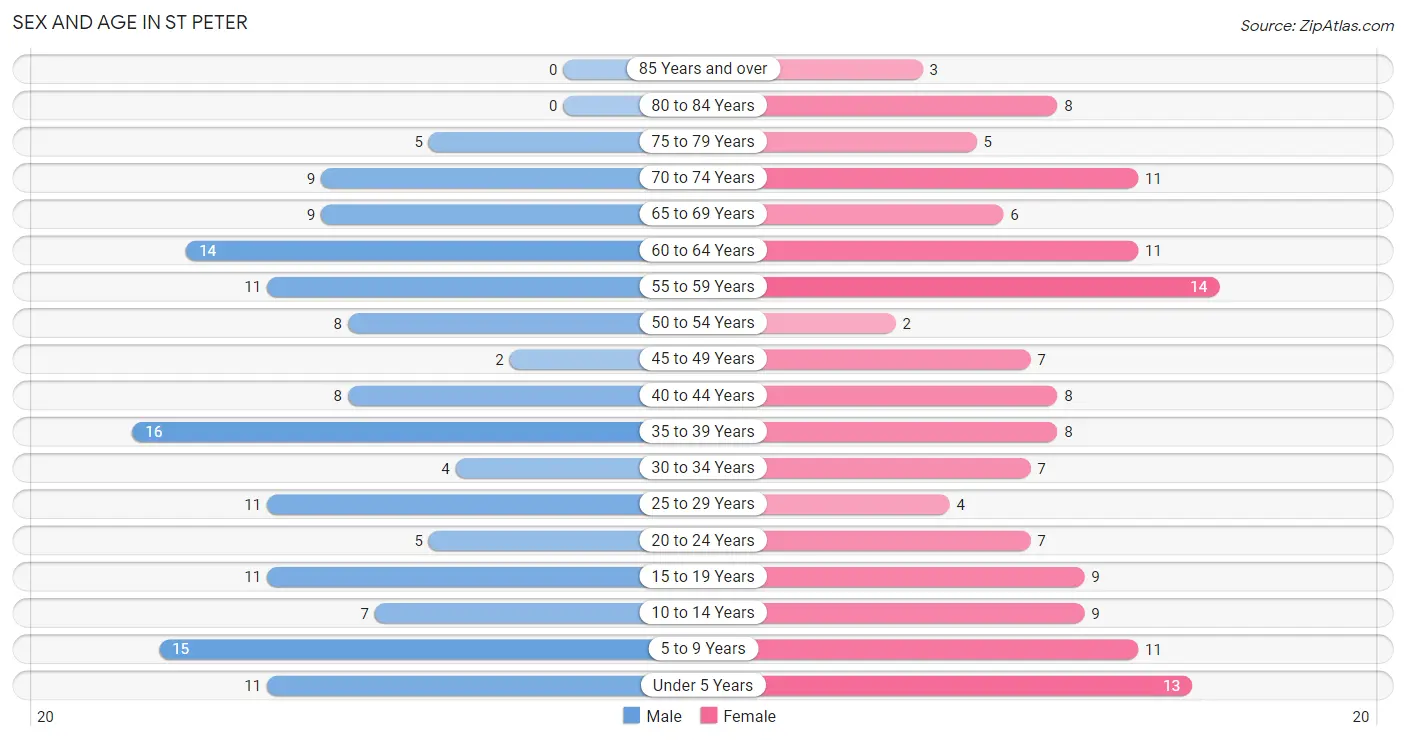
| Age Bracket | Male | Female |
| Under 5 Years | 11 (7.5%) | 13 (9.1%) |
| 5 to 9 Years | 15 (10.3%) | 11 (7.7%) |
| 10 to 14 Years | 7 (4.8%) | 9 (6.3%) |
| 15 to 19 Years | 11 (7.5%) | 9 (6.3%) |
| 20 to 24 Years | 5 (3.4%) | 7 (4.9%) |
| 25 to 29 Years | 11 (7.5%) | 4 (2.8%) |
| 30 to 34 Years | 4 (2.7%) | 7 (4.9%) |
| 35 to 39 Years | 16 (11.0%) | 8 (5.6%) |
| 40 to 44 Years | 8 (5.5%) | 8 (5.6%) |
| 45 to 49 Years | 2 (1.4%) | 7 (4.9%) |
| 50 to 54 Years | 8 (5.5%) | 2 (1.4%) |
| 55 to 59 Years | 11 (7.5%) | 14 (9.8%) |
| 60 to 64 Years | 14 (9.6%) | 11 (7.7%) |
| 65 to 69 Years | 9 (6.2%) | 6 (4.2%) |
| 70 to 74 Years | 9 (6.2%) | 11 (7.7%) |
| 75 to 79 Years | 5 (3.4%) | 5 (3.5%) |
| 80 to 84 Years | 0 (0.0%) | 8 (5.6%) |
| 85 Years and over | 0 (0.0%) | 3 (2.1%) |
| Total | 146 (100.0%) | 143 (100.0%) |
Families and Households in St Peter
Median Family Size in St Peter
The median family size in St Peter is 3.30 persons per family, with single female/mother families (12 | 16.2%) accounting for the largest median family size of 3.92 persons per family. On the other hand, single male/father families (3 | 4.1%) represent the smallest median family size with 3.00 persons per family.
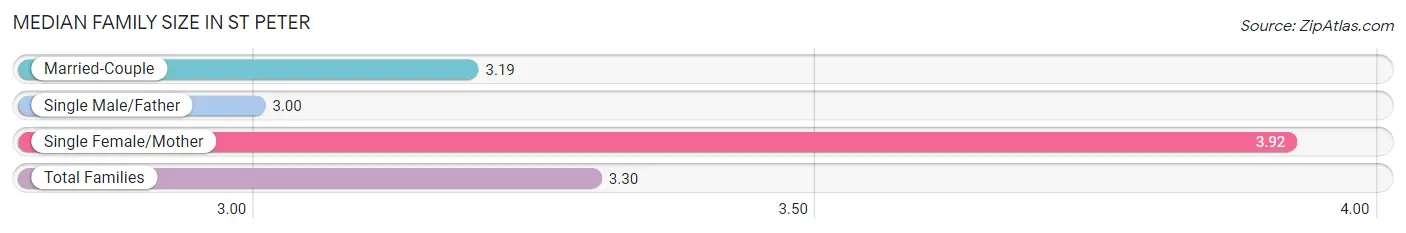
| Family Type | # Families | Family Size |
| Married-Couple | 59 (79.7%) | 3.19 |
| Single Male/Father | 3 (4.1%) | 3.00 |
| Single Female/Mother | 12 (16.2%) | 3.92 |
| Total Families | 74 (100.0%) | 3.30 |
Median Household Size in St Peter
The median household size in St Peter is 2.70 persons per household, with single female/mother households (12 | 11.2%) accounting for the largest median household size of 4.25 persons per household. non-family households (33 | 30.8%) represent the smallest median household size with 1.18 persons per household.
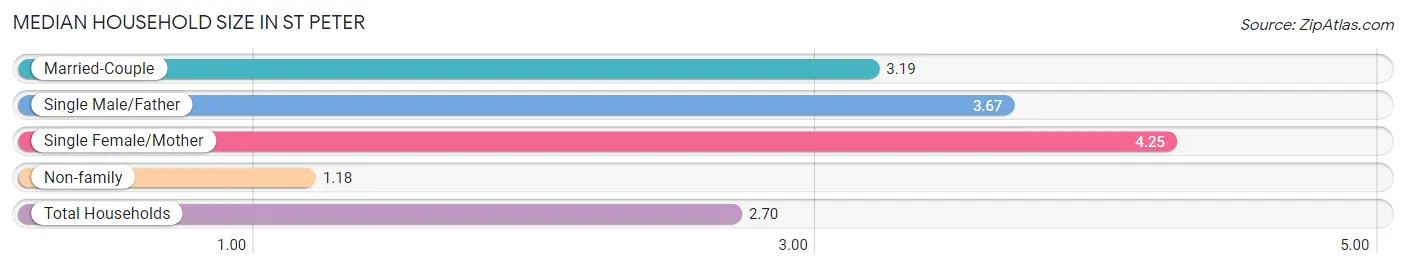
| Household Type | # Households | Household Size |
| Married-Couple | 59 (55.1%) | 3.19 |
| Single Male/Father | 3 (2.8%) | 3.67 |
| Single Female/Mother | 12 (11.2%) | 4.25 |
| Non-family | 33 (30.8%) | 1.18 |
| Total Households | 107 (100.0%) | 2.70 |
Household Size by Marriage Status in St Peter
Out of a total of 107 households in St Peter, 74 (69.2%) are family households, while 33 (30.8%) are nonfamily households. The most numerous type of family households are 2-person households, comprising 38, and the most common type of nonfamily households are 1-person households, comprising 27.
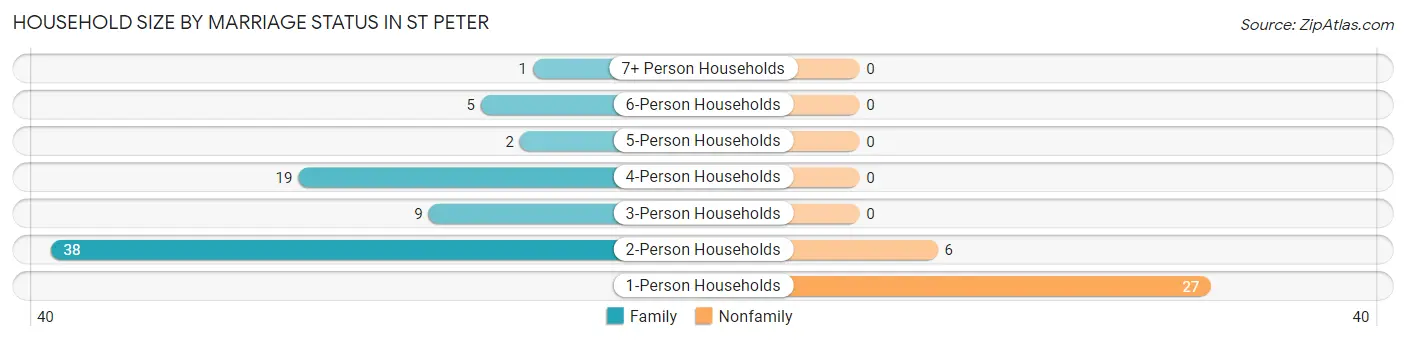
| Household Size | Family Households | Nonfamily Households |
| 1-Person Households | - | 27 (25.2%) |
| 2-Person Households | 38 (35.5%) | 6 (5.6%) |
| 3-Person Households | 9 (8.4%) | 0 (0.0%) |
| 4-Person Households | 19 (17.8%) | 0 (0.0%) |
| 5-Person Households | 2 (1.9%) | 0 (0.0%) |
| 6-Person Households | 5 (4.7%) | 0 (0.0%) |
| 7+ Person Households | 1 (0.9%) | 0 (0.0%) |
| Total | 74 (69.2%) | 33 (30.8%) |
Female Fertility in St Peter
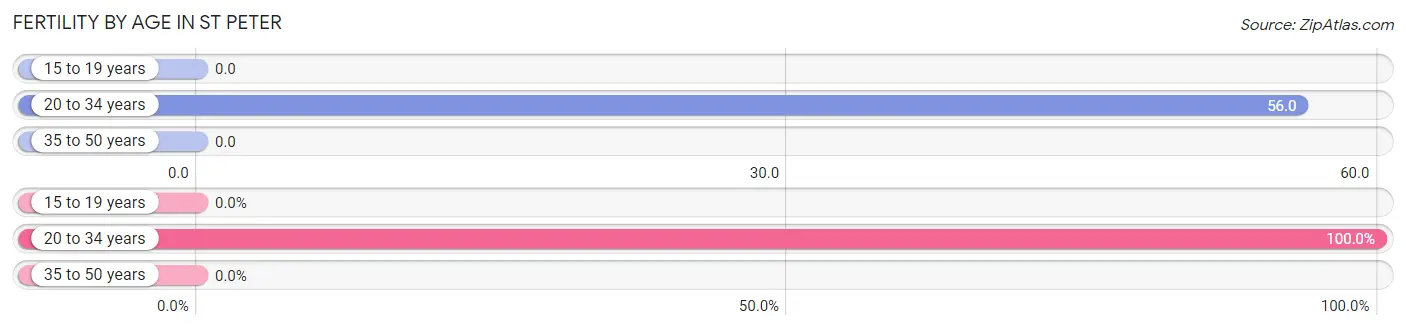
Fertility by Age in St Peter
Average fertility rate in St Peter is 19.0 births per 1,000 women. Women in the age bracket of 20 to 34 years have the highest fertility rate with 56.0 births per 1,000 women. Women in the age bracket of 20 to 34 years acount for 100.0% of all women with births.
| Age Bracket | Women with Births | Births / 1,000 Women |
| 15 to 19 years | 0 (0.0%) | 0.0 |
| 20 to 34 years | 1 (100.0%) | 56.0 |
| 35 to 50 years | 0 (0.0%) | 0.0 |
| Total | 1 (100.0%) | 19.0 |
Fertility by Age by Marriage Status in St Peter
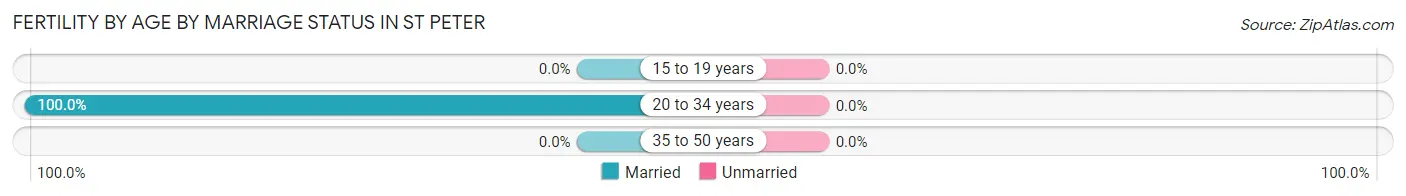
| Age Bracket | Married | Unmarried |
| 15 to 19 years | 0 (0.0%) | 0 (0.0%) |
| 20 to 34 years | 1 (100.0%) | 0 (0.0%) |
| 35 to 50 years | 0 (0.0%) | 0 (0.0%) |
| Total | 1 (100.0%) | 0 (0.0%) |
Fertility by Education in St Peter
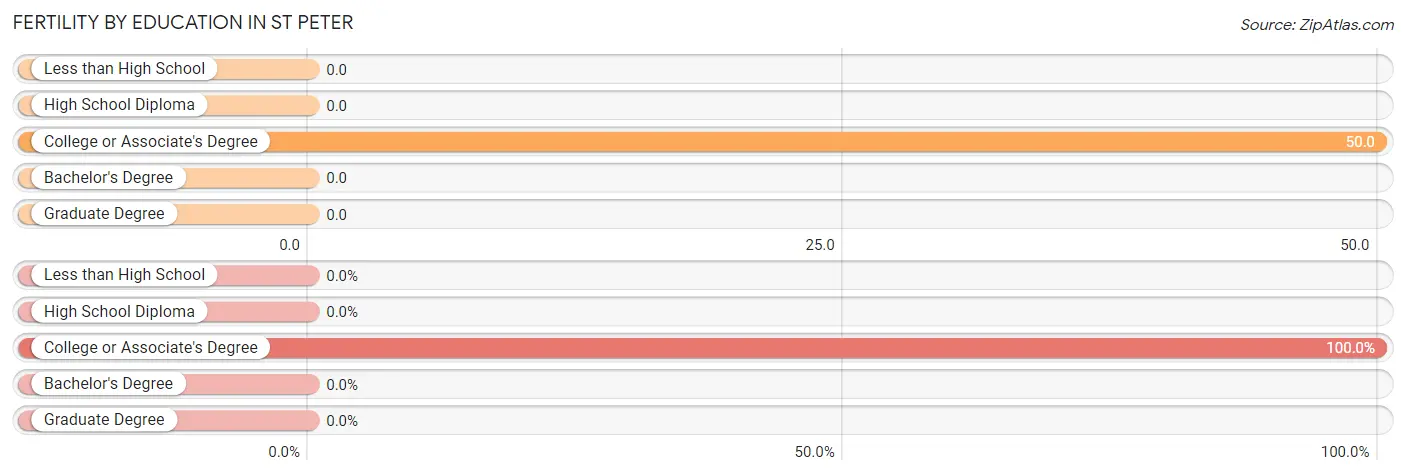
| Educational Attainment | Women with Births | Births / 1,000 Women |
| Less than High School | 0 (0.0%) | 0.0 |
| High School Diploma | 0 (0.0%) | 0.0 |
| College or Associate's Degree | 1 (100.0%) | 50.0 |
| Bachelor's Degree | 0 (0.0%) | 0.0 |
| Graduate Degree | 0 (0.0%) | 0.0 |
| Total | 1 (100.0%) | 19.0 |
Fertility by Education by Marriage Status in St Peter
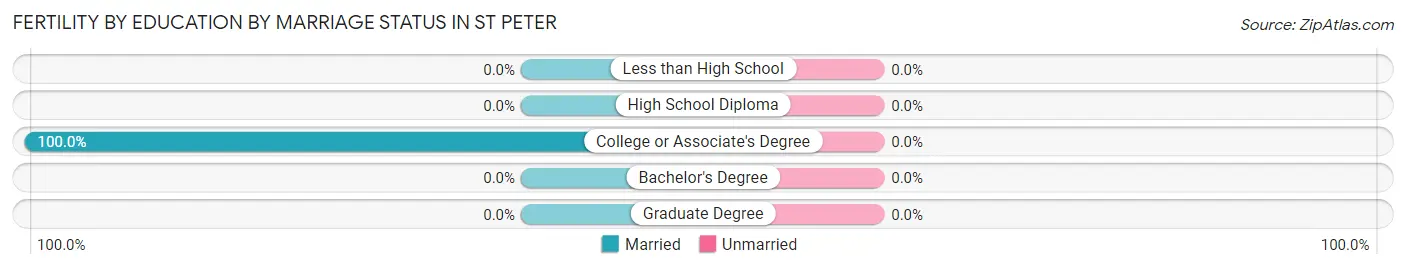
| Educational Attainment | Married | Unmarried |
| Less than High School | 0 (0.0%) | 0 (0.0%) |
| High School Diploma | 0 (0.0%) | 0 (0.0%) |
| College or Associate's Degree | 1 (100.0%) | 0 (0.0%) |
| Bachelor's Degree | 0 (0.0%) | 0 (0.0%) |
| Graduate Degree | 0 (0.0%) | 0 (0.0%) |
| Total | 1 (100.0%) | 0 (0.0%) |
Employment Characteristics in St Peter
Employment by Class of Employer in St Peter
Among the 121 employed individuals in St Peter, private company employees (81 | 66.9%), local government employees (17 | 14.1%), and self-employed (incorporated) (8 | 6.6%) make up the most common classes of employment.
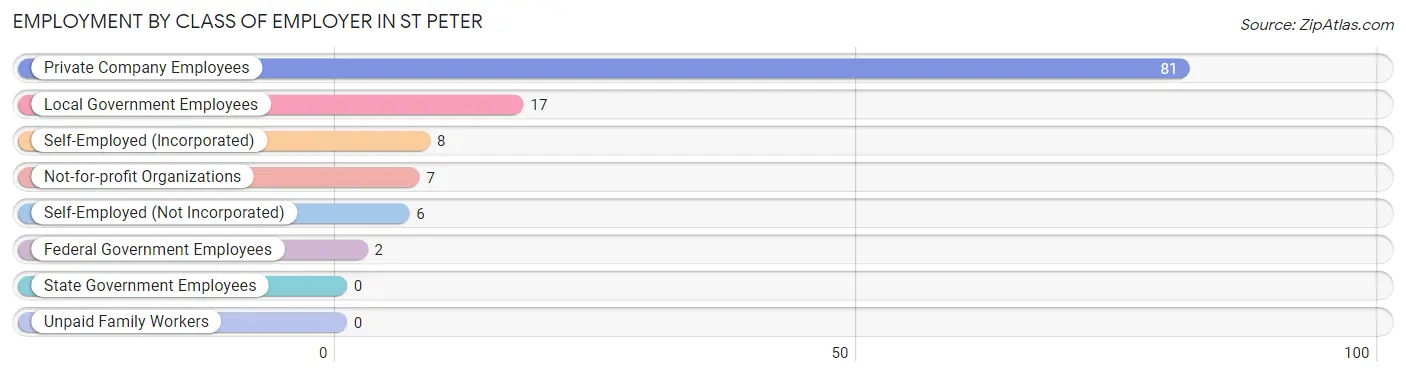
| Employer Class | # Employees | % Employees |
| Private Company Employees | 81 | 66.9% |
| Self-Employed (Incorporated) | 8 | 6.6% |
| Self-Employed (Not Incorporated) | 6 | 5.0% |
| Not-for-profit Organizations | 7 | 5.8% |
| Local Government Employees | 17 | 14.1% |
| State Government Employees | 0 | 0.0% |
| Federal Government Employees | 2 | 1.7% |
| Unpaid Family Workers | 0 | 0.0% |
| Total | 121 | 100.0% |
Employment Status by Age in St Peter
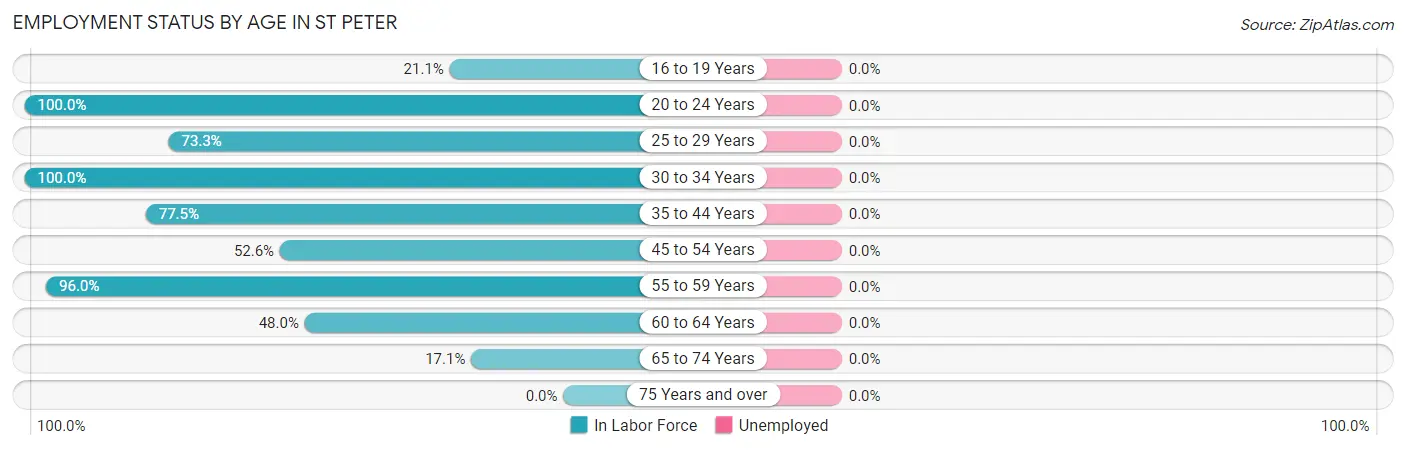
| Age Bracket | In Labor Force | Unemployed |
| 16 to 19 Years | 4 (21.1%) | 0 (0.0%) |
| 20 to 24 Years | 12 (100.0%) | 0 (0.0%) |
| 25 to 29 Years | 11 (73.3%) | 0 (0.0%) |
| 30 to 34 Years | 11 (100.0%) | 0 (0.0%) |
| 35 to 44 Years | 31 (77.5%) | 0 (0.0%) |
| 45 to 54 Years | 10 (52.6%) | 0 (0.0%) |
| 55 to 59 Years | 24 (96.0%) | 0 (0.0%) |
| 60 to 64 Years | 12 (48.0%) | 0 (0.0%) |
| 65 to 74 Years | 6 (17.1%) | 0 (0.0%) |
| 75 Years and over | 0 (0.0%) | 0 (0.0%) |
| Total | 121 (54.5%) | 0 (0.0%) |
Employment Status by Educational Attainment in St Peter
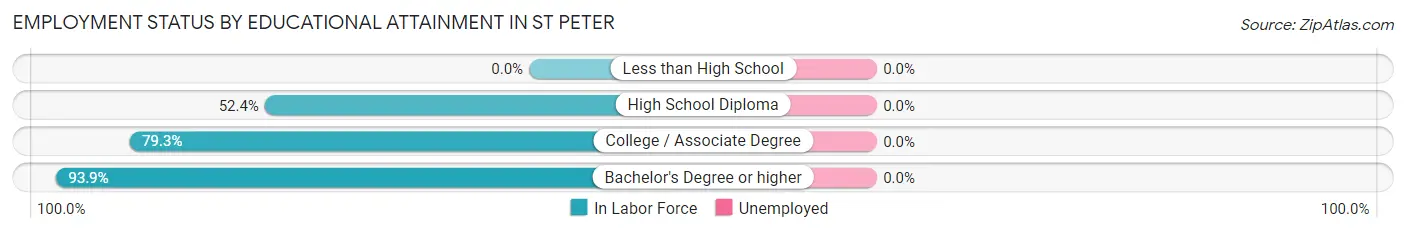
| Educational Attainment | In Labor Force | Unemployed |
| Less than High School | 0 (0.0%) | 0 (0.0%) |
| High School Diploma | 22 (52.4%) | 0 (0.0%) |
| College / Associate Degree | 46 (79.3%) | 0 (0.0%) |
| Bachelor's Degree or higher | 31 (93.9%) | 0 (0.0%) |
| Total | 99 (73.3%) | 0 (0.0%) |
Employment Occupations by Sex in St Peter
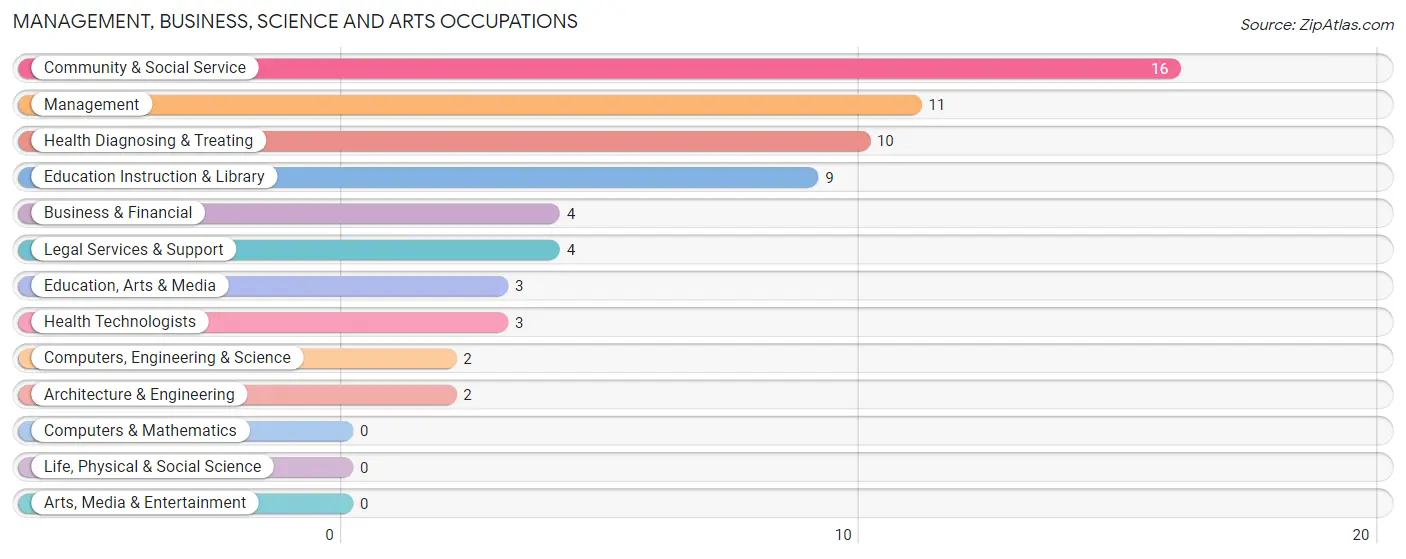
Management, Business, Science and Arts Occupations
The most common Management, Business, Science and Arts occupations in St Peter are Community & Social Service (16 | 13.2%), Management (11 | 9.1%), Health Diagnosing & Treating (10 | 8.3%), Education Instruction & Library (9 | 7.4%), and Business & Financial (4 | 3.3%).
Management, Business, Science and Arts Occupations by Sex
Within the Management, Business, Science and Arts occupations in St Peter, the most male-oriented occupations are Business & Financial (100.0%), Computers, Engineering & Science (100.0%), and Architecture & Engineering (100.0%), while the most female-oriented occupations are Health Diagnosing & Treating (100.0%), Health Technologists (100.0%), and Education Instruction & Library (77.8%).
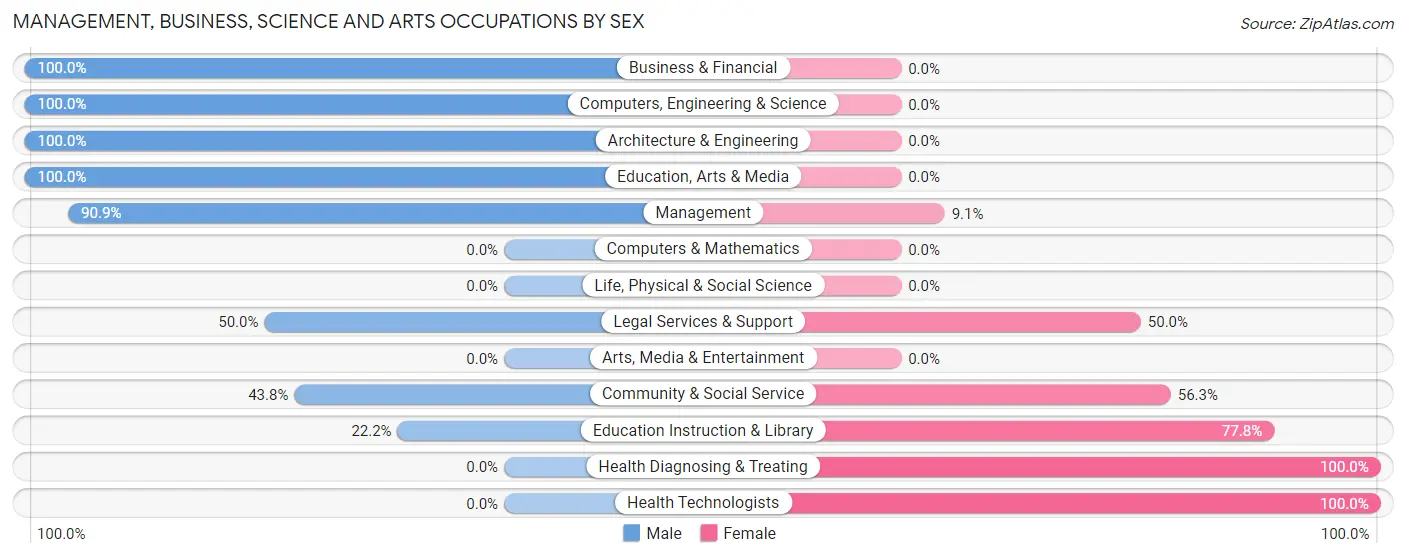
| Occupation | Male | Female |
| Management | 10 (90.9%) | 1 (9.1%) |
| Business & Financial | 4 (100.0%) | 0 (0.0%) |
| Computers, Engineering & Science | 2 (100.0%) | 0 (0.0%) |
| Computers & Mathematics | 0 (0.0%) | 0 (0.0%) |
| Architecture & Engineering | 2 (100.0%) | 0 (0.0%) |
| Life, Physical & Social Science | 0 (0.0%) | 0 (0.0%) |
| Community & Social Service | 7 (43.8%) | 9 (56.2%) |
| Education, Arts & Media | 3 (100.0%) | 0 (0.0%) |
| Legal Services & Support | 2 (50.0%) | 2 (50.0%) |
| Education Instruction & Library | 2 (22.2%) | 7 (77.8%) |
| Arts, Media & Entertainment | 0 (0.0%) | 0 (0.0%) |
| Health Diagnosing & Treating | 0 (0.0%) | 10 (100.0%) |
| Health Technologists | 0 (0.0%) | 3 (100.0%) |
| Total (Category) | 23 (53.5%) | 20 (46.5%) |
| Total (Overall) | 65 (53.7%) | 56 (46.3%) |
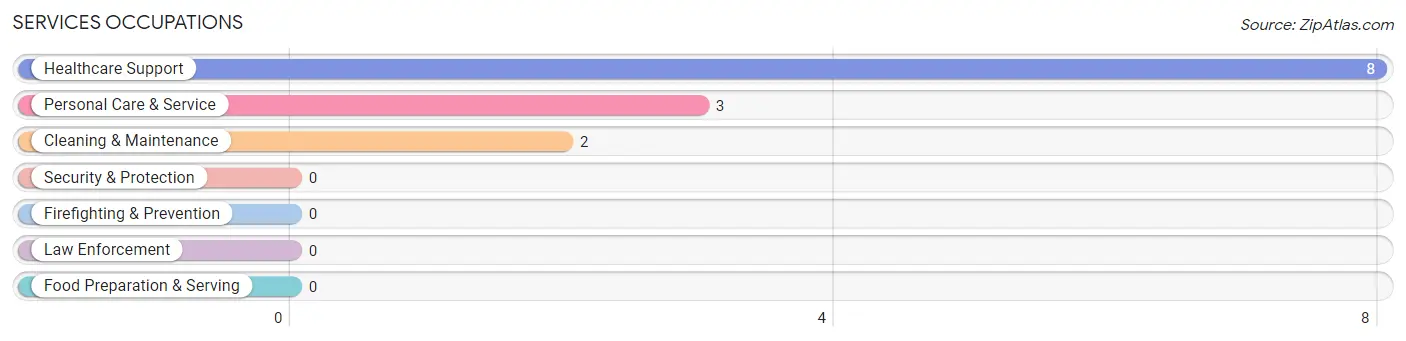
Services Occupations
The most common Services occupations in St Peter are Healthcare Support (8 | 6.6%), Personal Care & Service (3 | 2.5%), and Cleaning & Maintenance (2 | 1.7%).
Services Occupations by Sex
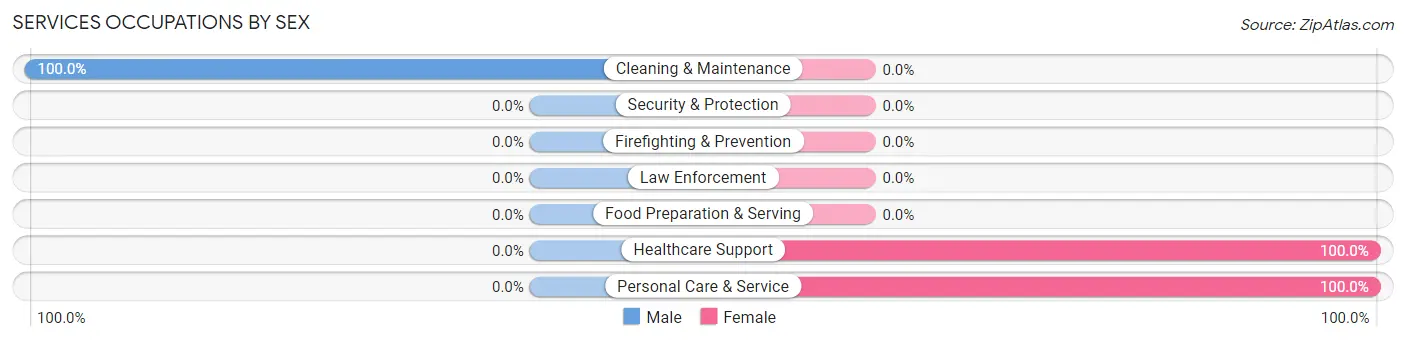
| Occupation | Male | Female |
| Healthcare Support | 0 (0.0%) | 8 (100.0%) |
| Security & Protection | 0 (0.0%) | 0 (0.0%) |
| Firefighting & Prevention | 0 (0.0%) | 0 (0.0%) |
| Law Enforcement | 0 (0.0%) | 0 (0.0%) |
| Food Preparation & Serving | 0 (0.0%) | 0 (0.0%) |
| Cleaning & Maintenance | 2 (100.0%) | 0 (0.0%) |
| Personal Care & Service | 0 (0.0%) | 3 (100.0%) |
| Total (Category) | 2 (15.4%) | 11 (84.6%) |
| Total (Overall) | 65 (53.7%) | 56 (46.3%) |
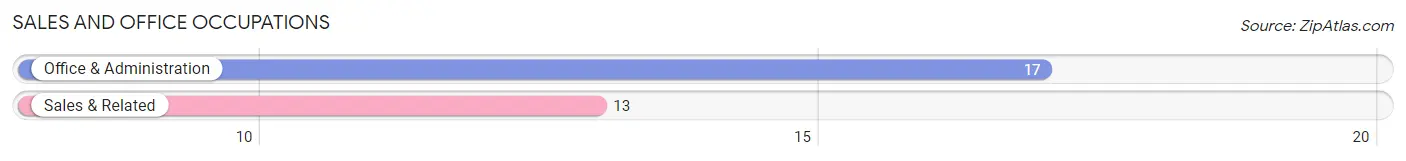
Sales and Office Occupations
The most common Sales and Office occupations in St Peter are Office & Administration (17 | 14.1%), and Sales & Related (13 | 10.7%).
Sales and Office Occupations by Sex

| Occupation | Male | Female |
| Sales & Related | 9 (69.2%) | 4 (30.8%) |
| Office & Administration | 0 (0.0%) | 17 (100.0%) |
| Total (Category) | 9 (30.0%) | 21 (70.0%) |
| Total (Overall) | 65 (53.7%) | 56 (46.3%) |
Natural Resources, Construction and Maintenance Occupations
The most common Natural Resources, Construction and Maintenance occupations in St Peter are Farming, Fishing & Forestry (6 | 5.0%), Installation, Maintenance & Repair (5 | 4.1%), and Construction & Extraction (4 | 3.3%).
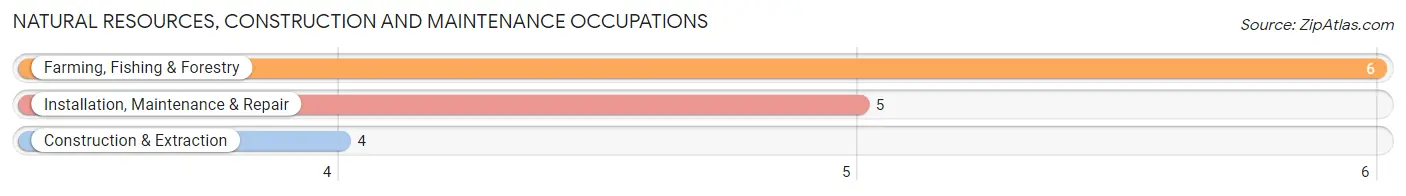
Natural Resources, Construction and Maintenance Occupations by Sex

| Occupation | Male | Female |
| Farming, Fishing & Forestry | 5 (83.3%) | 1 (16.7%) |
| Construction & Extraction | 4 (100.0%) | 0 (0.0%) |
| Installation, Maintenance & Repair | 5 (100.0%) | 0 (0.0%) |
| Total (Category) | 14 (93.3%) | 1 (6.7%) |
| Total (Overall) | 65 (53.7%) | 56 (46.3%) |
Production, Transportation and Moving Occupations
The most common Production, Transportation and Moving occupations in St Peter are Transportation (10 | 8.3%), Production (6 | 5.0%), and Material Moving (4 | 3.3%).
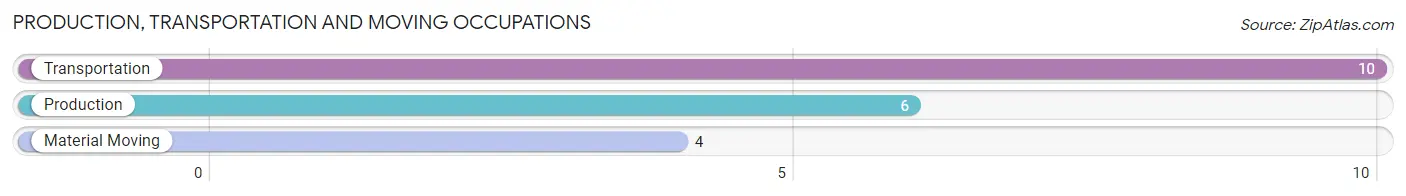
Production, Transportation and Moving Occupations by Sex
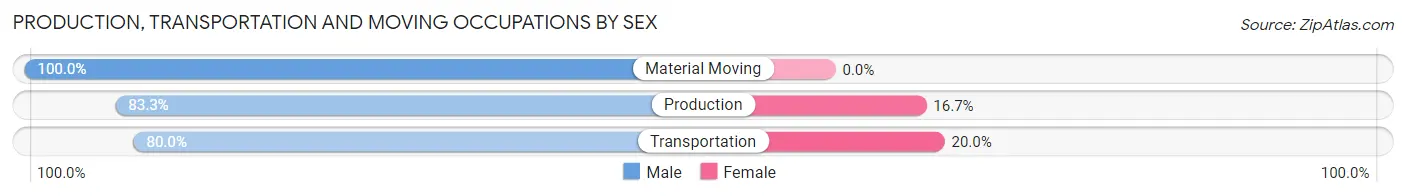
| Occupation | Male | Female |
| Production | 5 (83.3%) | 1 (16.7%) |
| Transportation | 8 (80.0%) | 2 (20.0%) |
| Material Moving | 4 (100.0%) | 0 (0.0%) |
| Total (Category) | 17 (85.0%) | 3 (15.0%) |
| Total (Overall) | 65 (53.7%) | 56 (46.3%) |
Employment Industries by Sex in St Peter
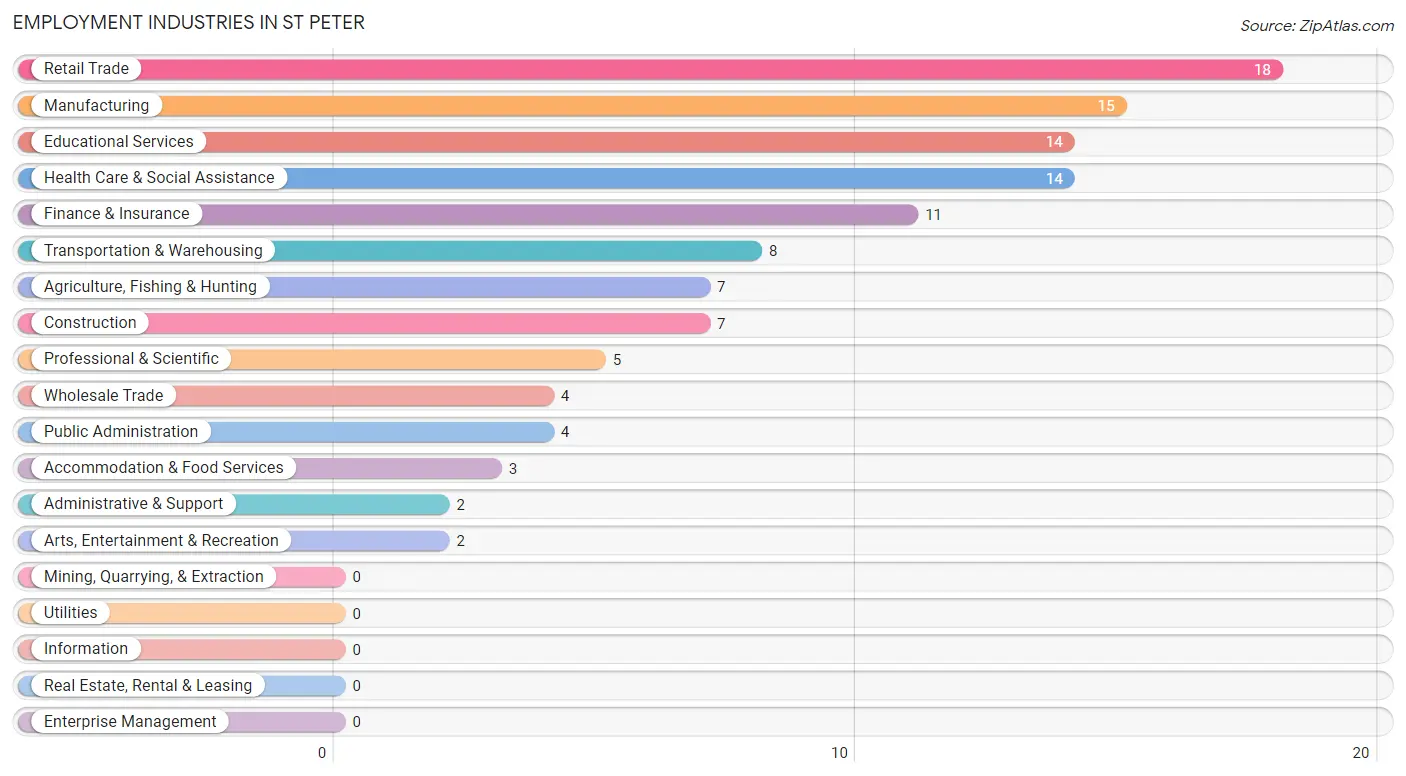
Employment Industries in St Peter
The major employment industries in St Peter include Retail Trade (18 | 14.9%), Manufacturing (15 | 12.4%), Educational Services (14 | 11.6%), Health Care & Social Assistance (14 | 11.6%), and Finance & Insurance (11 | 9.1%).
Employment Industries by Sex in St Peter
The St Peter industries that see more men than women are Wholesale Trade (100.0%), Transportation & Warehousing (100.0%), and Administrative & Support (100.0%), whereas the industries that tend to have a higher number of women are Health Care & Social Assistance (100.0%), Arts, Entertainment & Recreation (100.0%), and Educational Services (85.7%).
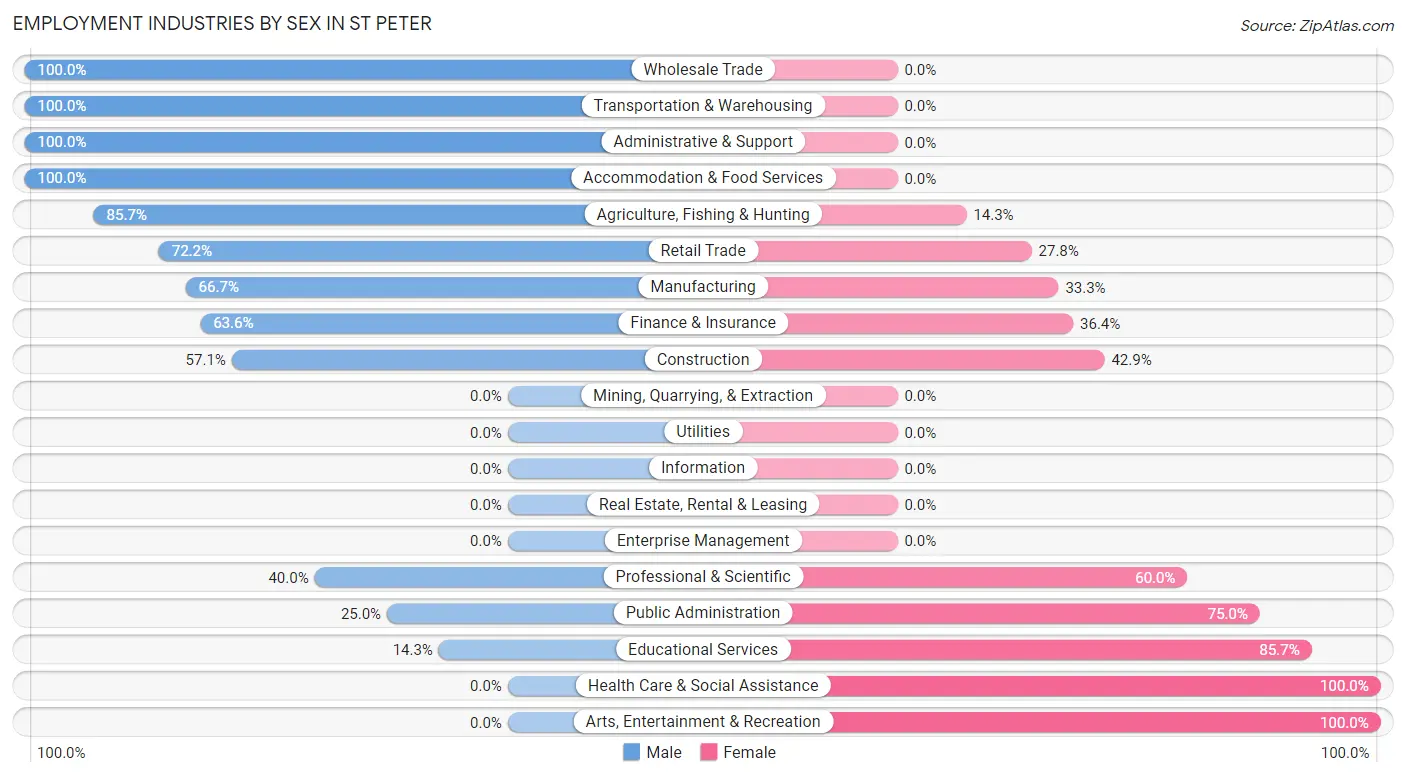
| Industry | Male | Female |
| Agriculture, Fishing & Hunting | 6 (85.7%) | 1 (14.3%) |
| Mining, Quarrying, & Extraction | 0 (0.0%) | 0 (0.0%) |
| Construction | 4 (57.1%) | 3 (42.9%) |
| Manufacturing | 10 (66.7%) | 5 (33.3%) |
| Wholesale Trade | 4 (100.0%) | 0 (0.0%) |
| Retail Trade | 13 (72.2%) | 5 (27.8%) |
| Transportation & Warehousing | 8 (100.0%) | 0 (0.0%) |
| Utilities | 0 (0.0%) | 0 (0.0%) |
| Information | 0 (0.0%) | 0 (0.0%) |
| Finance & Insurance | 7 (63.6%) | 4 (36.4%) |
| Real Estate, Rental & Leasing | 0 (0.0%) | 0 (0.0%) |
| Professional & Scientific | 2 (40.0%) | 3 (60.0%) |
| Enterprise Management | 0 (0.0%) | 0 (0.0%) |
| Administrative & Support | 2 (100.0%) | 0 (0.0%) |
| Educational Services | 2 (14.3%) | 12 (85.7%) |
| Health Care & Social Assistance | 0 (0.0%) | 14 (100.0%) |
| Arts, Entertainment & Recreation | 0 (0.0%) | 2 (100.0%) |
| Accommodation & Food Services | 3 (100.0%) | 0 (0.0%) |
| Public Administration | 1 (25.0%) | 3 (75.0%) |
| Total | 65 (53.7%) | 56 (46.3%) |
Education in St Peter
School Enrollment in St Peter
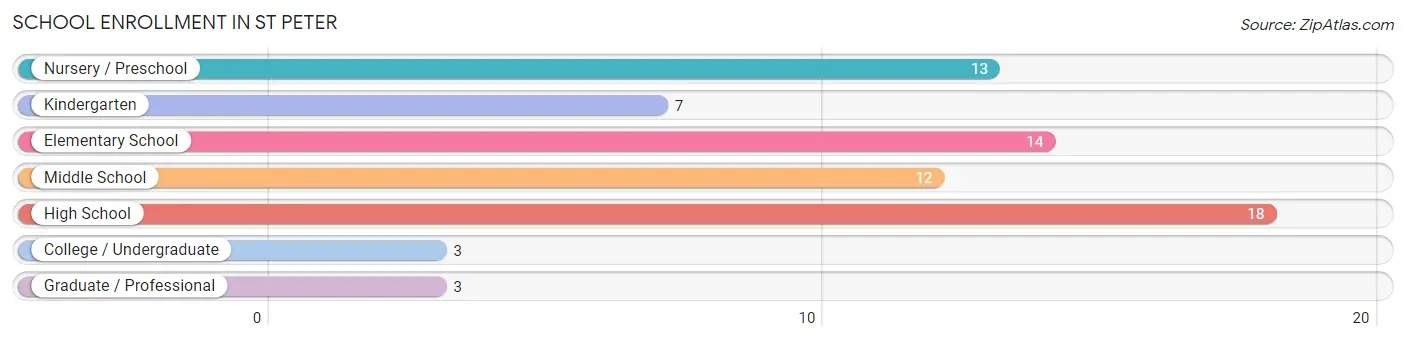
The most common levels of schooling among the 70 students in St Peter are high school (18 | 25.7%), elementary school (14 | 20.0%), and nursery / preschool (13 | 18.6%).
| School Level | # Students | % Students |
| Nursery / Preschool | 13 | 18.6% |
| Kindergarten | 7 | 10.0% |
| Elementary School | 14 | 20.0% |
| Middle School | 12 | 17.1% |
| High School | 18 | 25.7% |
| College / Undergraduate | 3 | 4.3% |
| Graduate / Professional | 3 | 4.3% |
| Total | 70 | 100.0% |
School Enrollment by Age by Funding Source in St Peter
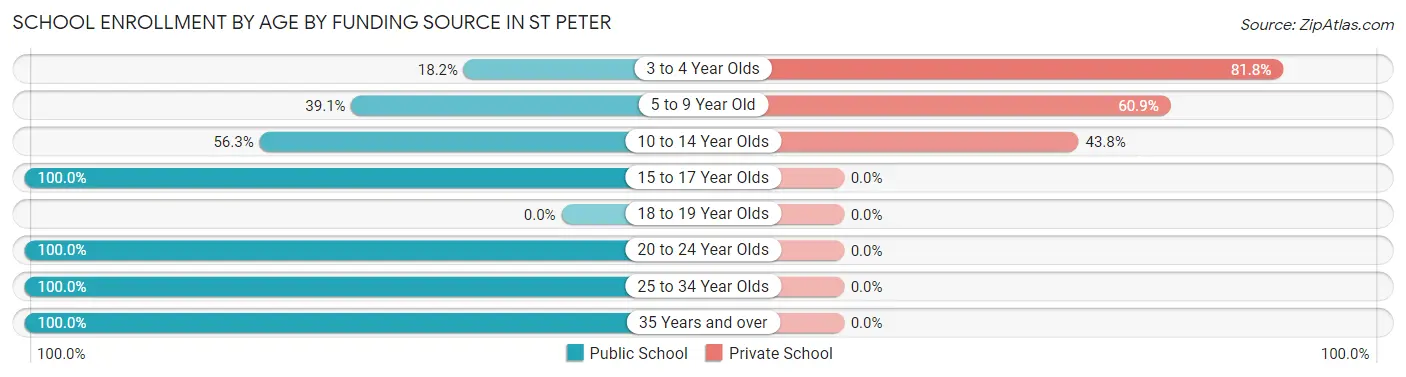
Out of a total of 70 students who are enrolled in schools in St Peter, 30 (42.9%) attend a private institution, while the remaining 40 (57.1%) are enrolled in public schools. The age group of 3 to 4 year olds has the highest likelihood of being enrolled in private schools, with 9 (81.8% in the age bracket) enrolled. Conversely, the age group of 15 to 17 year olds has the lowest likelihood of being enrolled in a private school, with 14 (100.0% in the age bracket) attending a public institution.
| Age Bracket | Public School | Private School |
| 3 to 4 Year Olds | 2 (18.2%) | 9 (81.8%) |
| 5 to 9 Year Old | 9 (39.1%) | 14 (60.9%) |
| 10 to 14 Year Olds | 9 (56.2%) | 7 (43.8%) |
| 15 to 17 Year Olds | 14 (100.0%) | 0 (0.0%) |
| 18 to 19 Year Olds | 0 (0.0%) | 0 (0.0%) |
| 20 to 24 Year Olds | 1 (100.0%) | 0 (0.0%) |
| 25 to 34 Year Olds | 1 (100.0%) | 0 (0.0%) |
| 35 Years and over | 4 (100.0%) | 0 (0.0%) |
| Total | 40 (57.1%) | 30 (42.9%) |
Educational Attainment by Field of Study in St Peter
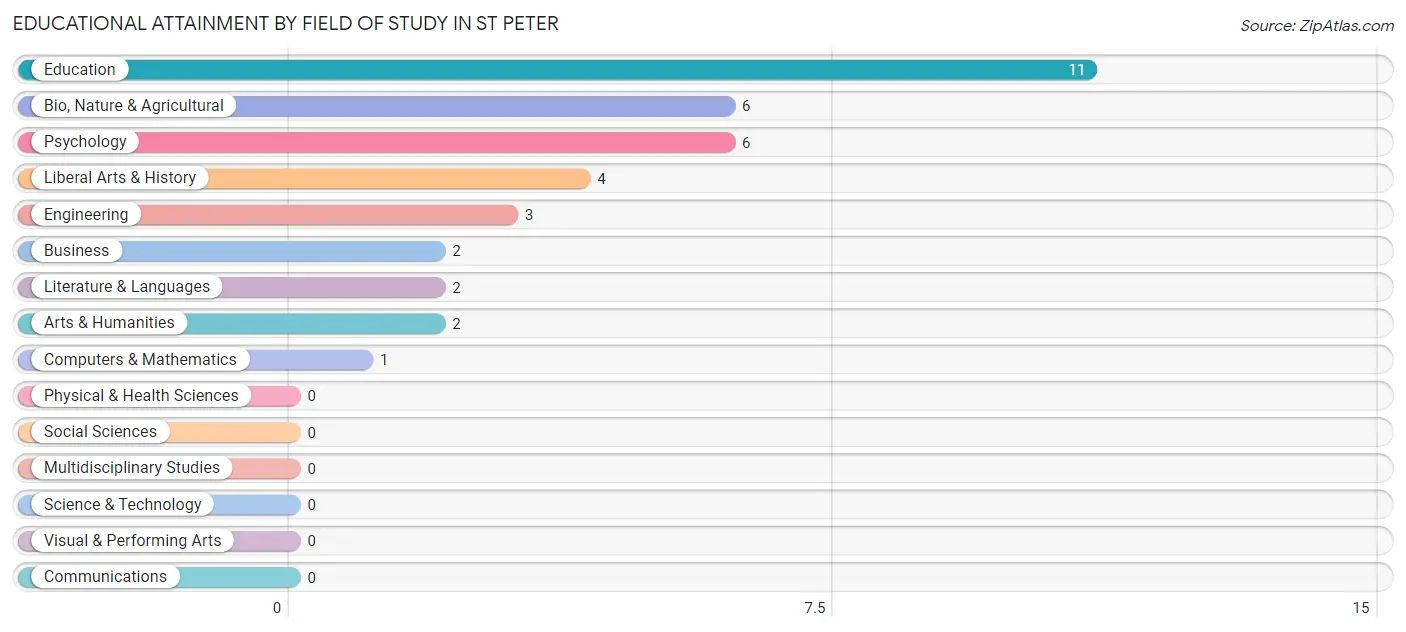
Education (11 | 29.7%), bio, nature & agricultural (6 | 16.2%), psychology (6 | 16.2%), liberal arts & history (4 | 10.8%), and engineering (3 | 8.1%) are the most common fields of study among 37 individuals in St Peter who have obtained a bachelor's degree or higher.
| Field of Study | # Graduates | % Graduates |
| Computers & Mathematics | 1 | 2.7% |
| Bio, Nature & Agricultural | 6 | 16.2% |
| Physical & Health Sciences | 0 | 0.0% |
| Psychology | 6 | 16.2% |
| Social Sciences | 0 | 0.0% |
| Engineering | 3 | 8.1% |
| Multidisciplinary Studies | 0 | 0.0% |
| Science & Technology | 0 | 0.0% |
| Business | 2 | 5.4% |
| Education | 11 | 29.7% |
| Literature & Languages | 2 | 5.4% |
| Liberal Arts & History | 4 | 10.8% |
| Visual & Performing Arts | 0 | 0.0% |
| Communications | 0 | 0.0% |
| Arts & Humanities | 2 | 5.4% |
| Total | 37 | 100.0% |
Transportation & Commute in St Peter
Vehicle Availability by Sex in St Peter
The most prevalent vehicle ownership categories in St Peter are males with 2 vehicles (24, accounting for 36.9%) and females with 2 vehicles (24, making up 42.9%).
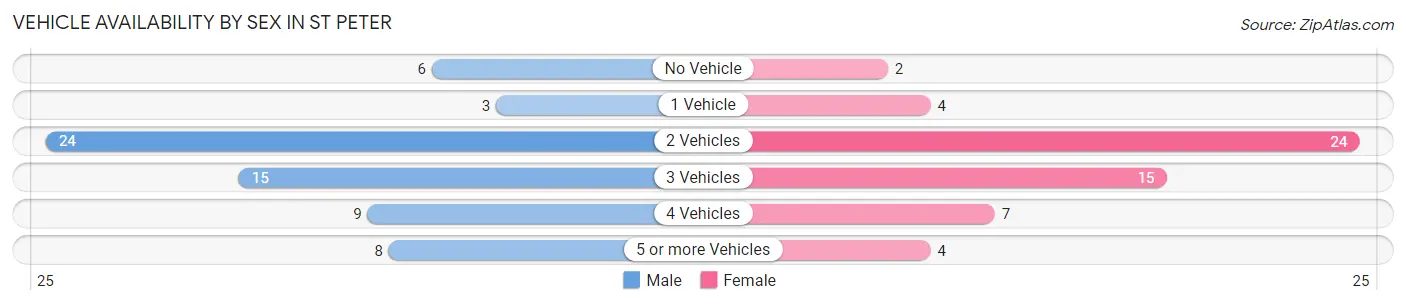
| Vehicles Available | Male | Female |
| No Vehicle | 6 (9.2%) | 2 (3.6%) |
| 1 Vehicle | 3 (4.6%) | 4 (7.1%) |
| 2 Vehicles | 24 (36.9%) | 24 (42.9%) |
| 3 Vehicles | 15 (23.1%) | 15 (26.8%) |
| 4 Vehicles | 9 (13.9%) | 7 (12.5%) |
| 5 or more Vehicles | 8 (12.3%) | 4 (7.1%) |
| Total | 65 (100.0%) | 56 (100.0%) |
Commute Time in St Peter
The most frequently occuring commute durations in St Peter are less than 5 minutes (24 commuters, 20.0%), 5 to 9 minutes (20 commuters, 16.7%), and 30 to 34 minutes (19 commuters, 15.8%).
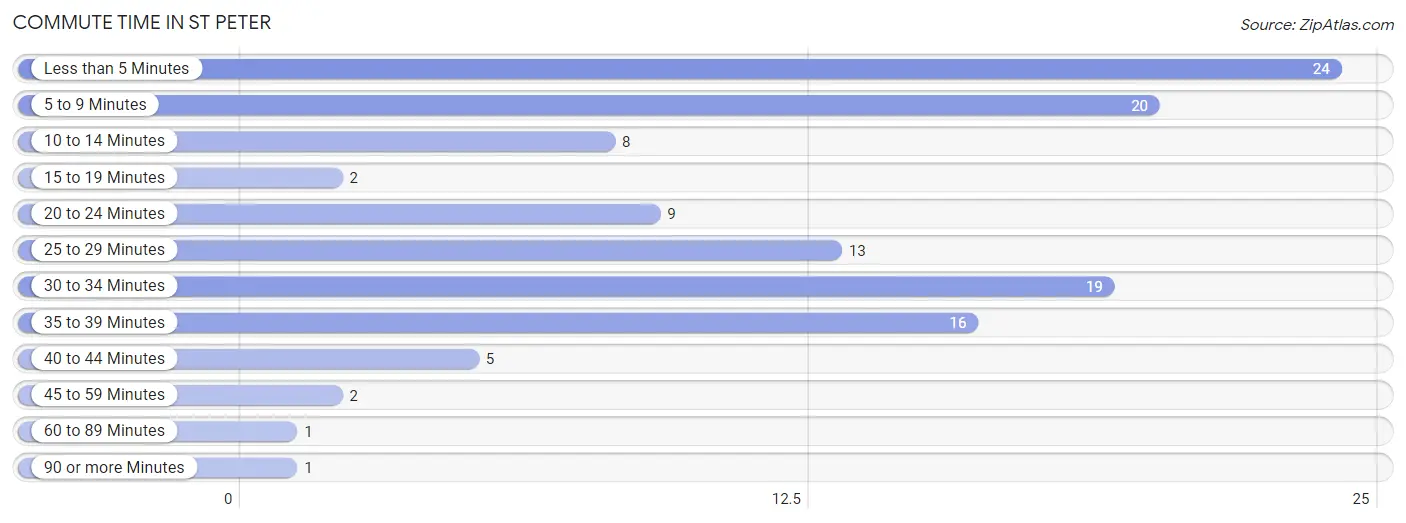
| Commute Time | # Commuters | % Commuters |
| Less than 5 Minutes | 24 | 20.0% |
| 5 to 9 Minutes | 20 | 16.7% |
| 10 to 14 Minutes | 8 | 6.7% |
| 15 to 19 Minutes | 2 | 1.7% |
| 20 to 24 Minutes | 9 | 7.5% |
| 25 to 29 Minutes | 13 | 10.8% |
| 30 to 34 Minutes | 19 | 15.8% |
| 35 to 39 Minutes | 16 | 13.3% |
| 40 to 44 Minutes | 5 | 4.2% |
| 45 to 59 Minutes | 2 | 1.7% |
| 60 to 89 Minutes | 1 | 0.8% |
| 90 or more Minutes | 1 | 0.8% |
Commute Time by Sex in St Peter
The most common commute times in St Peter are 5 to 9 minutes (19 commuters, 29.7%) for males and less than 5 minutes (13 commuters, 23.2%) for females.
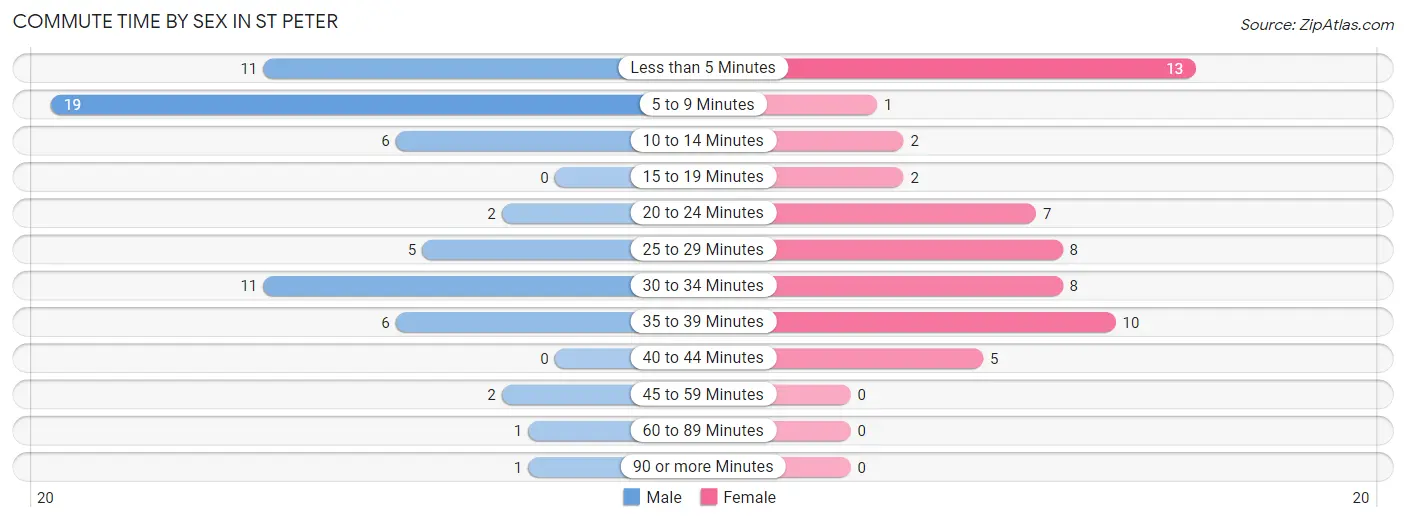
| Commute Time | Male | Female |
| Less than 5 Minutes | 11 (17.2%) | 13 (23.2%) |
| 5 to 9 Minutes | 19 (29.7%) | 1 (1.8%) |
| 10 to 14 Minutes | 6 (9.4%) | 2 (3.6%) |
| 15 to 19 Minutes | 0 (0.0%) | 2 (3.6%) |
| 20 to 24 Minutes | 2 (3.1%) | 7 (12.5%) |
| 25 to 29 Minutes | 5 (7.8%) | 8 (14.3%) |
| 30 to 34 Minutes | 11 (17.2%) | 8 (14.3%) |
| 35 to 39 Minutes | 6 (9.4%) | 10 (17.9%) |
| 40 to 44 Minutes | 0 (0.0%) | 5 (8.9%) |
| 45 to 59 Minutes | 2 (3.1%) | 0 (0.0%) |
| 60 to 89 Minutes | 1 (1.6%) | 0 (0.0%) |
| 90 or more Minutes | 1 (1.6%) | 0 (0.0%) |
Time of Departure to Work by Sex in St Peter
The most frequent times of departure to work in St Peter are 7:30 AM to 7:59 AM (18, 28.1%) for males and 7:30 AM to 7:59 AM (20, 35.7%) for females.
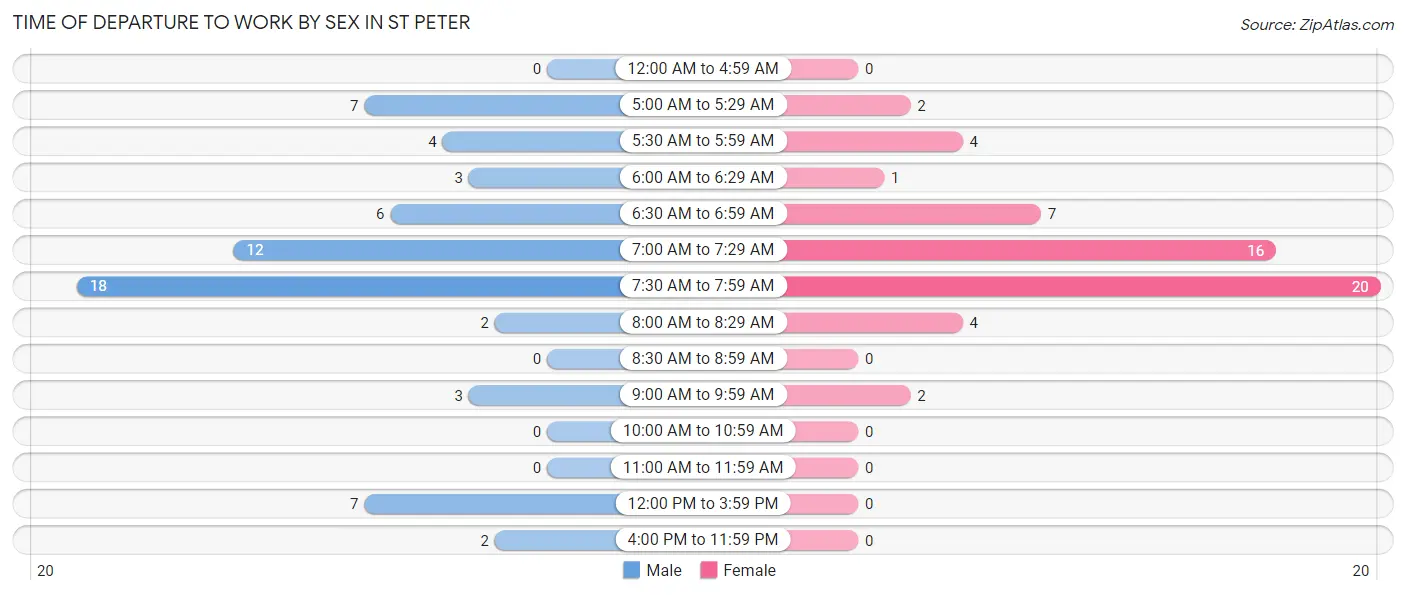
| Time of Departure | Male | Female |
| 12:00 AM to 4:59 AM | 0 (0.0%) | 0 (0.0%) |
| 5:00 AM to 5:29 AM | 7 (10.9%) | 2 (3.6%) |
| 5:30 AM to 5:59 AM | 4 (6.2%) | 4 (7.1%) |
| 6:00 AM to 6:29 AM | 3 (4.7%) | 1 (1.8%) |
| 6:30 AM to 6:59 AM | 6 (9.4%) | 7 (12.5%) |
| 7:00 AM to 7:29 AM | 12 (18.8%) | 16 (28.6%) |
| 7:30 AM to 7:59 AM | 18 (28.1%) | 20 (35.7%) |
| 8:00 AM to 8:29 AM | 2 (3.1%) | 4 (7.1%) |
| 8:30 AM to 8:59 AM | 0 (0.0%) | 0 (0.0%) |
| 9:00 AM to 9:59 AM | 3 (4.7%) | 2 (3.6%) |
| 10:00 AM to 10:59 AM | 0 (0.0%) | 0 (0.0%) |
| 11:00 AM to 11:59 AM | 0 (0.0%) | 0 (0.0%) |
| 12:00 PM to 3:59 PM | 7 (10.9%) | 0 (0.0%) |
| 4:00 PM to 11:59 PM | 2 (3.1%) | 0 (0.0%) |
| Total | 64 (100.0%) | 56 (100.0%) |
Housing Occupancy in St Peter
Occupancy by Ownership in St Peter
Of the total 107 dwellings in St Peter, owner-occupied units account for 97 (90.6%), while renter-occupied units make up 10 (9.3%).
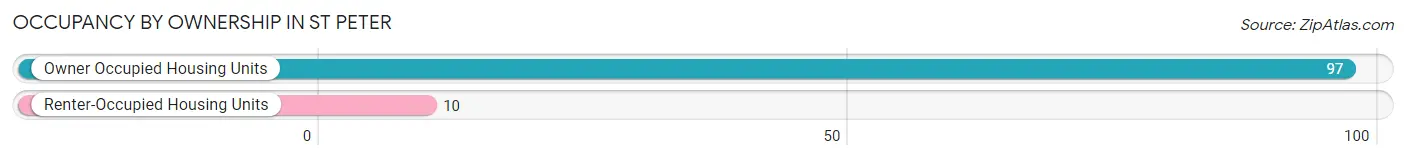
| Occupancy | # Housing Units | % Housing Units |
| Owner Occupied Housing Units | 97 | 90.6% |
| Renter-Occupied Housing Units | 10 | 9.3% |
| Total Occupied Housing Units | 107 | 100.0% |
Occupancy by Household Size in St Peter
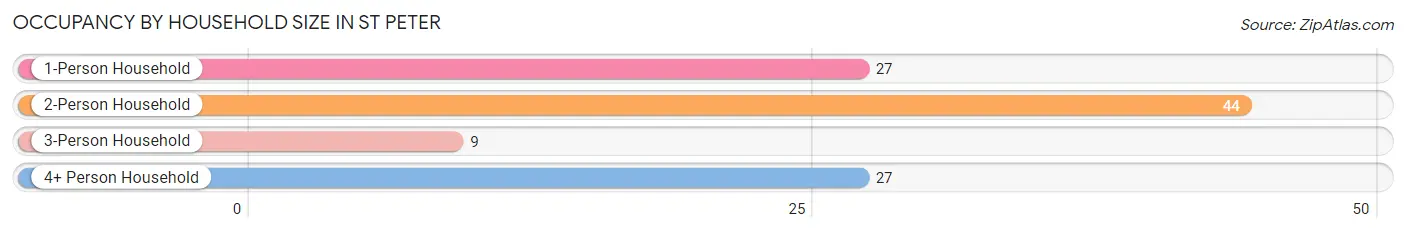
| Household Size | # Housing Units | % Housing Units |
| 1-Person Household | 27 | 25.2% |
| 2-Person Household | 44 | 41.1% |
| 3-Person Household | 9 | 8.4% |
| 4+ Person Household | 27 | 25.2% |
| Total Housing Units | 107 | 100.0% |
Occupancy by Ownership by Household Size in St Peter
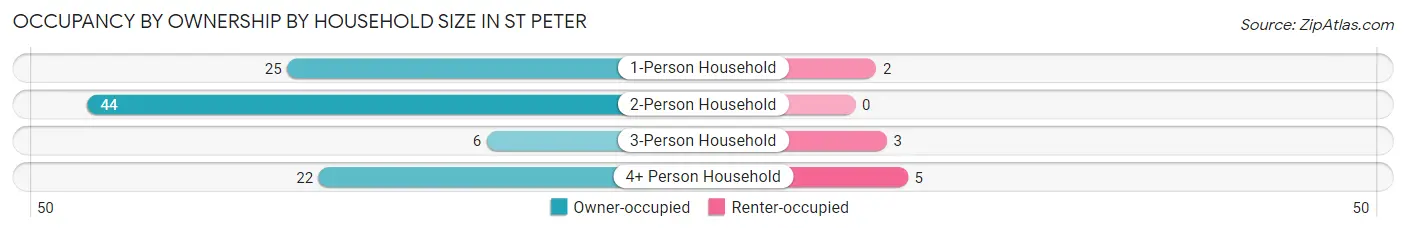
| Household Size | Owner-occupied | Renter-occupied |
| 1-Person Household | 25 (92.6%) | 2 (7.4%) |
| 2-Person Household | 44 (100.0%) | 0 (0.0%) |
| 3-Person Household | 6 (66.7%) | 3 (33.3%) |
| 4+ Person Household | 22 (81.5%) | 5 (18.5%) |
| Total Housing Units | 97 (90.6%) | 10 (9.3%) |
Occupancy by Educational Attainment in St Peter
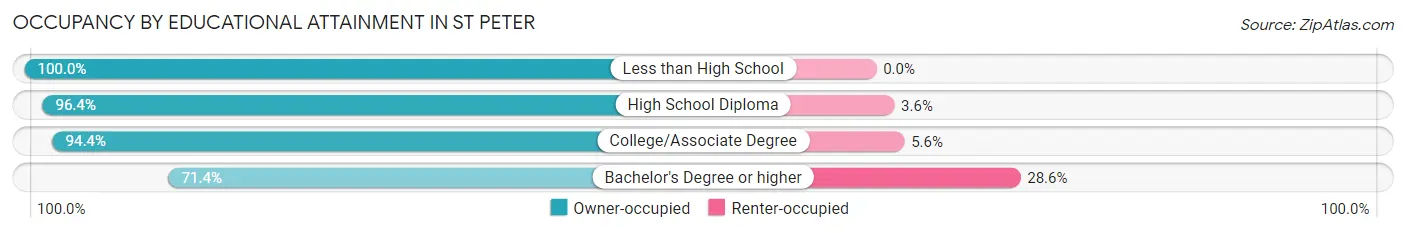
| Household Size | Owner-occupied | Renter-occupied |
| Less than High School | 4 (100.0%) | 0 (0.0%) |
| High School Diploma | 27 (96.4%) | 1 (3.6%) |
| College/Associate Degree | 51 (94.4%) | 3 (5.6%) |
| Bachelor's Degree or higher | 15 (71.4%) | 6 (28.6%) |
Occupancy by Age of Householder in St Peter
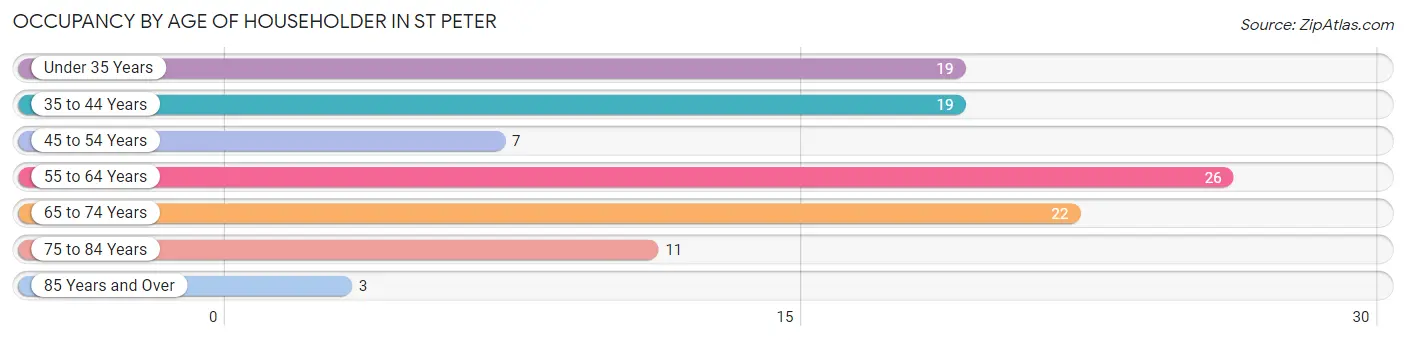
| Age Bracket | # Households | % Households |
| Under 35 Years | 19 | 17.8% |
| 35 to 44 Years | 19 | 17.8% |
| 45 to 54 Years | 7 | 6.5% |
| 55 to 64 Years | 26 | 24.3% |
| 65 to 74 Years | 22 | 20.6% |
| 75 to 84 Years | 11 | 10.3% |
| 85 Years and Over | 3 | 2.8% |
| Total | 107 | 100.0% |
Housing Finances in St Peter
Median Income by Occupancy in St Peter
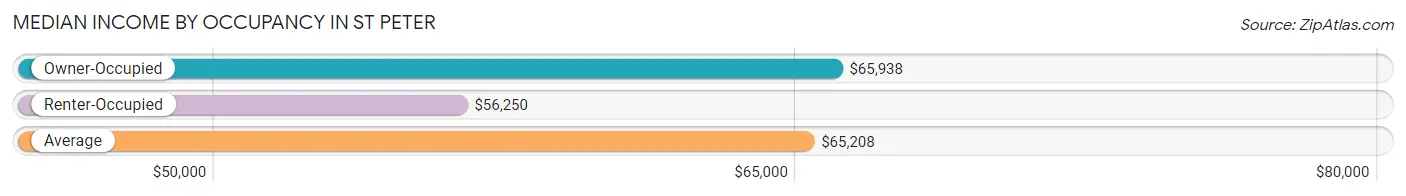
| Occupancy Type | # Households | Median Income |
| Owner-Occupied | 97 (90.6%) | $65,938 |
| Renter-Occupied | 10 (9.3%) | $56,250 |
| Average | 107 (100.0%) | $65,208 |
Occupancy by Householder Income Bracket in St Peter
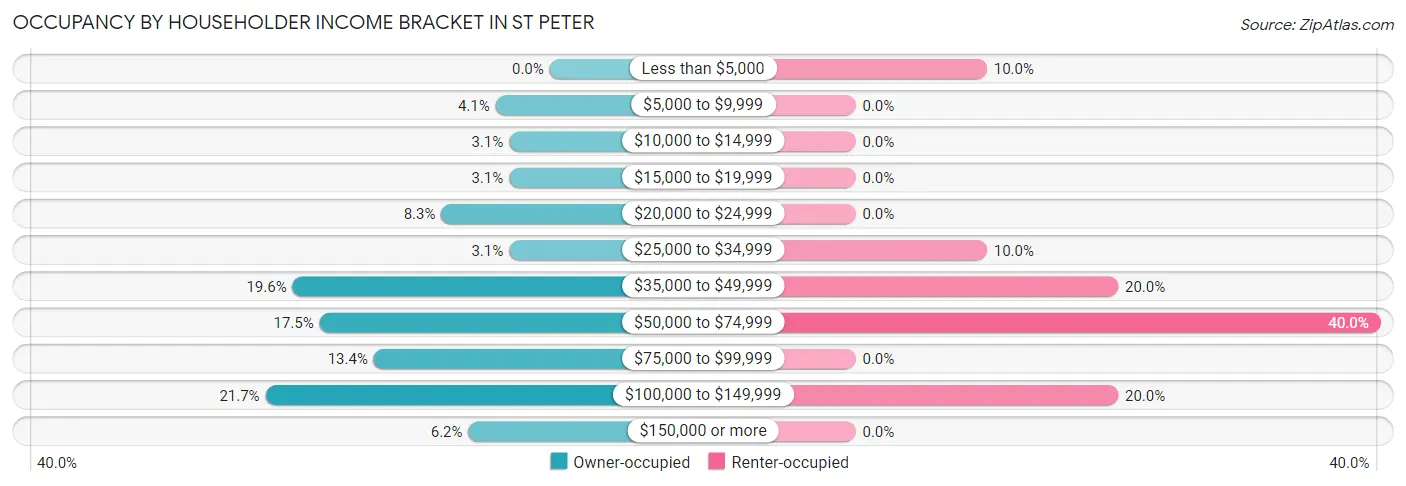
| Income Bracket | Owner-occupied | Renter-occupied |
| Less than $5,000 | 0 (0.0%) | 1 (10.0%) |
| $5,000 to $9,999 | 4 (4.1%) | 0 (0.0%) |
| $10,000 to $14,999 | 3 (3.1%) | 0 (0.0%) |
| $15,000 to $19,999 | 3 (3.1%) | 0 (0.0%) |
| $20,000 to $24,999 | 8 (8.3%) | 0 (0.0%) |
| $25,000 to $34,999 | 3 (3.1%) | 1 (10.0%) |
| $35,000 to $49,999 | 19 (19.6%) | 2 (20.0%) |
| $50,000 to $74,999 | 17 (17.5%) | 4 (40.0%) |
| $75,000 to $99,999 | 13 (13.4%) | 0 (0.0%) |
| $100,000 to $149,999 | 21 (21.6%) | 2 (20.0%) |
| $150,000 or more | 6 (6.2%) | 0 (0.0%) |
| Total | 97 (100.0%) | 10 (100.0%) |
Monthly Housing Cost Tiers in St Peter
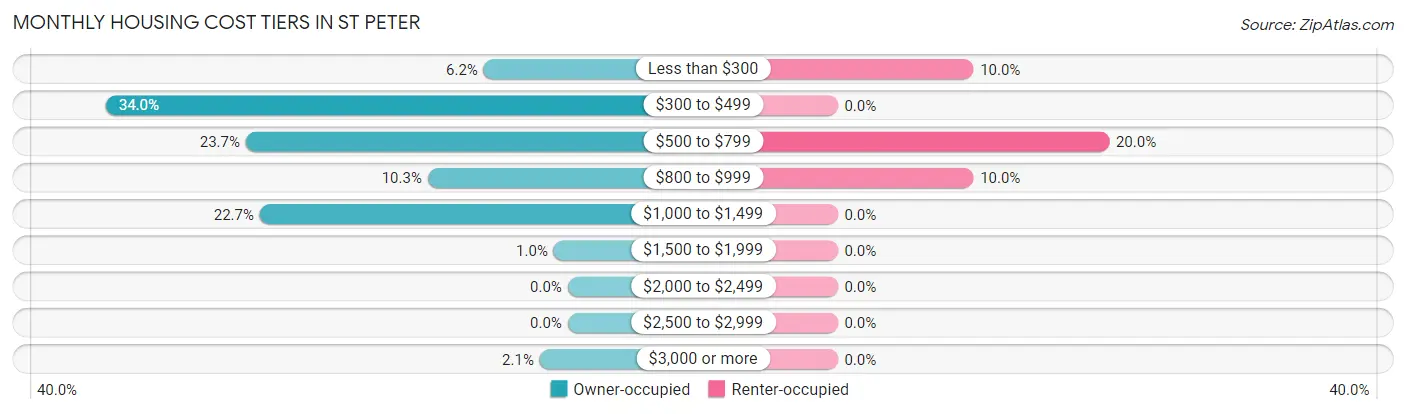
| Monthly Cost | Owner-occupied | Renter-occupied |
| Less than $300 | 6 (6.2%) | 1 (10.0%) |
| $300 to $499 | 33 (34.0%) | 0 (0.0%) |
| $500 to $799 | 23 (23.7%) | 2 (20.0%) |
| $800 to $999 | 10 (10.3%) | 1 (10.0%) |
| $1,000 to $1,499 | 22 (22.7%) | 0 (0.0%) |
| $1,500 to $1,999 | 1 (1.0%) | 0 (0.0%) |
| $2,000 to $2,499 | 0 (0.0%) | 0 (0.0%) |
| $2,500 to $2,999 | 0 (0.0%) | 0 (0.0%) |
| $3,000 or more | 2 (2.1%) | 0 (0.0%) |
| Total | 97 (100.0%) | 10 (100.0%) |
Physical Housing Characteristics in St Peter
Housing Structures in St Peter
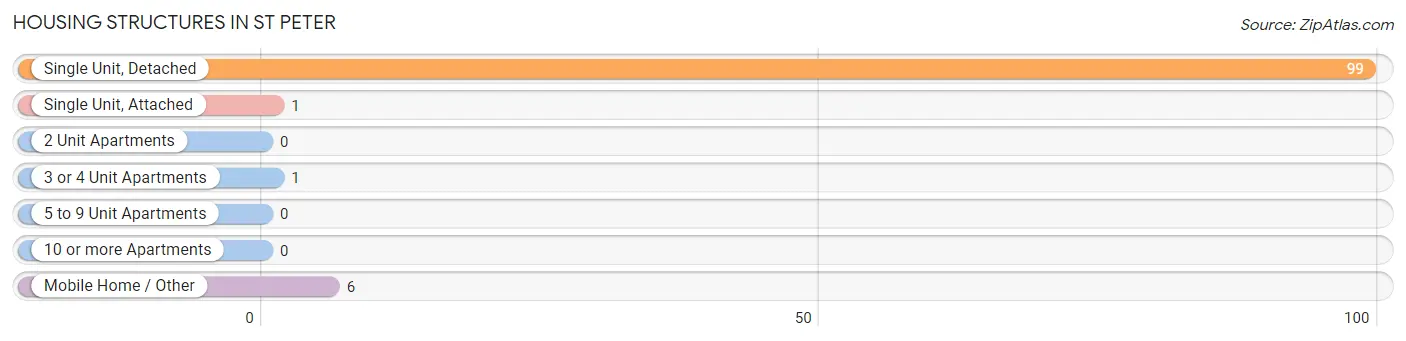
| Structure Type | # Housing Units | % Housing Units |
| Single Unit, Detached | 99 | 92.5% |
| Single Unit, Attached | 1 | 0.9% |
| 2 Unit Apartments | 0 | 0.0% |
| 3 or 4 Unit Apartments | 1 | 0.9% |
| 5 to 9 Unit Apartments | 0 | 0.0% |
| 10 or more Apartments | 0 | 0.0% |
| Mobile Home / Other | 6 | 5.6% |
| Total | 107 | 100.0% |
Housing Structures by Occupancy in St Peter
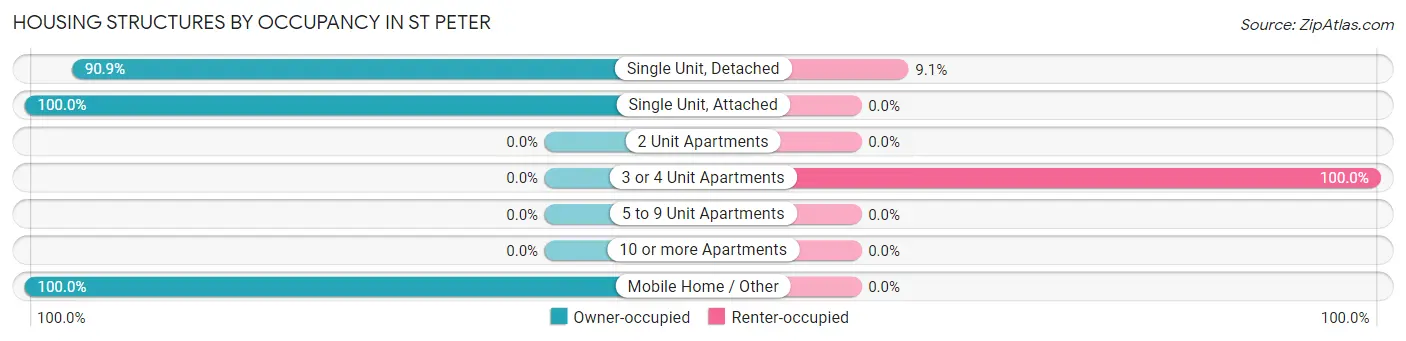
| Structure Type | Owner-occupied | Renter-occupied |
| Single Unit, Detached | 90 (90.9%) | 9 (9.1%) |
| Single Unit, Attached | 1 (100.0%) | 0 (0.0%) |
| 2 Unit Apartments | 0 (0.0%) | 0 (0.0%) |
| 3 or 4 Unit Apartments | 0 (0.0%) | 1 (100.0%) |
| 5 to 9 Unit Apartments | 0 (0.0%) | 0 (0.0%) |
| 10 or more Apartments | 0 (0.0%) | 0 (0.0%) |
| Mobile Home / Other | 6 (100.0%) | 0 (0.0%) |
| Total | 97 (90.6%) | 10 (9.3%) |
Housing Structures by Number of Rooms in St Peter
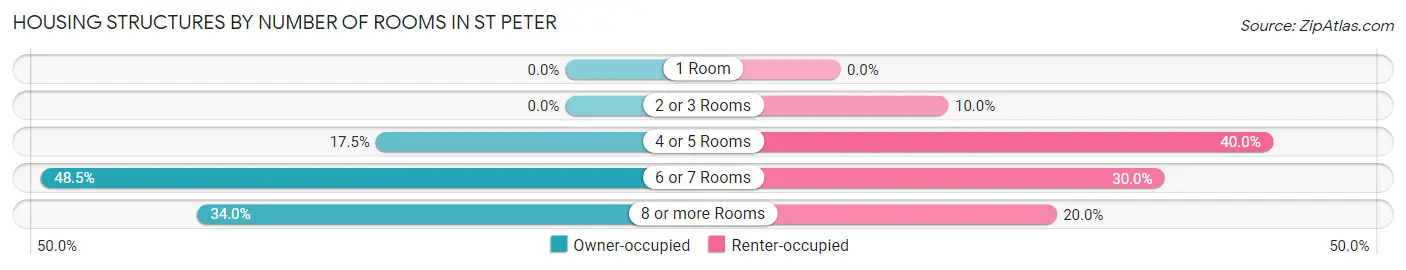
| Number of Rooms | Owner-occupied | Renter-occupied |
| 1 Room | 0 (0.0%) | 0 (0.0%) |
| 2 or 3 Rooms | 0 (0.0%) | 1 (10.0%) |
| 4 or 5 Rooms | 17 (17.5%) | 4 (40.0%) |
| 6 or 7 Rooms | 47 (48.4%) | 3 (30.0%) |
| 8 or more Rooms | 33 (34.0%) | 2 (20.0%) |
| Total | 97 (100.0%) | 10 (100.0%) |
Housing Structure by Heating Type in St Peter
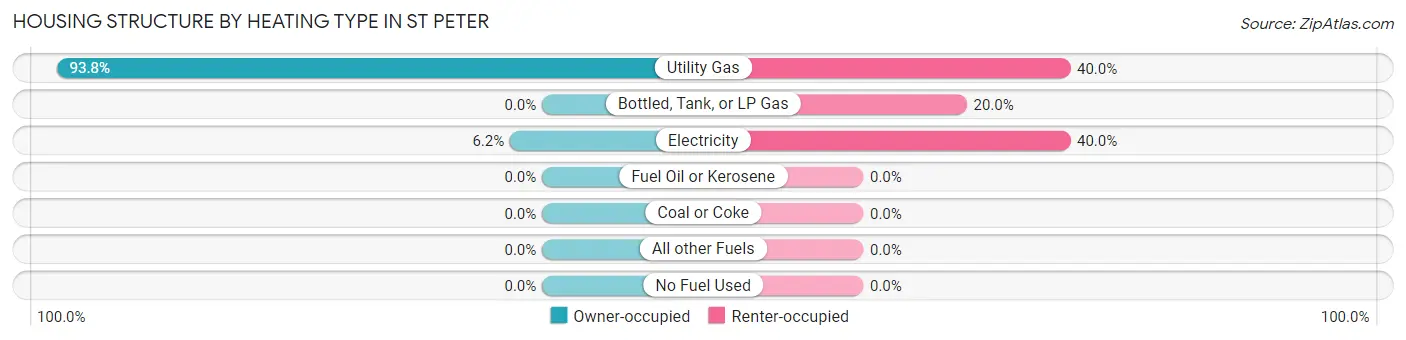
| Heating Type | Owner-occupied | Renter-occupied |
| Utility Gas | 91 (93.8%) | 4 (40.0%) |
| Bottled, Tank, or LP Gas | 0 (0.0%) | 2 (20.0%) |
| Electricity | 6 (6.2%) | 4 (40.0%) |
| Fuel Oil or Kerosene | 0 (0.0%) | 0 (0.0%) |
| Coal or Coke | 0 (0.0%) | 0 (0.0%) |
| All other Fuels | 0 (0.0%) | 0 (0.0%) |
| No Fuel Used | 0 (0.0%) | 0 (0.0%) |
| Total | 97 (100.0%) | 10 (100.0%) |
Household Vehicle Usage in St Peter
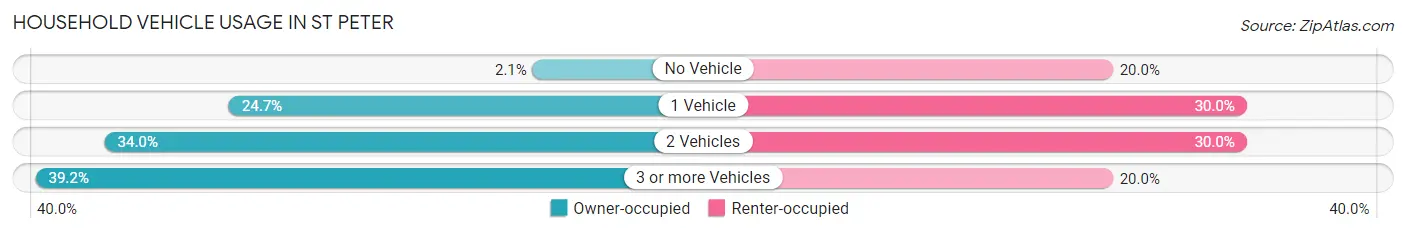
| Vehicles per Household | Owner-occupied | Renter-occupied |
| No Vehicle | 2 (2.1%) | 2 (20.0%) |
| 1 Vehicle | 24 (24.7%) | 3 (30.0%) |
| 2 Vehicles | 33 (34.0%) | 3 (30.0%) |
| 3 or more Vehicles | 38 (39.2%) | 2 (20.0%) |
| Total | 97 (100.0%) | 10 (100.0%) |
Real Estate & Mortgages in St Peter
Real Estate and Mortgage Overview in St Peter
| Characteristic | Without Mortgage | With Mortgage |
| Housing Units | 63 | 34 |
| Median Property Value | $85,800 | $111,500 |
| Median Household Income | $53,750 | $5 |
| Monthly Housing Costs | $454 | $2 |
| Real Estate Taxes | $1,413 | $0 |
Property Value by Mortgage Status in St Peter
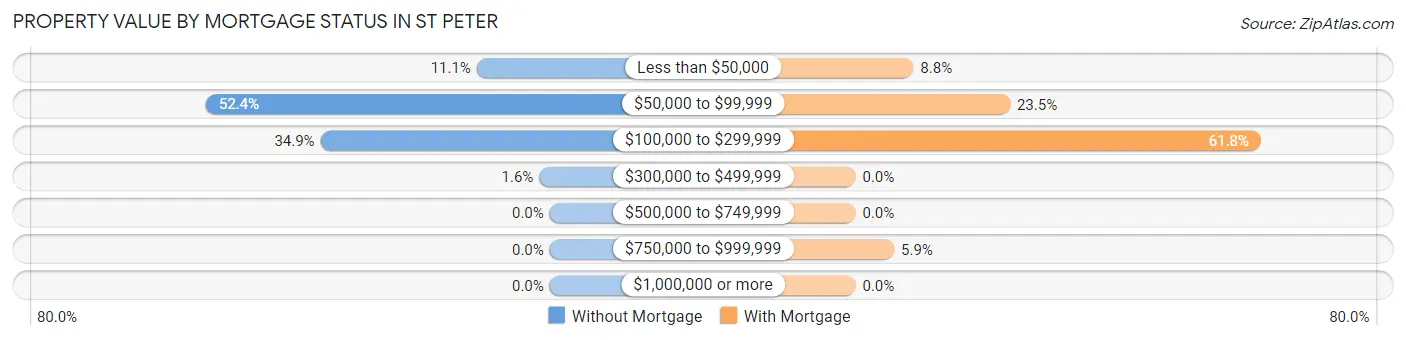
| Property Value | Without Mortgage | With Mortgage |
| Less than $50,000 | 7 (11.1%) | 3 (8.8%) |
| $50,000 to $99,999 | 33 (52.4%) | 8 (23.5%) |
| $100,000 to $299,999 | 22 (34.9%) | 21 (61.8%) |
| $300,000 to $499,999 | 1 (1.6%) | 0 (0.0%) |
| $500,000 to $749,999 | 0 (0.0%) | 0 (0.0%) |
| $750,000 to $999,999 | 0 (0.0%) | 2 (5.9%) |
| $1,000,000 or more | 0 (0.0%) | 0 (0.0%) |
| Total | 63 (100.0%) | 34 (100.0%) |
Household Income by Mortgage Status in St Peter
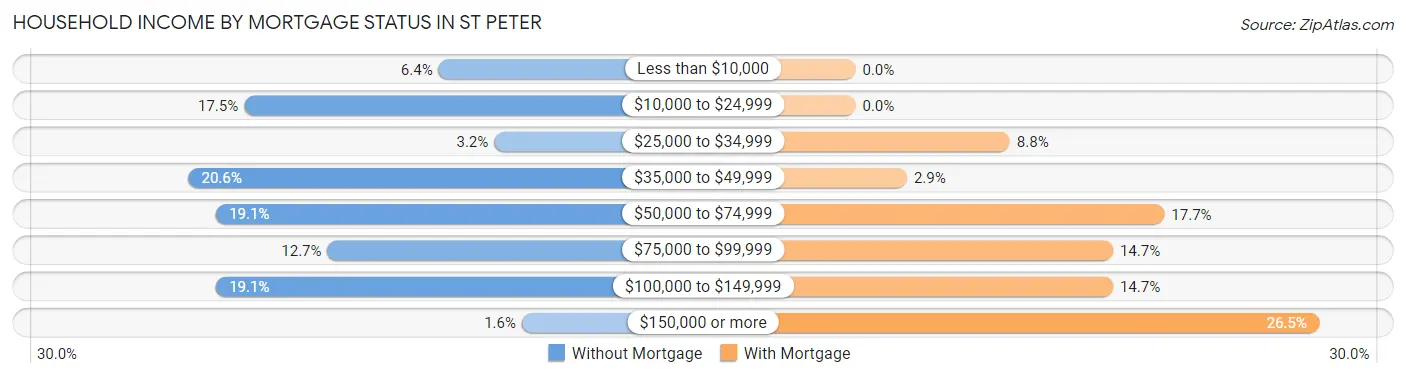
| Household Income | Without Mortgage | With Mortgage |
| Less than $10,000 | 4 (6.4%) | 0 (0.0%) |
| $10,000 to $24,999 | 11 (17.5%) | 0 (0.0%) |
| $25,000 to $34,999 | 2 (3.2%) | 3 (8.8%) |
| $35,000 to $49,999 | 13 (20.6%) | 1 (2.9%) |
| $50,000 to $74,999 | 12 (19.1%) | 6 (17.6%) |
| $75,000 to $99,999 | 8 (12.7%) | 5 (14.7%) |
| $100,000 to $149,999 | 12 (19.1%) | 5 (14.7%) |
| $150,000 or more | 1 (1.6%) | 9 (26.5%) |
| Total | 63 (100.0%) | 34 (100.0%) |
Property Value to Household Income Ratio in St Peter
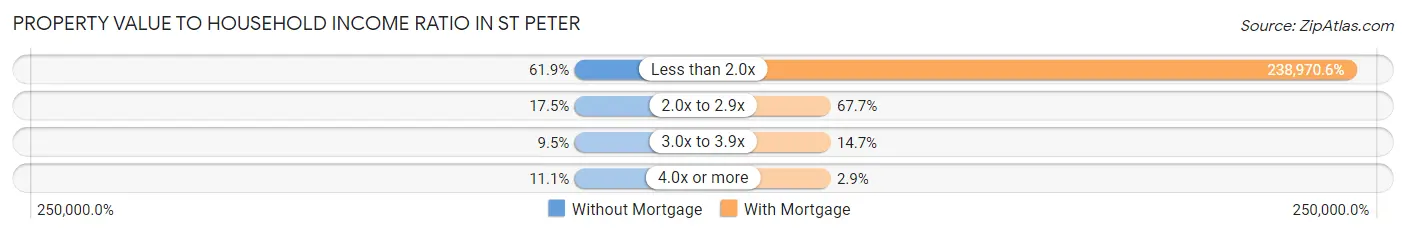
| Value-to-Income Ratio | Without Mortgage | With Mortgage |
| Less than 2.0x | 39 (61.9%) | 81,250 (238,970.6%) |
| 2.0x to 2.9x | 11 (17.5%) | 23 (67.6%) |
| 3.0x to 3.9x | 6 (9.5%) | 5 (14.7%) |
| 4.0x or more | 7 (11.1%) | 1 (2.9%) |
| Total | 63 (100.0%) | 34 (100.0%) |
Real Estate Taxes by Mortgage Status in St Peter
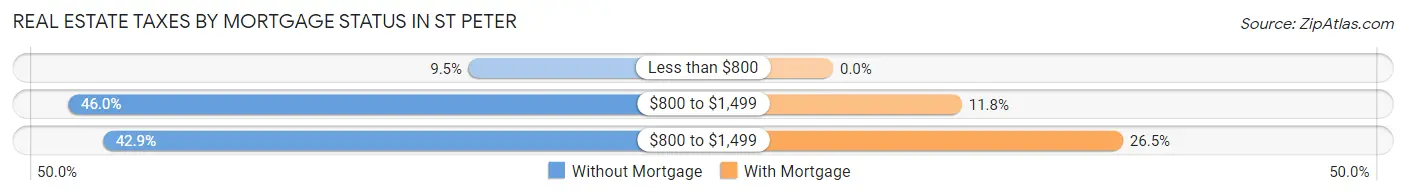
| Property Taxes | Without Mortgage | With Mortgage |
| Less than $800 | 6 (9.5%) | 0 (0.0%) |
| $800 to $1,499 | 29 (46.0%) | 4 (11.8%) |
| $800 to $1,499 | 27 (42.9%) | 9 (26.5%) |
| Total | 63 (100.0%) | 34 (100.0%) |
Health & Disability in St Peter
Health Insurance Coverage by Age in St Peter
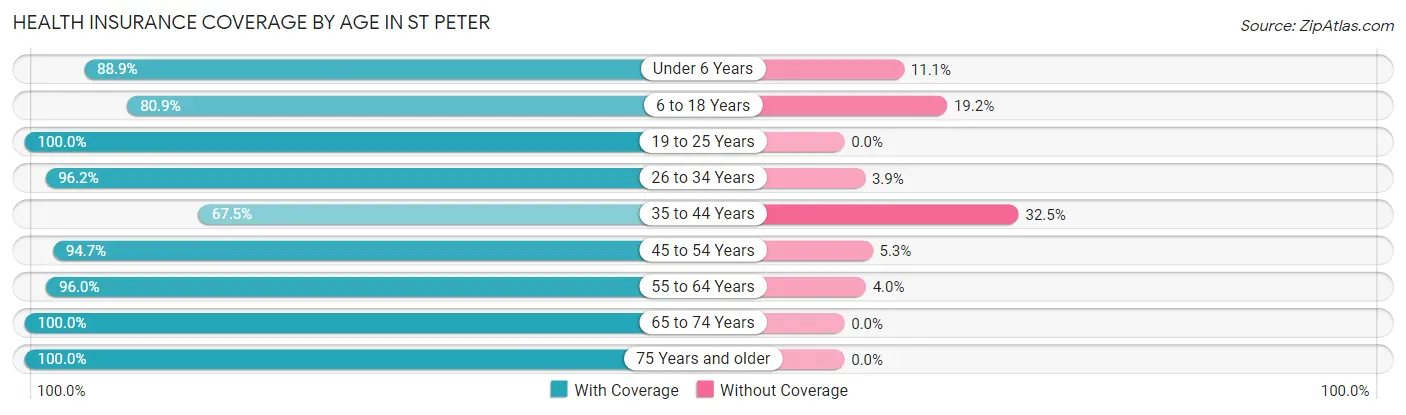
| Age Bracket | With Coverage | Without Coverage |
| Under 6 Years | 32 (88.9%) | 4 (11.1%) |
| 6 to 18 Years | 38 (80.8%) | 9 (19.2%) |
| 19 to 25 Years | 15 (100.0%) | 0 (0.0%) |
| 26 to 34 Years | 25 (96.2%) | 1 (3.8%) |
| 35 to 44 Years | 27 (67.5%) | 13 (32.5%) |
| 45 to 54 Years | 18 (94.7%) | 1 (5.3%) |
| 55 to 64 Years | 48 (96.0%) | 2 (4.0%) |
| 65 to 74 Years | 35 (100.0%) | 0 (0.0%) |
| 75 Years and older | 21 (100.0%) | 0 (0.0%) |
| Total | 259 (89.6%) | 30 (10.4%) |
Health Insurance Coverage by Citizenship Status in St Peter
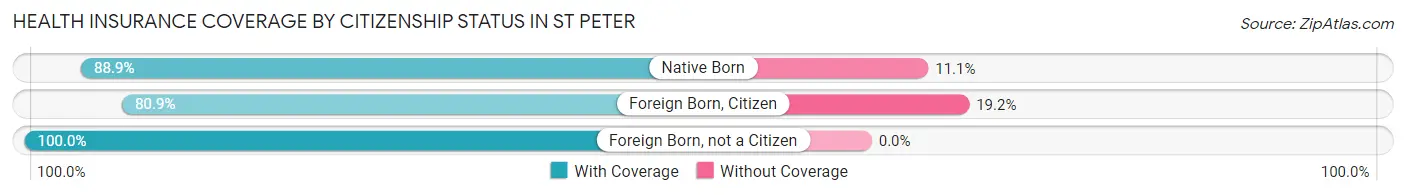
| Citizenship Status | With Coverage | Without Coverage |
| Native Born | 32 (88.9%) | 4 (11.1%) |
| Foreign Born, Citizen | 38 (80.8%) | 9 (19.2%) |
| Foreign Born, not a Citizen | 15 (100.0%) | 0 (0.0%) |
Health Insurance Coverage by Household Income in St Peter
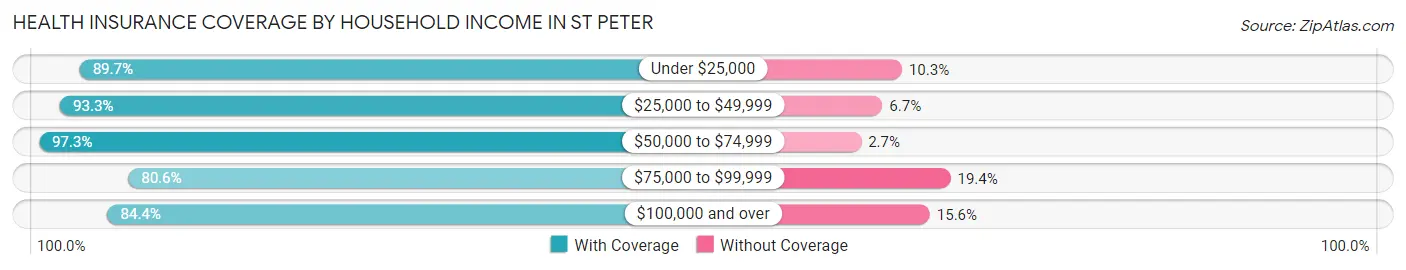
| Household Income | With Coverage | Without Coverage |
| Under $25,000 | 26 (89.7%) | 3 (10.3%) |
| $25,000 to $49,999 | 56 (93.3%) | 4 (6.7%) |
| $50,000 to $74,999 | 72 (97.3%) | 2 (2.7%) |
| $75,000 to $99,999 | 29 (80.6%) | 7 (19.4%) |
| $100,000 and over | 76 (84.4%) | 14 (15.6%) |
Public vs Private Health Insurance Coverage by Age in St Peter
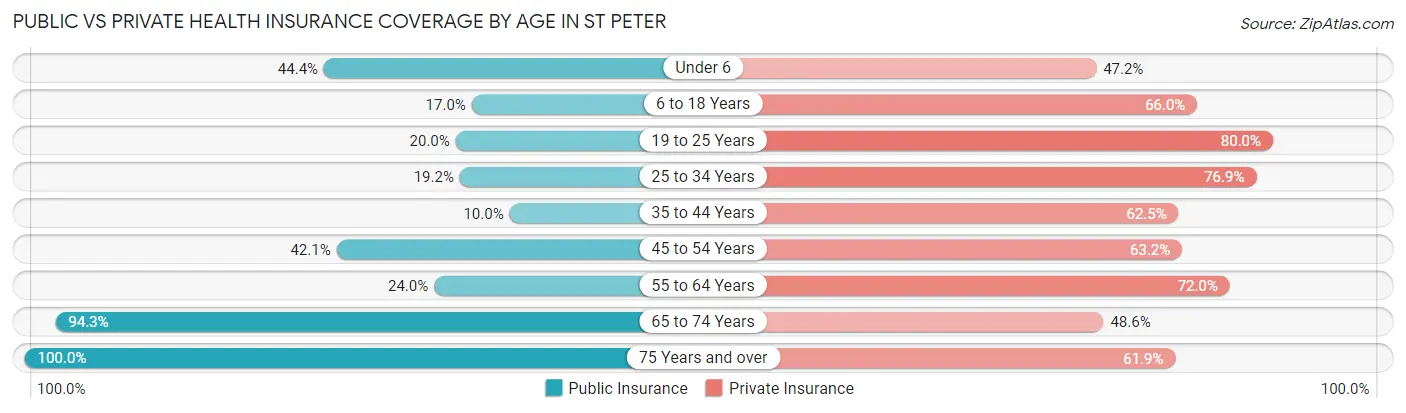
| Age Bracket | Public Insurance | Private Insurance |
| Under 6 | 16 (44.4%) | 17 (47.2%) |
| 6 to 18 Years | 8 (17.0%) | 31 (66.0%) |
| 19 to 25 Years | 3 (20.0%) | 12 (80.0%) |
| 25 to 34 Years | 5 (19.2%) | 20 (76.9%) |
| 35 to 44 Years | 4 (10.0%) | 25 (62.5%) |
| 45 to 54 Years | 8 (42.1%) | 12 (63.2%) |
| 55 to 64 Years | 12 (24.0%) | 36 (72.0%) |
| 65 to 74 Years | 33 (94.3%) | 17 (48.6%) |
| 75 Years and over | 21 (100.0%) | 13 (61.9%) |
| Total | 110 (38.1%) | 183 (63.3%) |
Disability Status by Sex by Age in St Peter
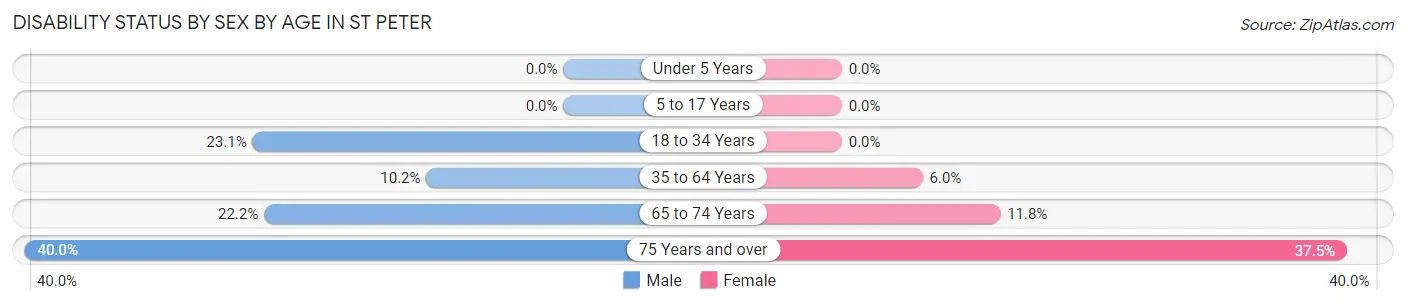
| Age Bracket | Male | Female |
| Under 5 Years | 0 (0.0%) | 0 (0.0%) |
| 5 to 17 Years | 0 (0.0%) | 0 (0.0%) |
| 18 to 34 Years | 6 (23.1%) | 0 (0.0%) |
| 35 to 64 Years | 6 (10.2%) | 3 (6.0%) |
| 65 to 74 Years | 4 (22.2%) | 2 (11.8%) |
| 75 Years and over | 2 (40.0%) | 6 (37.5%) |
Disability Class by Sex by Age in St Peter
Disability Class: Hearing Difficulty
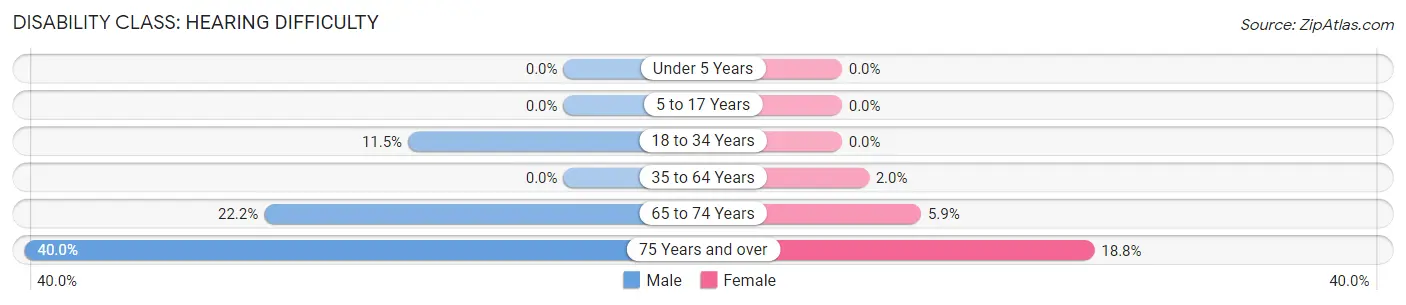
| Age Bracket | Male | Female |
| Under 5 Years | 0 (0.0%) | 0 (0.0%) |
| 5 to 17 Years | 0 (0.0%) | 0 (0.0%) |
| 18 to 34 Years | 3 (11.5%) | 0 (0.0%) |
| 35 to 64 Years | 0 (0.0%) | 1 (2.0%) |
| 65 to 74 Years | 4 (22.2%) | 1 (5.9%) |
| 75 Years and over | 2 (40.0%) | 3 (18.8%) |
Disability Class: Vision Difficulty
| Age Bracket | Male | Female |
| Under 5 Years | 0 (0.0%) | 0 (0.0%) |
| 5 to 17 Years | 0 (0.0%) | 0 (0.0%) |
| 18 to 34 Years | 0 (0.0%) | 0 (0.0%) |
| 35 to 64 Years | 0 (0.0%) | 0 (0.0%) |
| 65 to 74 Years | 0 (0.0%) | 0 (0.0%) |
| 75 Years and over | 0 (0.0%) | 0 (0.0%) |
Disability Class: Cognitive Difficulty
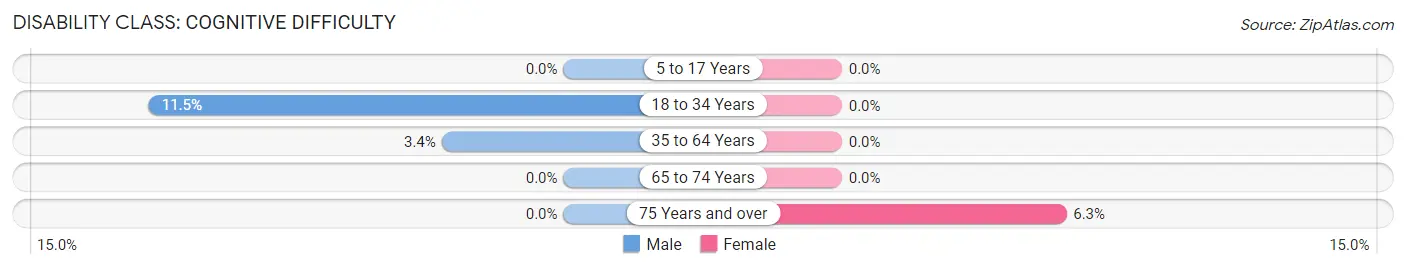
| Age Bracket | Male | Female |
| 5 to 17 Years | 0 (0.0%) | 0 (0.0%) |
| 18 to 34 Years | 3 (11.5%) | 0 (0.0%) |
| 35 to 64 Years | 2 (3.4%) | 0 (0.0%) |
| 65 to 74 Years | 0 (0.0%) | 0 (0.0%) |
| 75 Years and over | 0 (0.0%) | 1 (6.2%) |
Disability Class: Ambulatory Difficulty
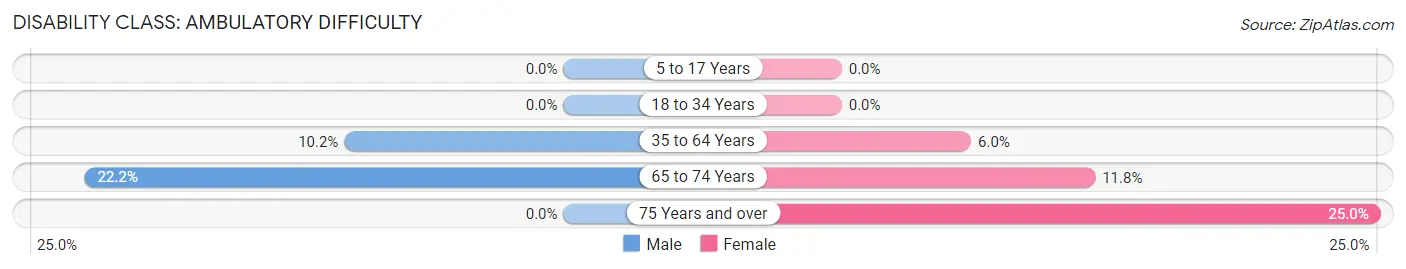
| Age Bracket | Male | Female |
| 5 to 17 Years | 0 (0.0%) | 0 (0.0%) |
| 18 to 34 Years | 0 (0.0%) | 0 (0.0%) |
| 35 to 64 Years | 6 (10.2%) | 3 (6.0%) |
| 65 to 74 Years | 4 (22.2%) | 2 (11.8%) |
| 75 Years and over | 0 (0.0%) | 4 (25.0%) |
Disability Class: Self-Care Difficulty
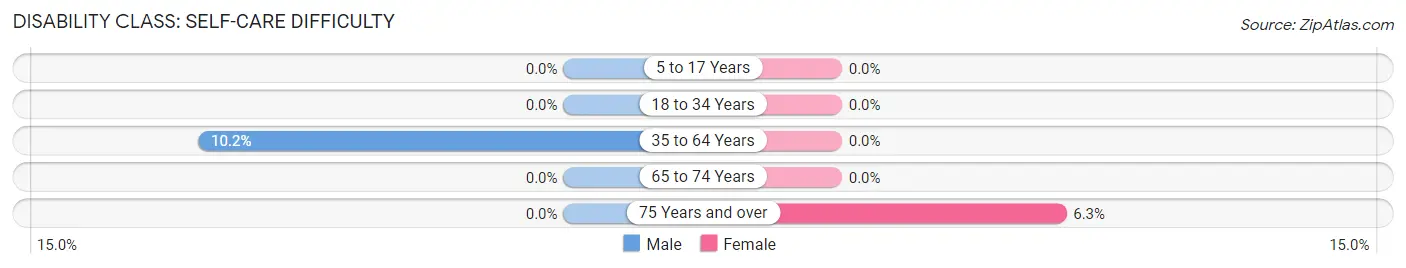
| Age Bracket | Male | Female |
| 5 to 17 Years | 0 (0.0%) | 0 (0.0%) |
| 18 to 34 Years | 0 (0.0%) | 0 (0.0%) |
| 35 to 64 Years | 6 (10.2%) | 0 (0.0%) |
| 65 to 74 Years | 0 (0.0%) | 0 (0.0%) |
| 75 Years and over | 0 (0.0%) | 1 (6.2%) |
Technology Access in St Peter
Computing Device Access in St Peter
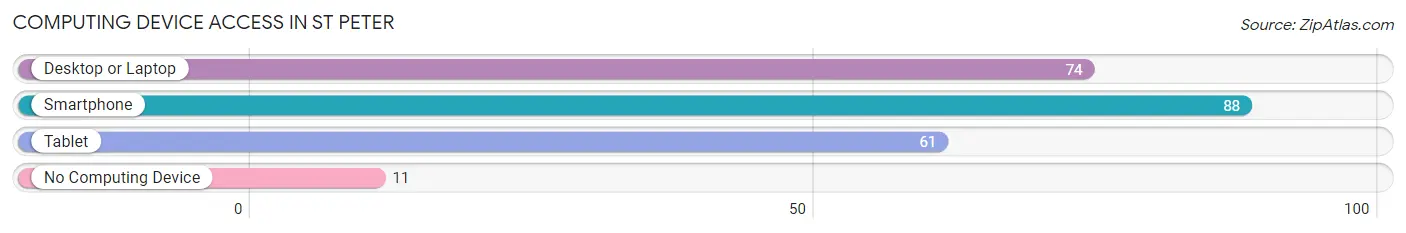
| Device Type | # Households | % Households |
| Desktop or Laptop | 74 | 69.2% |
| Smartphone | 88 | 82.2% |
| Tablet | 61 | 57.0% |
| No Computing Device | 11 | 10.3% |
| Total | 107 | 100.0% |
Internet Access in St Peter
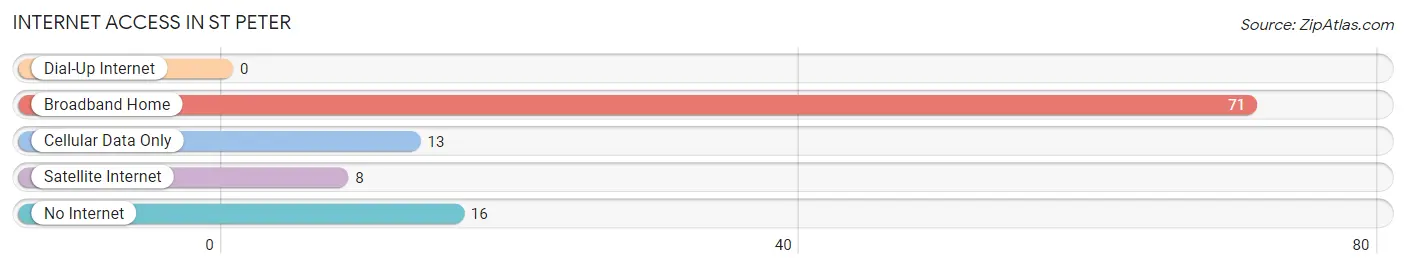
| Internet Type | # Households | % Households |
| Dial-Up Internet | 0 | 0.0% |
| Broadband Home | 71 | 66.4% |
| Cellular Data Only | 13 | 12.1% |
| Satellite Internet | 8 | 7.5% |
| No Internet | 16 | 14.9% |
| Total | 107 | 100.0% |
St Peter Summary
Peter, Illinois is a small village located in the northern part of the state, in the county of Will. It is situated on the banks of the Kankakee River, and is part of the Kankakee-Iroquois Regional Planning Commission. The village has a population of approximately 1,000 people, and is located about 30 miles south of Chicago.
History
The area that is now Peter, Illinois was first settled in the early 1800s by a group of French-Canadian fur traders. The village was originally known as “Petit Prairie”, and was later renamed “St. Peter” in honor of the patron saint of the French-Canadian settlers. The village was officially incorporated in 1854.
In the late 1800s, the village was a major hub for the local agricultural industry. The area was known for its production of corn, wheat, and other grains. The village also had a thriving lumber industry, and was home to several sawmills.
In the early 1900s, the village began to experience a decline in its agricultural industry. This was due to the introduction of new farming techniques and the development of new transportation routes. As a result, the village began to focus more on its industrial sector. During this time, the village was home to several factories, including a paper mill, a brickyard, and a canning factory.
Geography
Peter, Illinois is located in the northern part of the state, in the county of Will. It is situated on the banks of the Kankakee River, and is part of the Kankakee-Iroquois Regional Planning Commission. The village has a total area of 0.7 square miles, all of which is land.
The village is located about 30 miles south of Chicago, and is bordered by the towns of Manteno, Momence, and Kankakee. The village is also located near several state parks, including the Kankakee River State Park and the Iroquois County State Park.
Economy
The economy of Peter, Illinois is largely based on agriculture and manufacturing. The village is home to several farms, which produce corn, wheat, and other grains. The village also has a thriving lumber industry, and is home to several sawmills.
In addition, the village is home to several factories, including a paper mill, a brickyard, and a canning factory. The village also has a number of small businesses, including restaurants, retail stores, and service providers.
Demographics
As of the 2010 census, the population of Peter, Illinois was 1,000 people. The racial makeup of the village was 97.2% White, 0.7% African American, 0.3% Native American, 0.3% Asian, and 1.5% from other races. The median household income was $45,000, and the median family income was $50,000.
The village has a high rate of homeownership, with over 80% of the population owning their own homes. The village also has a high rate of educational attainment, with over 90% of the population having at least a high school diploma.
Conclusion
Peter, Illinois is a small village located in the northern part of the state, in the county of Will. It is situated on the banks of the Kankakee River, and is part of the Kankakee-Iroquois Regional Planning Commission. The village has a population of approximately 1,000 people, and is located about 30 miles south of Chicago. The economy of the village is largely based on agriculture and manufacturing, and the village has a high rate of homeownership and educational attainment.
Common Questions
What is Per Capita Income in St Peter?
Per Capita income in St Peter is $30,547.
What is the Median Family Income in St Peter?
Median Family Income in St Peter is $67,083.
What is the Median Household income in St Peter?
Median Household Income in St Peter is $65,208.
What is Income or Wage Gap in St Peter?
Income or Wage Gap in St Peter is 37.6%.
Women in St Peter earn 62.4 cents for every dollar earned by a man.
What is Inequality or Gini Index in St Peter?
Inequality or Gini Index in St Peter is 0.40.
What is the Total Population of St Peter?
Total Population of St Peter is 289.
What is the Total Male Population of St Peter?
Total Male Population of St Peter is 146.
What is the Total Female Population of St Peter?
Total Female Population of St Peter is 143.
What is the Ratio of Males per 100 Females in St Peter?
There are 102.10 Males per 100 Females in St Peter.
What is the Ratio of Females per 100 Males in St Peter?
There are 97.95 Females per 100 Males in St Peter.
What is the Median Population Age in St Peter?
Median Population Age in St Peter is 39.7 Years.
What is the Average Family Size in St Peter
Average Family Size in St Peter is 3.3 People.
What is the Average Household Size in St Peter
Average Household Size in St Peter is 2.7 People.
How Large is the Labor Force in St Peter?
There are 121 People in the Labor Forcein in St Peter.
What is the Percentage of People in the Labor Force in St Peter?
54.5% of People are in the Labor Force in St Peter.