Dwight, IL Map & Demographics
Dwight Map
Dwight Overview
$35,794
PER CAPITA INCOME
$69,414
AVG FAMILY INCOME
$66,948
AVG HOUSEHOLD INCOME
26.3%
WAGE / INCOME GAP [ % ]
73.7¢/ $1
WAGE / INCOME GAP [ $ ]
0.41
INEQUALITY / GINI INDEX
3,814
TOTAL POPULATION
1,919
MALE POPULATION
1,895
FEMALE POPULATION
101.27
MALES / 100 FEMALES
98.75
FEMALES / 100 MALES
36.7
MEDIAN AGE
2.7
AVG FAMILY SIZE
2.4
AVG HOUSEHOLD SIZE
2,055
LABOR FORCE [ PEOPLE ]
65.3%
PERCENT IN LABOR FORCE
1.7%
UNEMPLOYMENT RATE
Dwight Zip Codes
Dwight Area Codes
Income in Dwight
Income Overview in Dwight
Per Capita Income in Dwight is $35,794, while median incomes of families and households are $69,414 and $66,948 respectively.
| Characteristic | Number | Measure |
| Per Capita Income | 3,814 | $35,794 |
| Median Family Income | 1,080 | $69,414 |
| Mean Family Income | 1,080 | $86,623 |
| Median Household Income | 1,542 | $66,948 |
| Mean Household Income | 1,542 | $85,659 |
| Income Deficit | 1,080 | $0 |
| Wage / Income Gap (%) | 3,814 | 26.28% |
| Wage / Income Gap ($) | 3,814 | 73.72¢ per $1 |
| Gini / Inequality Index | 3,814 | 0.41 |
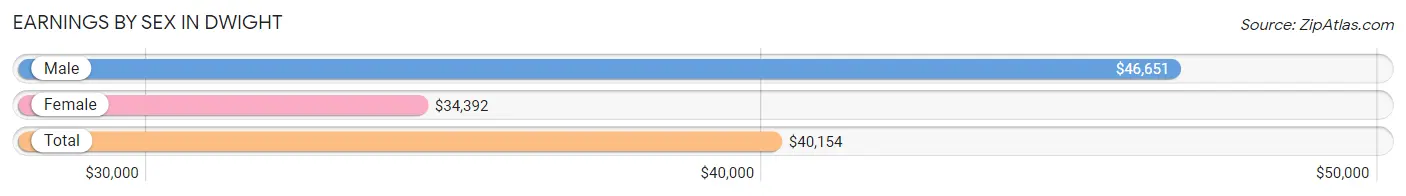
Earnings by Sex in Dwight
Average Earnings in Dwight are $40,154, $46,651 for men and $34,392 for women, a difference of 26.3%.
| Sex | Number | Average Earnings |
| Male | 1,181 (54.0%) | $46,651 |
| Female | 1,004 (46.0%) | $34,392 |
| Total | 2,185 (100.0%) | $40,154 |
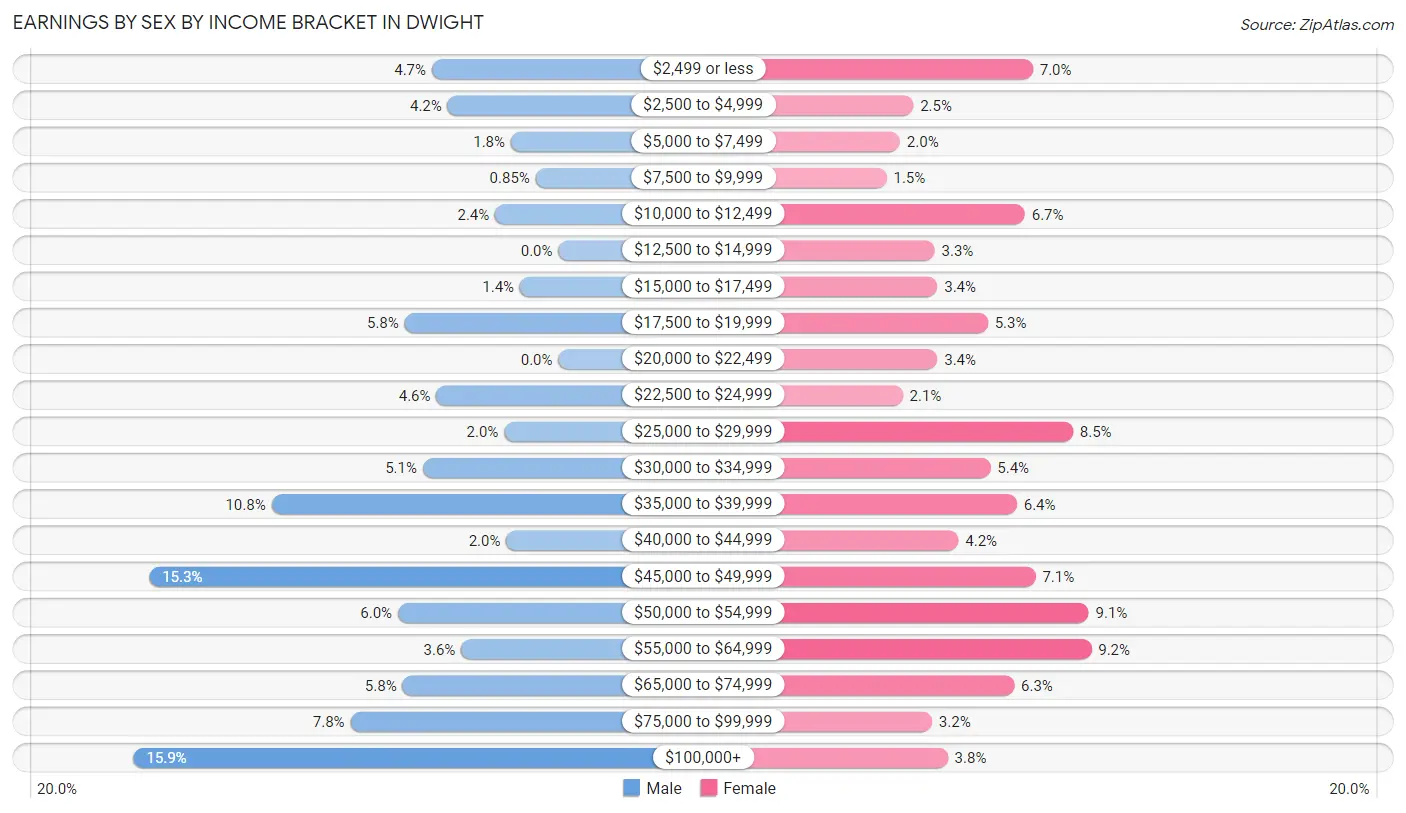
Earnings by Sex by Income Bracket in Dwight
The most common earnings brackets in Dwight are $100,000+ for men (188 | 15.9%) and $55,000 to $64,999 for women (92 | 9.2%).
| Income | Male | Female |
| $2,499 or less | 56 (4.7%) | 70 (7.0%) |
| $2,500 to $4,999 | 49 (4.2%) | 25 (2.5%) |
| $5,000 to $7,499 | 21 (1.8%) | 20 (2.0%) |
| $7,500 to $9,999 | 10 (0.9%) | 15 (1.5%) |
| $10,000 to $12,499 | 28 (2.4%) | 67 (6.7%) |
| $12,500 to $14,999 | 0 (0.0%) | 33 (3.3%) |
| $15,000 to $17,499 | 17 (1.4%) | 34 (3.4%) |
| $17,500 to $19,999 | 68 (5.8%) | 53 (5.3%) |
| $20,000 to $22,499 | 0 (0.0%) | 34 (3.4%) |
| $22,500 to $24,999 | 54 (4.6%) | 21 (2.1%) |
| $25,000 to $29,999 | 24 (2.0%) | 85 (8.5%) |
| $30,000 to $34,999 | 60 (5.1%) | 54 (5.4%) |
| $35,000 to $39,999 | 127 (10.7%) | 64 (6.4%) |
| $40,000 to $44,999 | 23 (1.9%) | 42 (4.2%) |
| $45,000 to $49,999 | 181 (15.3%) | 71 (7.1%) |
| $50,000 to $54,999 | 71 (6.0%) | 91 (9.1%) |
| $55,000 to $64,999 | 43 (3.6%) | 92 (9.2%) |
| $65,000 to $74,999 | 69 (5.8%) | 63 (6.3%) |
| $75,000 to $99,999 | 92 (7.8%) | 32 (3.2%) |
| $100,000+ | 188 (15.9%) | 38 (3.8%) |
| Total | 1,181 (100.0%) | 1,004 (100.0%) |
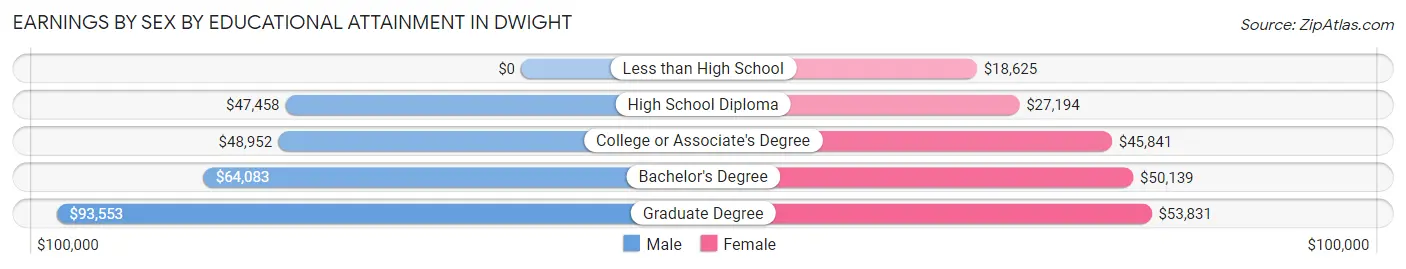
Earnings by Sex by Educational Attainment in Dwight
Average earnings in Dwight are $48,925 for men and $38,500 for women, a difference of 21.3%. Men with an educational attainment of graduate degree enjoy the highest average annual earnings of $93,553, while those with high school diploma education earn the least with $47,458. Women with an educational attainment of graduate degree earn the most with the average annual earnings of $53,831, while those with less than high school education have the smallest earnings of $18,625.
| Educational Attainment | Male Income | Female Income |
| Less than High School | - | - |
| High School Diploma | $47,458 | $27,194 |
| College or Associate's Degree | $48,952 | $45,841 |
| Bachelor's Degree | $64,083 | $50,139 |
| Graduate Degree | $93,553 | $53,831 |
| Total | $48,925 | $38,500 |
Family Income in Dwight
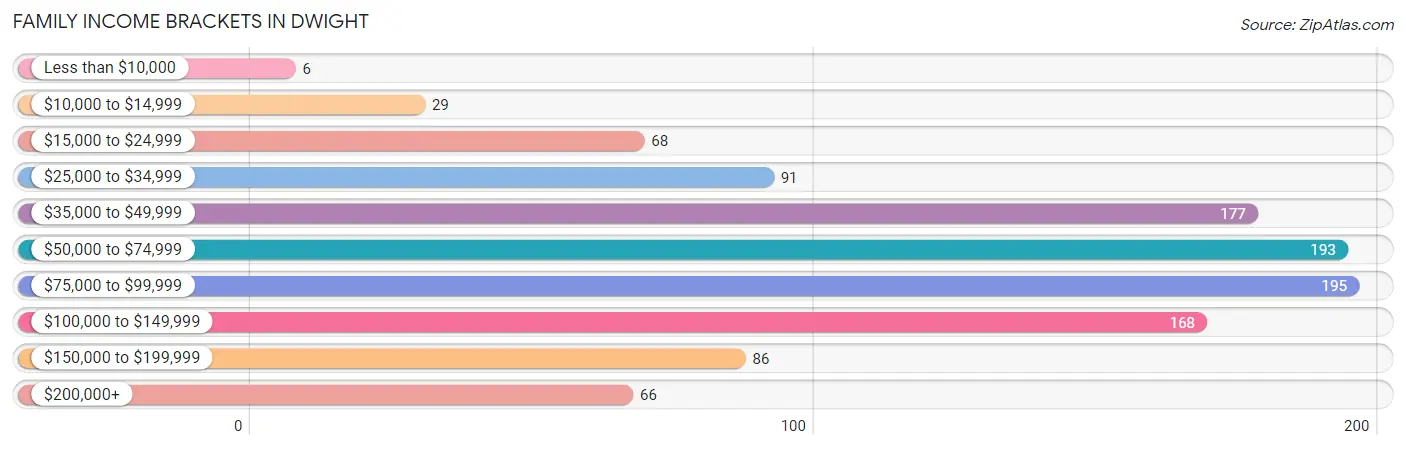
Family Income Brackets in Dwight
According to the Dwight family income data, there are 195 families falling into the $75,000 to $99,999 income range, which is the most common income bracket and makes up 18.1% of all families. Conversely, the less than $10,000 income bracket is the least frequent group with only 6 families (0.6%) belonging to this category.
| Income Bracket | # Families | % Families |
| Less than $10,000 | 6 | 0.6% |
| $10,000 to $14,999 | 29 | 2.7% |
| $15,000 to $24,999 | 68 | 6.3% |
| $25,000 to $34,999 | 91 | 8.4% |
| $35,000 to $49,999 | 177 | 16.4% |
| $50,000 to $74,999 | 193 | 17.9% |
| $75,000 to $99,999 | 195 | 18.1% |
| $100,000 to $149,999 | 168 | 15.6% |
| $150,000 to $199,999 | 86 | 8.0% |
| $200,000+ | 66 | 6.1% |
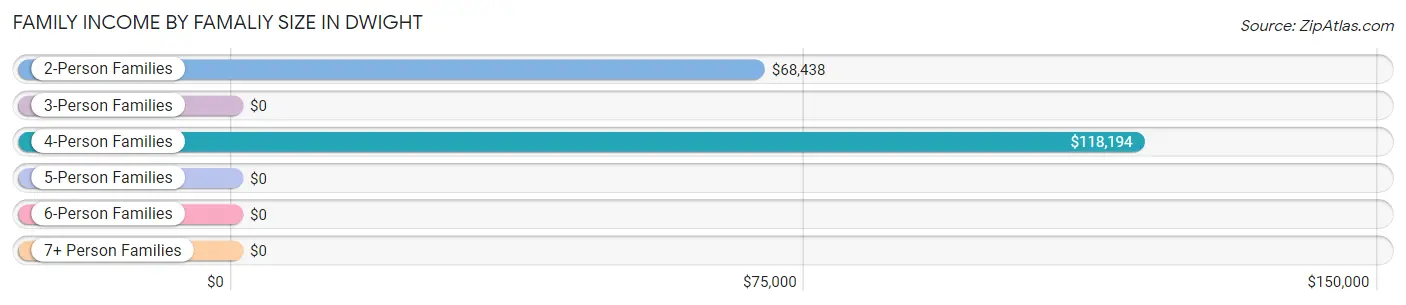
Family Income by Famaliy Size in Dwight
4-person families (93 | 8.6%) account for the highest median family income in Dwight with $118,194 per family, while 2-person families (678 | 62.8%) have the highest median income of $34,219 per family member.
| Income Bracket | # Families | Median Income |
| 2-Person Families | 678 (62.8%) | $68,438 |
| 3-Person Families | 154 (14.3%) | $0 |
| 4-Person Families | 93 (8.6%) | $118,194 |
| 5-Person Families | 94 (8.7%) | $0 |
| 6-Person Families | 13 (1.2%) | $0 |
| 7+ Person Families | 48 (4.4%) | $0 |
| Total | 1,080 (100.0%) | $69,414 |
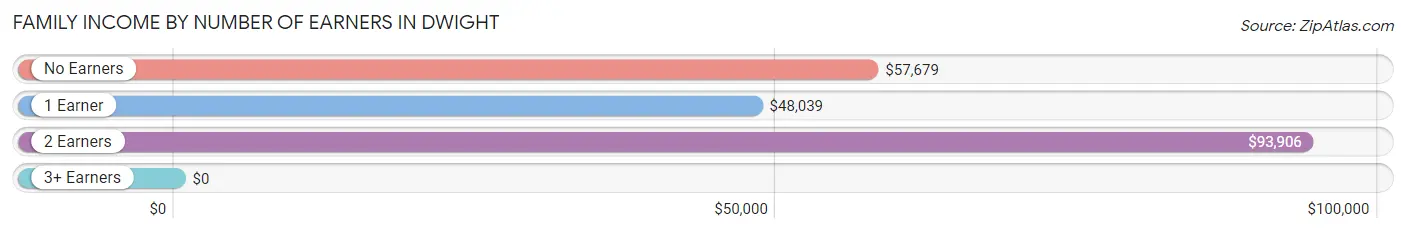
Family Income by Number of Earners in Dwight
| Number of Earners | # Families | Median Income |
| No Earners | 103 (9.5%) | $57,679 |
| 1 Earner | 439 (40.6%) | $48,039 |
| 2 Earners | 405 (37.5%) | $93,906 |
| 3+ Earners | 133 (12.3%) | $0 |
| Total | 1,080 (100.0%) | $69,414 |
Household Income in Dwight
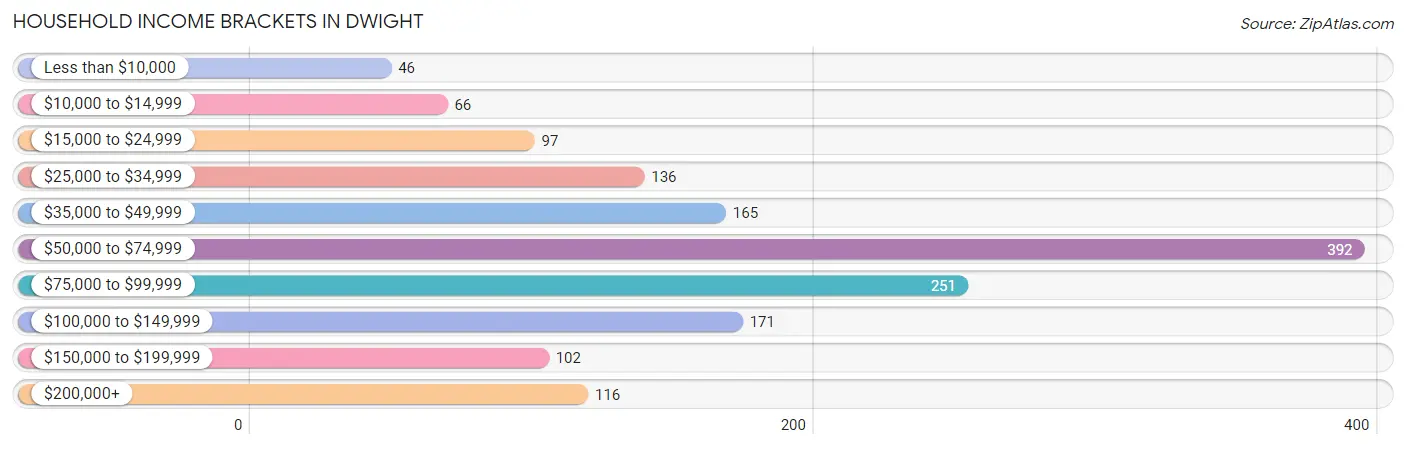
Household Income Brackets in Dwight
With 392 households falling in the category, the $50,000 to $74,999 income range is the most frequent in Dwight, accounting for 25.4% of all households. In contrast, only 46 households (3.0%) fall into the less than $10,000 income bracket, making it the least populous group.
| Income Bracket | # Households | % Households |
| Less than $10,000 | 46 | 3.0% |
| $10,000 to $14,999 | 66 | 4.3% |
| $15,000 to $24,999 | 97 | 6.3% |
| $25,000 to $34,999 | 136 | 8.8% |
| $35,000 to $49,999 | 165 | 10.7% |
| $50,000 to $74,999 | 392 | 25.4% |
| $75,000 to $99,999 | 251 | 16.3% |
| $100,000 to $149,999 | 171 | 11.1% |
| $150,000 to $199,999 | 102 | 6.6% |
| $200,000+ | 116 | 7.5% |
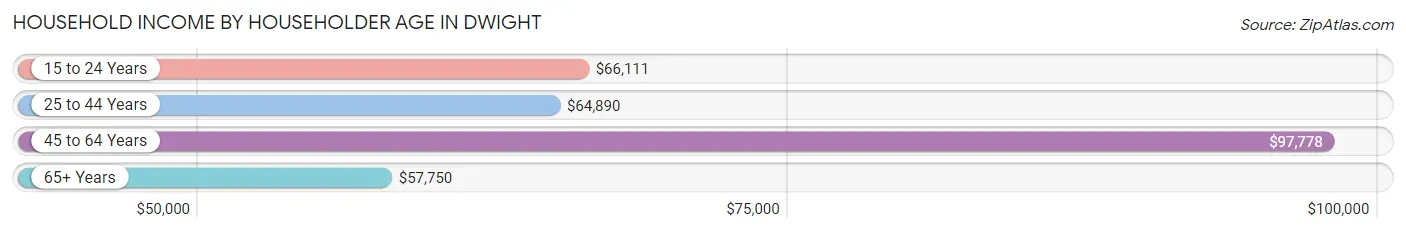
Household Income by Householder Age in Dwight
The median household income in Dwight is $66,948, with the highest median household income of $97,778 found in the 45 to 64 years age bracket for the primary householder. A total of 412 households (26.7%) fall into this category. Meanwhile, the 65+ years age bracket for the primary householder has the lowest median household income of $57,750, with 387 households (25.1%) in this group.
| Income Bracket | # Households | Median Income |
| 15 to 24 Years | 80 (5.2%) | $66,111 |
| 25 to 44 Years | 663 (43.0%) | $64,890 |
| 45 to 64 Years | 412 (26.7%) | $97,778 |
| 65+ Years | 387 (25.1%) | $57,750 |
| Total | 1,542 (100.0%) | $66,948 |
Poverty in Dwight
Income Below Poverty by Sex and Age in Dwight
With 14.1% poverty level for males and 15.2% for females among the residents of Dwight, 5 year old males and 6 to 11 year old females are the most vulnerable to poverty, with 17 males (100.0%) and 50 females (42.4%) in their respective age groups living below the poverty level.
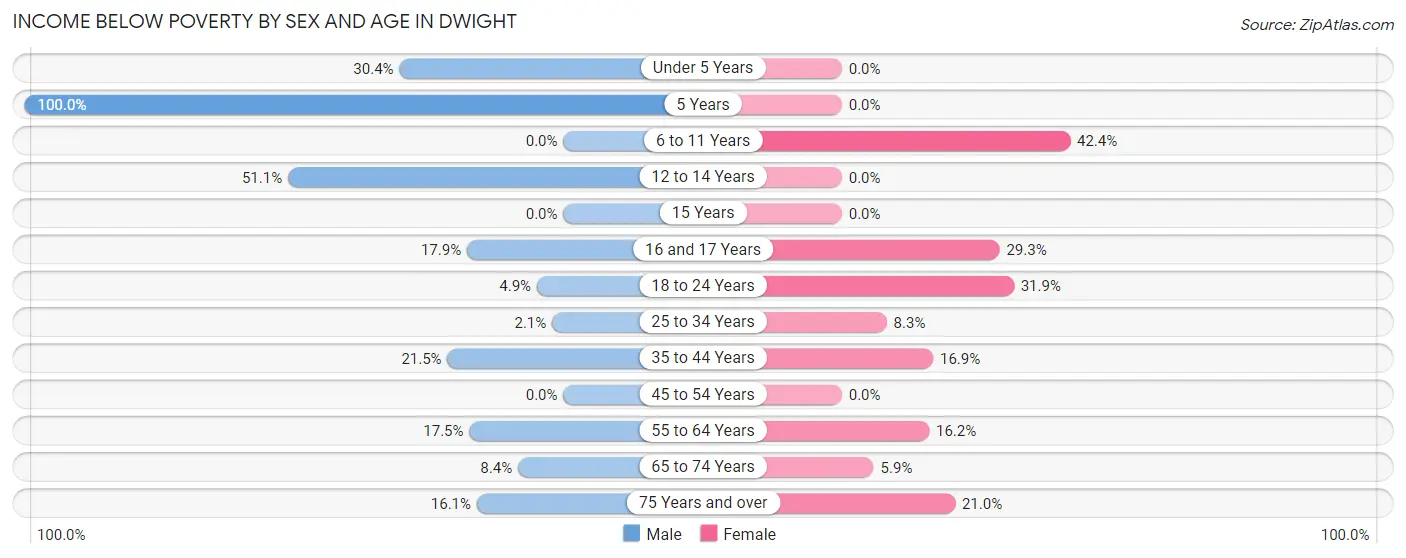
| Age Bracket | Male | Female |
| Under 5 Years | 42 (30.4%) | 0 (0.0%) |
| 5 Years | 17 (100.0%) | 0 (0.0%) |
| 6 to 11 Years | 0 (0.0%) | 50 (42.4%) |
| 12 to 14 Years | 46 (51.1%) | 0 (0.0%) |
| 15 Years | 0 (0.0%) | 0 (0.0%) |
| 16 and 17 Years | 17 (17.9%) | 24 (29.3%) |
| 18 to 24 Years | 10 (4.9%) | 60 (31.9%) |
| 25 to 34 Years | 6 (2.1%) | 23 (8.3%) |
| 35 to 44 Years | 60 (21.5%) | 51 (16.9%) |
| 45 to 54 Years | 0 (0.0%) | 0 (0.0%) |
| 55 to 64 Years | 37 (17.4%) | 29 (16.2%) |
| 65 to 74 Years | 16 (8.4%) | 13 (5.9%) |
| 75 Years and over | 13 (16.1%) | 29 (21.0%) |
| Total | 264 (14.1%) | 279 (15.2%) |
Income Above Poverty by Sex and Age in Dwight
According to the poverty statistics in Dwight, males aged 6 to 11 years and females aged under 5 years are the age groups that are most secure financially, with 100.0% of males and 100.0% of females in these age groups living above the poverty line.
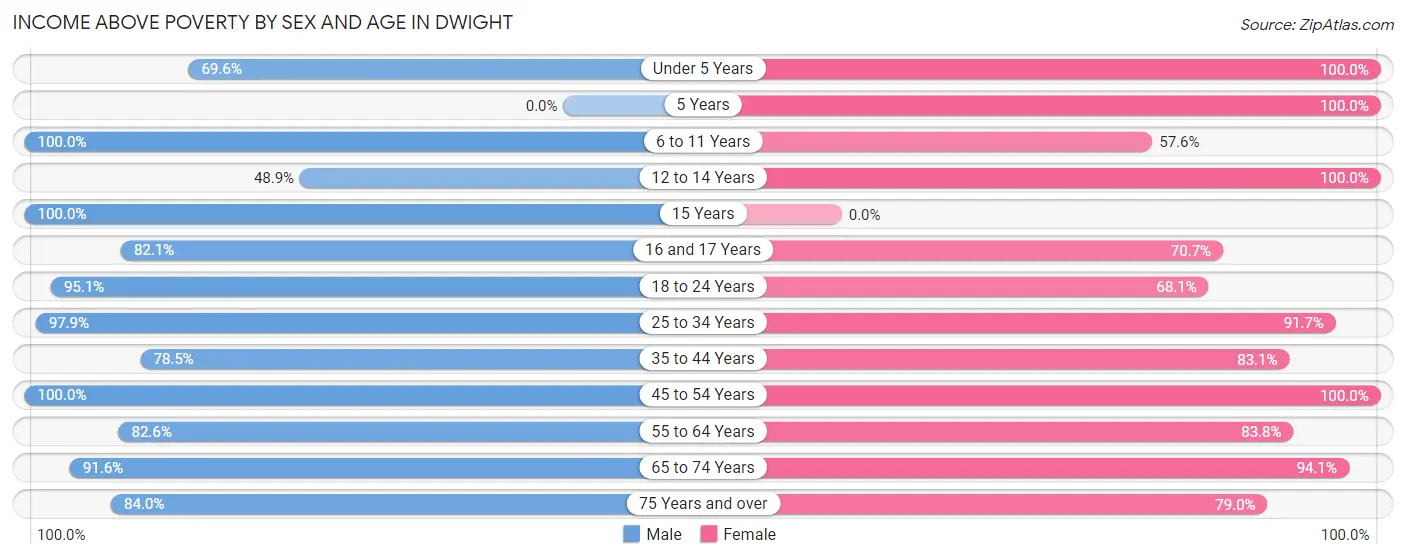
| Age Bracket | Male | Female |
| Under 5 Years | 96 (69.6%) | 43 (100.0%) |
| 5 Years | 0 (0.0%) | 8 (100.0%) |
| 6 to 11 Years | 83 (100.0%) | 68 (57.6%) |
| 12 to 14 Years | 44 (48.9%) | 125 (100.0%) |
| 15 Years | 21 (100.0%) | 0 (0.0%) |
| 16 and 17 Years | 78 (82.1%) | 58 (70.7%) |
| 18 to 24 Years | 194 (95.1%) | 128 (68.1%) |
| 25 to 34 Years | 281 (97.9%) | 253 (91.7%) |
| 35 to 44 Years | 219 (78.5%) | 250 (83.1%) |
| 45 to 54 Years | 180 (100.0%) | 158 (100.0%) |
| 55 to 64 Years | 175 (82.6%) | 150 (83.8%) |
| 65 to 74 Years | 174 (91.6%) | 207 (94.1%) |
| 75 Years and over | 68 (84.0%) | 109 (79.0%) |
| Total | 1,613 (85.9%) | 1,557 (84.8%) |
Income Below Poverty Among Married-Couple Families in Dwight
The poverty statistics for married-couple families in Dwight show that 4.5% or 33 of the total 737 families live below the poverty line. Families with 3 or 4 children have the highest poverty rate of 23.5%, comprising of 19 families. On the other hand, families with 5 or more children have the lowest poverty rate of 0.0%, which includes 0 families.
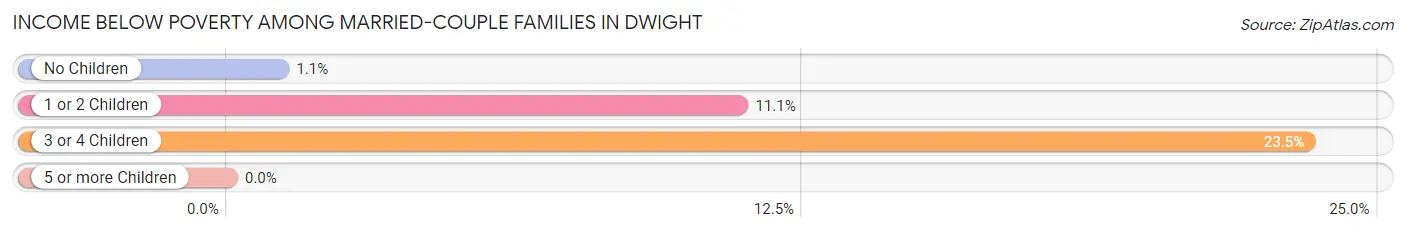
| Children | Above Poverty | Below Poverty |
| No Children | 530 (98.9%) | 6 (1.1%) |
| 1 or 2 Children | 64 (88.9%) | 8 (11.1%) |
| 3 or 4 Children | 62 (76.5%) | 19 (23.5%) |
| 5 or more Children | 48 (100.0%) | 0 (0.0%) |
| Total | 704 (95.5%) | 33 (4.5%) |
Income Below Poverty Among Single-Parent Households in Dwight
According to the poverty data in Dwight, 7.1% or 6 single-father households and 25.5% or 66 single-mother households are living below the poverty line. Among single-father households, those with no children have the highest poverty rate, with 6 households (33.3%) experiencing poverty. Likewise, among single-mother households, those with 1 or 2 children have the highest poverty rate, with 66 households (46.5%) falling below the poverty line.
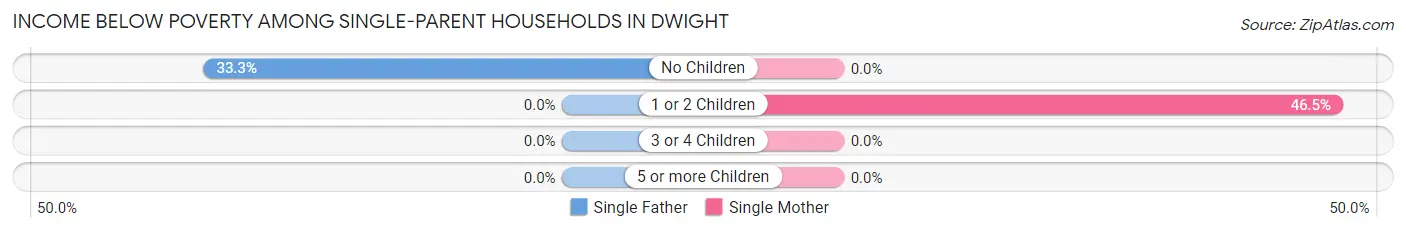
| Children | Single Father | Single Mother |
| No Children | 6 (33.3%) | 0 (0.0%) |
| 1 or 2 Children | 0 (0.0%) | 66 (46.5%) |
| 3 or 4 Children | 0 (0.0%) | 0 (0.0%) |
| 5 or more Children | 0 (0.0%) | 0 (0.0%) |
| Total | 6 (7.1%) | 66 (25.5%) |
Income Below Poverty Among Married-Couple vs Single-Parent Households in Dwight
The poverty data for Dwight shows that 33 of the married-couple family households (4.5%) and 72 of the single-parent households (21.0%) are living below the poverty level. Within the married-couple family households, those with 3 or 4 children have the highest poverty rate, with 19 households (23.5%) falling below the poverty line. Among the single-parent households, those with 1 or 2 children have the highest poverty rate, with 66 household (31.7%) living below poverty.
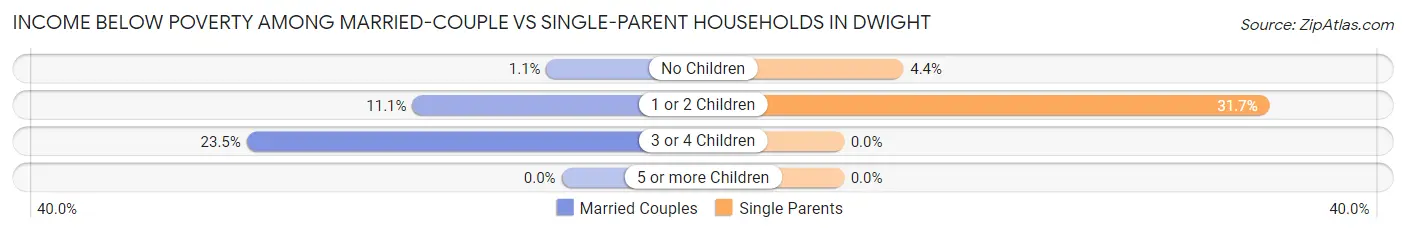
| Children | Married-Couple Families | Single-Parent Households |
| No Children | 6 (1.1%) | 6 (4.4%) |
| 1 or 2 Children | 8 (11.1%) | 66 (31.7%) |
| 3 or 4 Children | 19 (23.5%) | 0 (0.0%) |
| 5 or more Children | 0 (0.0%) | 0 (0.0%) |
| Total | 33 (4.5%) | 72 (21.0%) |
Race in Dwight
The most populous races in Dwight are White / Caucasian (3,436 | 90.1%), Hispanic or Latino (351 | 9.2%), and Some other Race (193 | 5.1%).
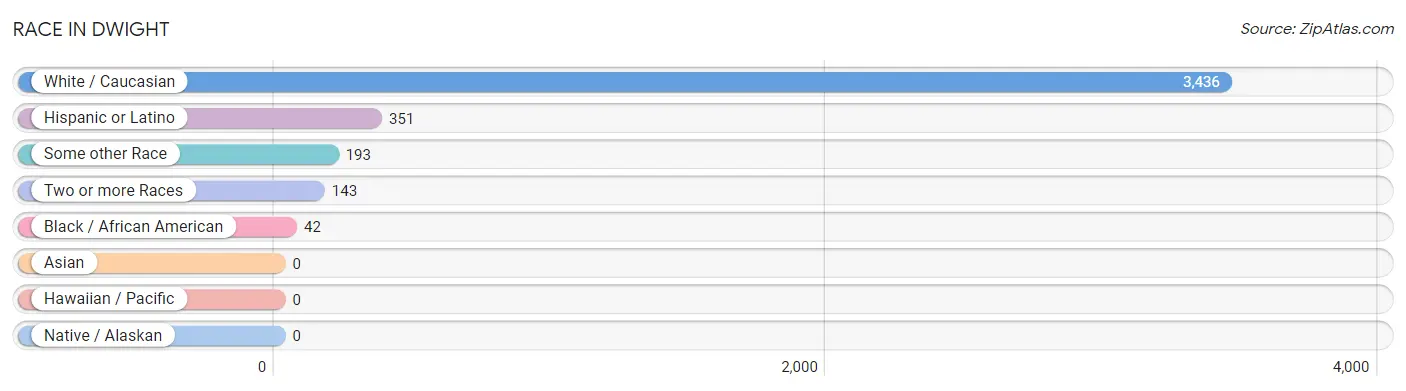
| Race | # Population | % Population |
| Asian | 0 | 0.0% |
| Black / African American | 42 | 1.1% |
| Hawaiian / Pacific | 0 | 0.0% |
| Hispanic or Latino | 351 | 9.2% |
| Native / Alaskan | 0 | 0.0% |
| White / Caucasian | 3,436 | 90.1% |
| Two or more Races | 143 | 3.7% |
| Some other Race | 193 | 5.1% |
| Total | 3,814 | 100.0% |
Ancestry in Dwight
The most populous ancestries reported in Dwight are German (955 | 25.0%), Irish (727 | 19.1%), English (451 | 11.8%), Mexican (316 | 8.3%), and Italian (282 | 7.4%), together accounting for 71.6% of all Dwight residents.
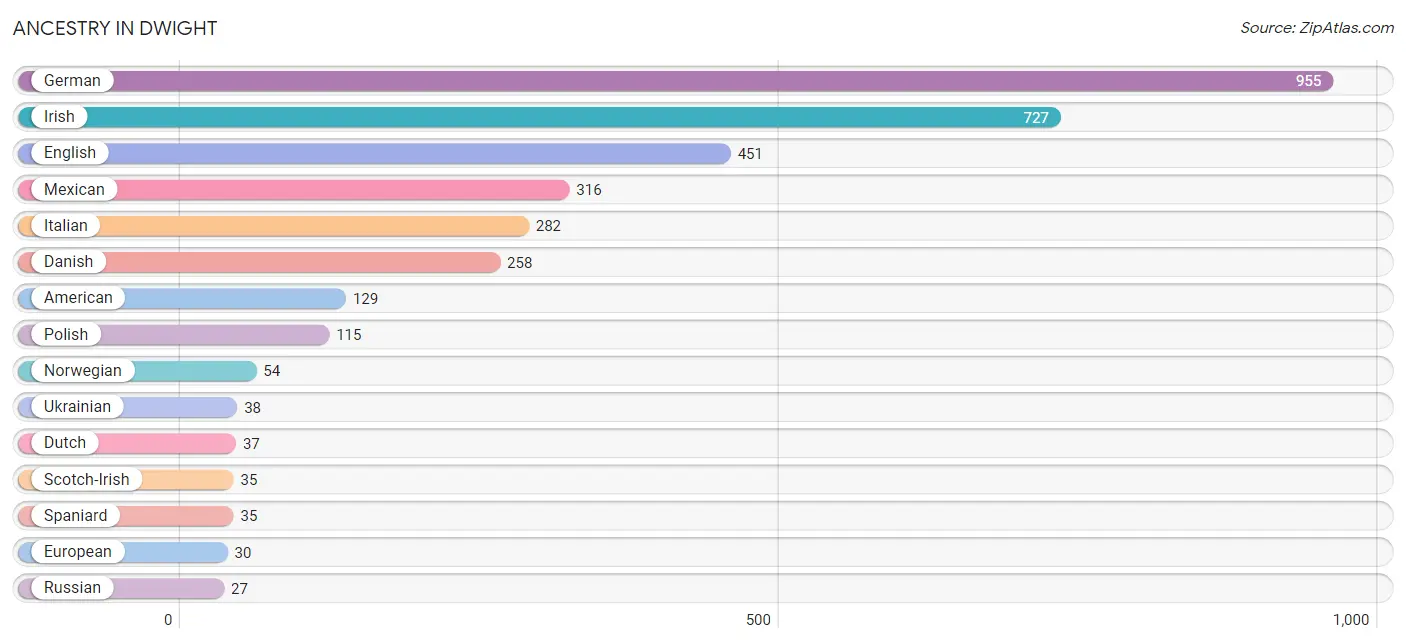
| Ancestry | # Population | % Population |
| Albanian | 12 | 0.3% |
| American | 129 | 3.4% |
| Arab | 6 | 0.2% |
| Austrian | 10 | 0.3% |
| British | 12 | 0.3% |
| Czech | 2 | 0.1% |
| Danish | 258 | 6.8% |
| Dutch | 37 | 1.0% |
| Eastern European | 9 | 0.2% |
| English | 451 | 11.8% |
| European | 30 | 0.8% |
| French | 26 | 0.7% |
| French Canadian | 9 | 0.2% |
| German | 955 | 25.0% |
| Irish | 727 | 19.1% |
| Italian | 282 | 7.4% |
| Lebanese | 6 | 0.2% |
| Mexican | 316 | 8.3% |
| Norwegian | 54 | 1.4% |
| Polish | 115 | 3.0% |
| Russian | 27 | 0.7% |
| Scotch-Irish | 35 | 0.9% |
| Scottish | 20 | 0.5% |
| Slovak | 12 | 0.3% |
| Slovene | 4 | 0.1% |
| Spaniard | 35 | 0.9% |
| Swedish | 21 | 0.5% |
| Swiss | 11 | 0.3% |
| Ukrainian | 38 | 1.0% | View All 29 Rows |
Immigrants in Dwight
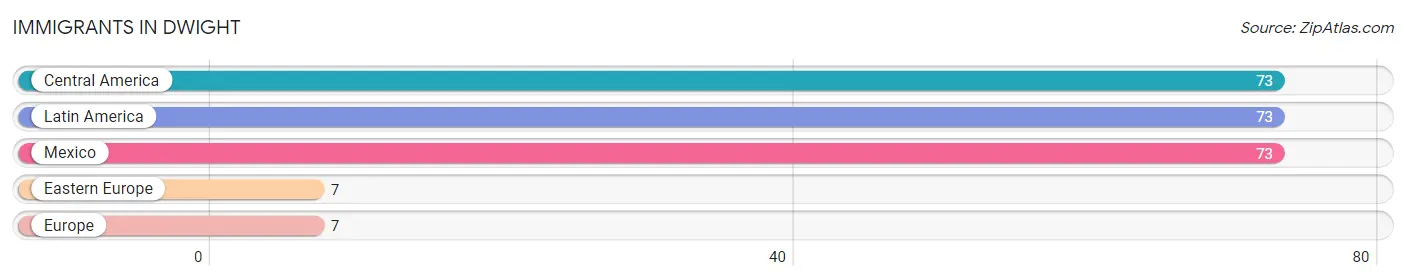
The most numerous immigrant groups reported in Dwight came from Central America (73 | 1.9%), Latin America (73 | 1.9%), Mexico (73 | 1.9%), Eastern Europe (7 | 0.2%), and Europe (7 | 0.2%), together accounting for 6.1% of all Dwight residents.
| Immigration Origin | # Population | % Population |
| Central America | 73 | 1.9% |
| Eastern Europe | 7 | 0.2% |
| Europe | 7 | 0.2% |
| Latin America | 73 | 1.9% |
| Mexico | 73 | 1.9% | View All 5 Rows |
Sex and Age in Dwight
Sex and Age in Dwight
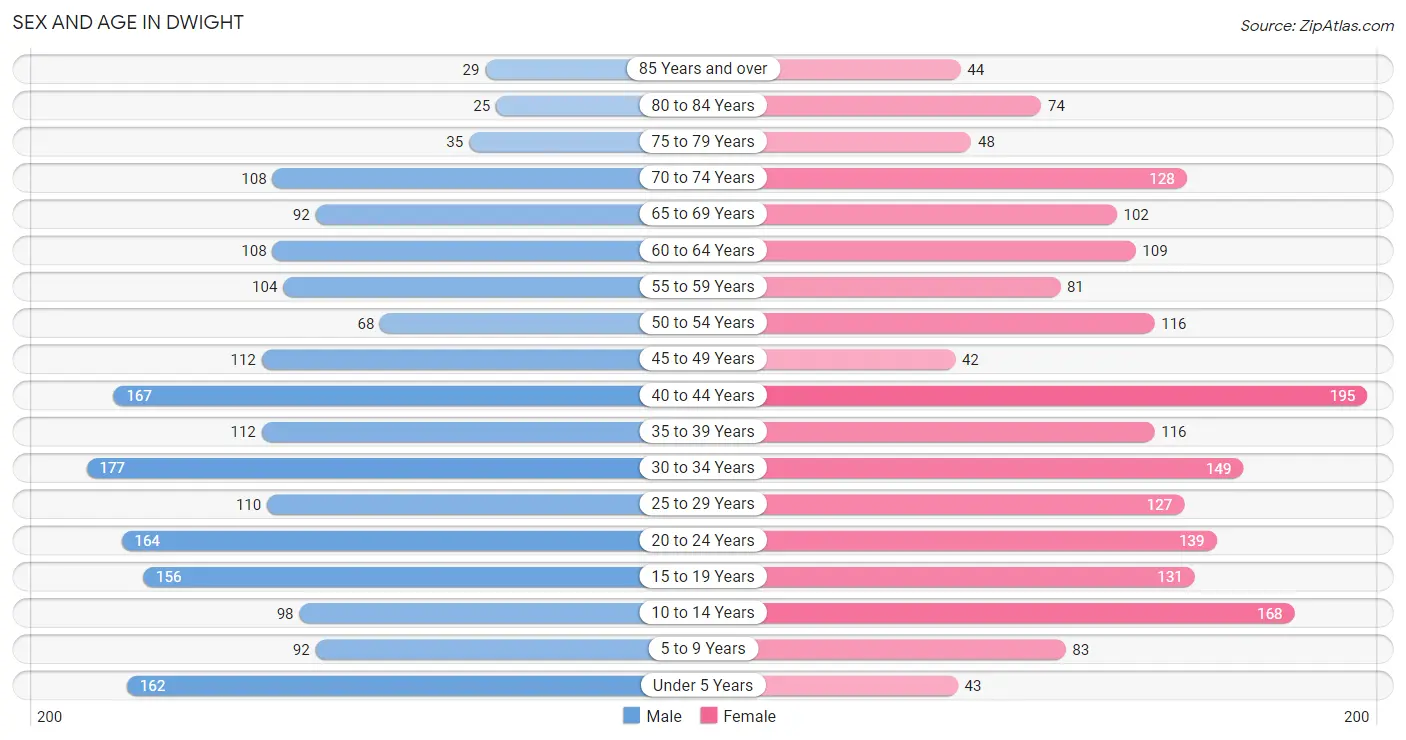
The most populous age groups in Dwight are 30 to 34 Years (177 | 9.2%) for men and 40 to 44 Years (195 | 10.3%) for women.
| Age Bracket | Male | Female |
| Under 5 Years | 162 (8.4%) | 43 (2.3%) |
| 5 to 9 Years | 92 (4.8%) | 83 (4.4%) |
| 10 to 14 Years | 98 (5.1%) | 168 (8.9%) |
| 15 to 19 Years | 156 (8.1%) | 131 (6.9%) |
| 20 to 24 Years | 164 (8.6%) | 139 (7.3%) |
| 25 to 29 Years | 110 (5.7%) | 127 (6.7%) |
| 30 to 34 Years | 177 (9.2%) | 149 (7.9%) |
| 35 to 39 Years | 112 (5.8%) | 116 (6.1%) |
| 40 to 44 Years | 167 (8.7%) | 195 (10.3%) |
| 45 to 49 Years | 112 (5.8%) | 42 (2.2%) |
| 50 to 54 Years | 68 (3.5%) | 116 (6.1%) |
| 55 to 59 Years | 104 (5.4%) | 81 (4.3%) |
| 60 to 64 Years | 108 (5.6%) | 109 (5.8%) |
| 65 to 69 Years | 92 (4.8%) | 102 (5.4%) |
| 70 to 74 Years | 108 (5.6%) | 128 (6.8%) |
| 75 to 79 Years | 35 (1.8%) | 48 (2.5%) |
| 80 to 84 Years | 25 (1.3%) | 74 (3.9%) |
| 85 Years and over | 29 (1.5%) | 44 (2.3%) |
| Total | 1,919 (100.0%) | 1,895 (100.0%) |
Families and Households in Dwight
Median Family Size in Dwight
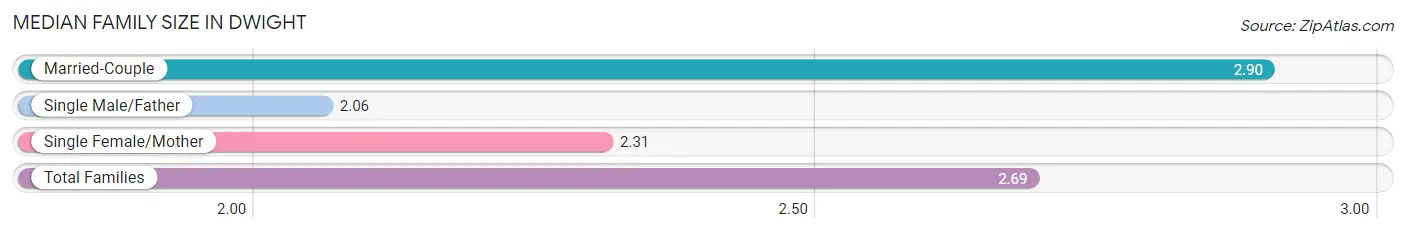
The median family size in Dwight is 2.69 persons per family, with married-couple families (737 | 68.2%) accounting for the largest median family size of 2.9 persons per family. On the other hand, single male/father families (84 | 7.8%) represent the smallest median family size with 2.06 persons per family.
| Family Type | # Families | Family Size |
| Married-Couple | 737 (68.2%) | 2.90 |
| Single Male/Father | 84 (7.8%) | 2.06 |
| Single Female/Mother | 259 (24.0%) | 2.31 |
| Total Families | 1,080 (100.0%) | 2.69 |
Median Household Size in Dwight
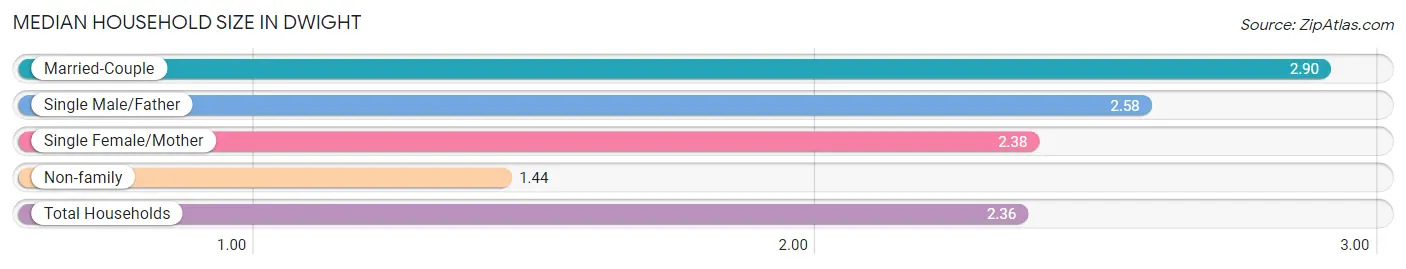
The median household size in Dwight is 2.36 persons per household, with married-couple households (737 | 47.8%) accounting for the largest median household size of 2.9 persons per household. non-family households (462 | 30.0%) represent the smallest median household size with 1.44 persons per household.
| Household Type | # Households | Household Size |
| Married-Couple | 737 (47.8%) | 2.90 |
| Single Male/Father | 84 (5.4%) | 2.58 |
| Single Female/Mother | 259 (16.8%) | 2.38 |
| Non-family | 462 (30.0%) | 1.44 |
| Total Households | 1,542 (100.0%) | 2.36 |
Household Size by Marriage Status in Dwight
Out of a total of 1,542 households in Dwight, 1,080 (70.0%) are family households, while 462 (30.0%) are nonfamily households. The most numerous type of family households are 2-person households, comprising 620, and the most common type of nonfamily households are 1-person households, comprising 330.
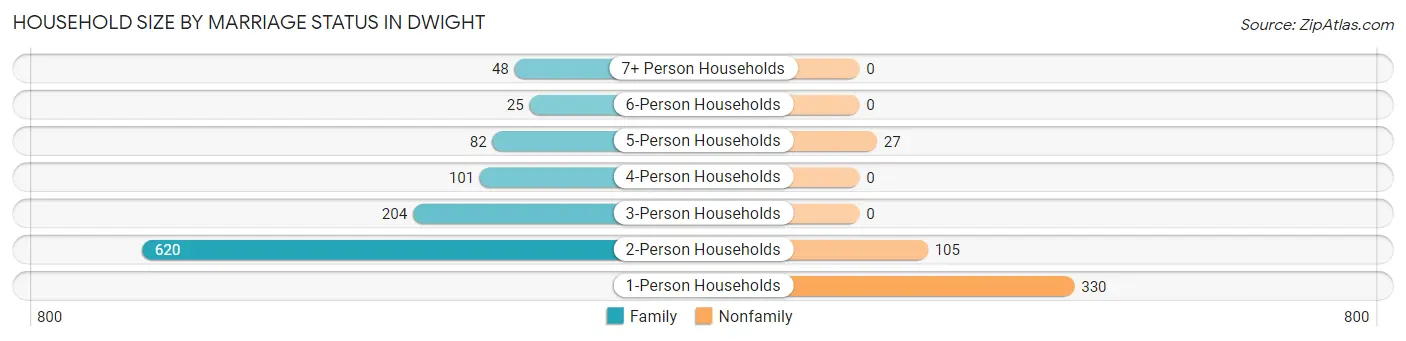
| Household Size | Family Households | Nonfamily Households |
| 1-Person Households | - | 330 (21.4%) |
| 2-Person Households | 620 (40.2%) | 105 (6.8%) |
| 3-Person Households | 204 (13.2%) | 0 (0.0%) |
| 4-Person Households | 101 (6.6%) | 0 (0.0%) |
| 5-Person Households | 82 (5.3%) | 27 (1.8%) |
| 6-Person Households | 25 (1.6%) | 0 (0.0%) |
| 7+ Person Households | 48 (3.1%) | 0 (0.0%) |
| Total | 1,080 (70.0%) | 462 (30.0%) |
Female Fertility in Dwight
Fertility by Age in Dwight
Average fertility rate in Dwight is 63.0 births per 1,000 women. Women in the age bracket of 15 to 19 years have the highest fertility rate with 145.0 births per 1,000 women. Women in the age bracket of 20 to 34 years acount for 66.7% of all women with births.
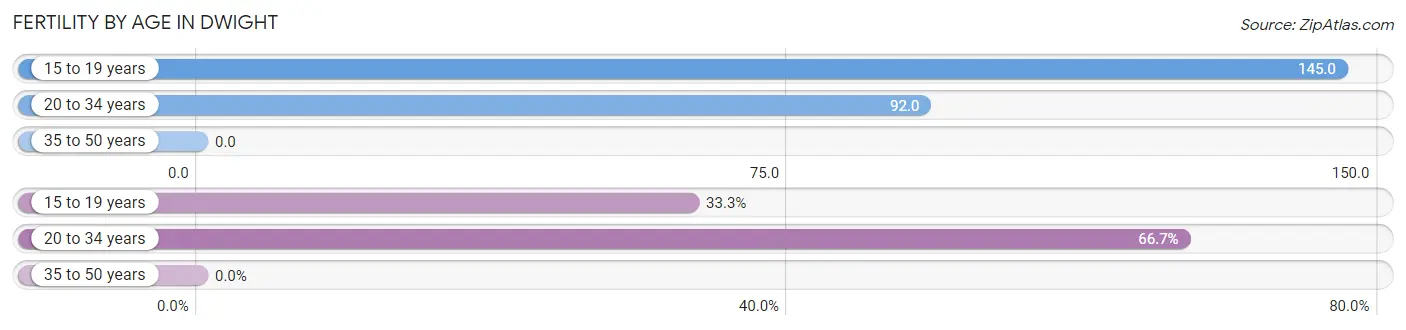
| Age Bracket | Women with Births | Births / 1,000 Women |
| 15 to 19 years | 19 (33.3%) | 145.0 |
| 20 to 34 years | 38 (66.7%) | 92.0 |
| 35 to 50 years | 0 (0.0%) | 0.0 |
| Total | 57 (100.0%) | 63.0 |
Fertility by Age by Marriage Status in Dwight
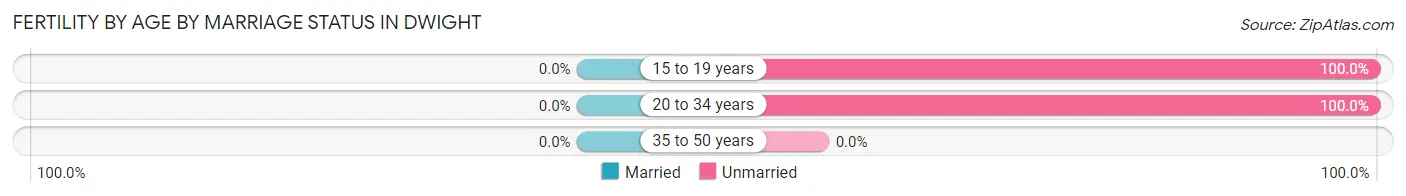
| Age Bracket | Married | Unmarried |
| 15 to 19 years | 0 (0.0%) | 19 (100.0%) |
| 20 to 34 years | 0 (0.0%) | 38 (100.0%) |
| 35 to 50 years | 0 (0.0%) | 0 (0.0%) |
| Total | 0 (0.0%) | 57 (100.0%) |
Fertility by Education in Dwight
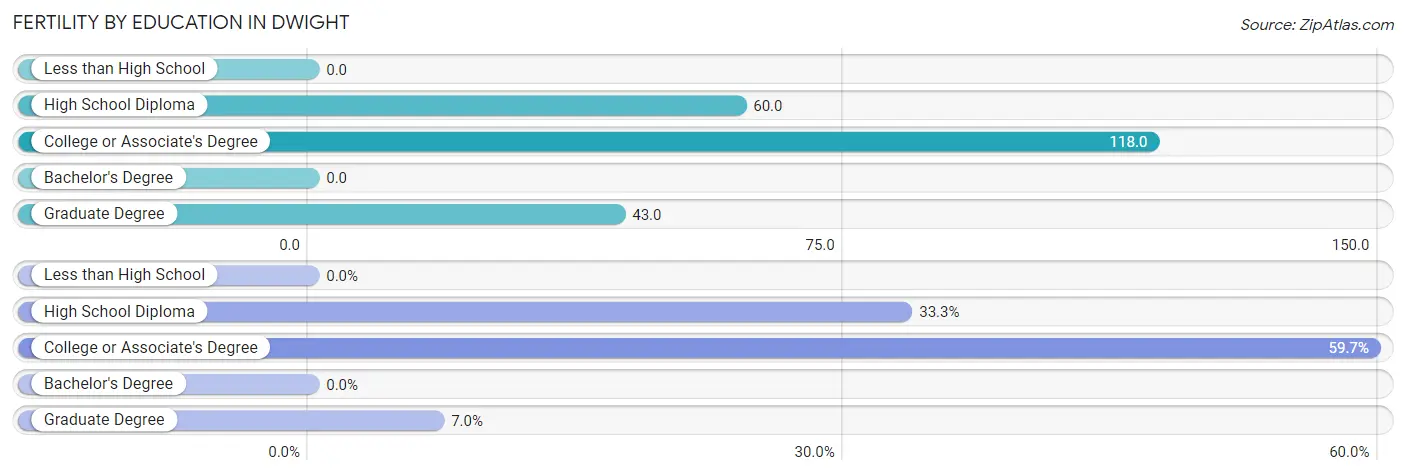
| Educational Attainment | Women with Births | Births / 1,000 Women |
| Less than High School | 0 (0.0%) | 0.0 |
| High School Diploma | 19 (33.3%) | 60.0 |
| College or Associate's Degree | 34 (59.7%) | 118.0 |
| Bachelor's Degree | 0 (0.0%) | 0.0 |
| Graduate Degree | 4 (7.0%) | 43.0 |
| Total | 57 (100.0%) | 63.0 |
Fertility by Education by Marriage Status in Dwight
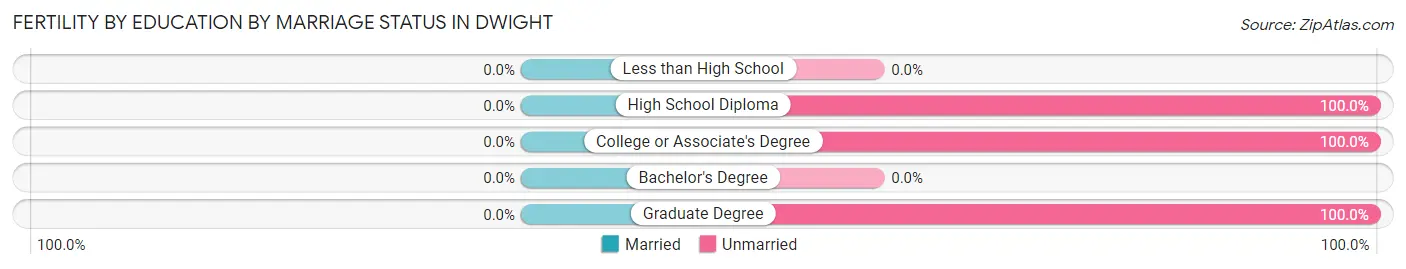
| Educational Attainment | Married | Unmarried |
| Less than High School | 0 (0.0%) | 0 (0.0%) |
| High School Diploma | 0 (0.0%) | 19 (100.0%) |
| College or Associate's Degree | 0 (0.0%) | 34 (100.0%) |
| Bachelor's Degree | 0 (0.0%) | 0 (0.0%) |
| Graduate Degree | 0 (0.0%) | 4 (100.0%) |
| Total | 0 (0.0%) | 57 (100.0%) |
Employment Characteristics in Dwight
Employment by Class of Employer in Dwight
Among the 1,934 employed individuals in Dwight, private company employees (1,523 | 78.7%), local government employees (199 | 10.3%), and not-for-profit organizations (83 | 4.3%) make up the most common classes of employment.
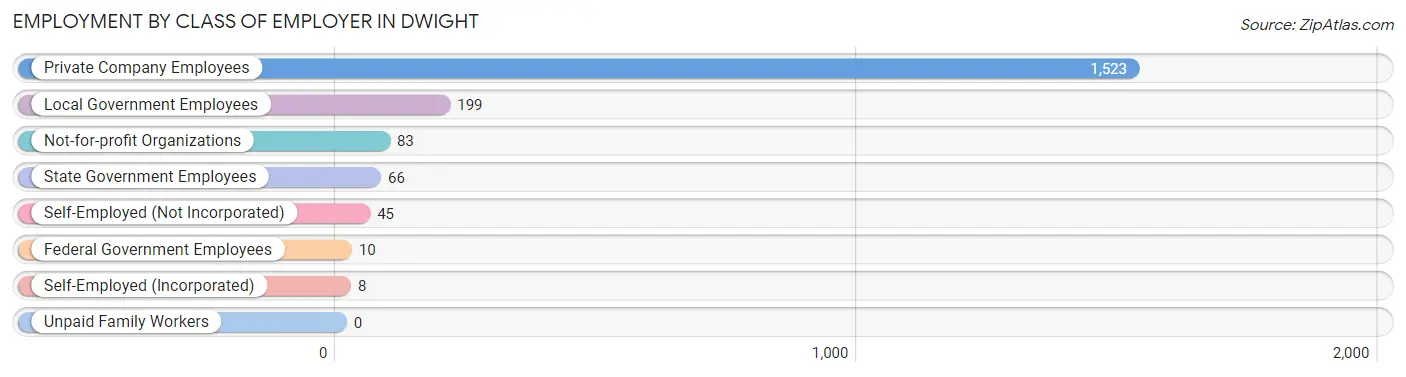
| Employer Class | # Employees | % Employees |
| Private Company Employees | 1,523 | 78.7% |
| Self-Employed (Incorporated) | 8 | 0.4% |
| Self-Employed (Not Incorporated) | 45 | 2.3% |
| Not-for-profit Organizations | 83 | 4.3% |
| Local Government Employees | 199 | 10.3% |
| State Government Employees | 66 | 3.4% |
| Federal Government Employees | 10 | 0.5% |
| Unpaid Family Workers | 0 | 0.0% |
| Total | 1,934 | 100.0% |
Employment Status by Age in Dwight
According to the labor force statistics for Dwight, out of the total population over 16 years of age (3,147), 65.3% or 2,055 individuals are in the labor force, with 1.7% or 35 of them unemployed. The age group with the highest labor force participation rate is 30 to 34 years, with 96.6% or 315 individuals in the labor force. Within the labor force, the 60 to 64 years age range has the highest percentage of unemployed individuals, with 4.1% or 7 of them being unemployed.
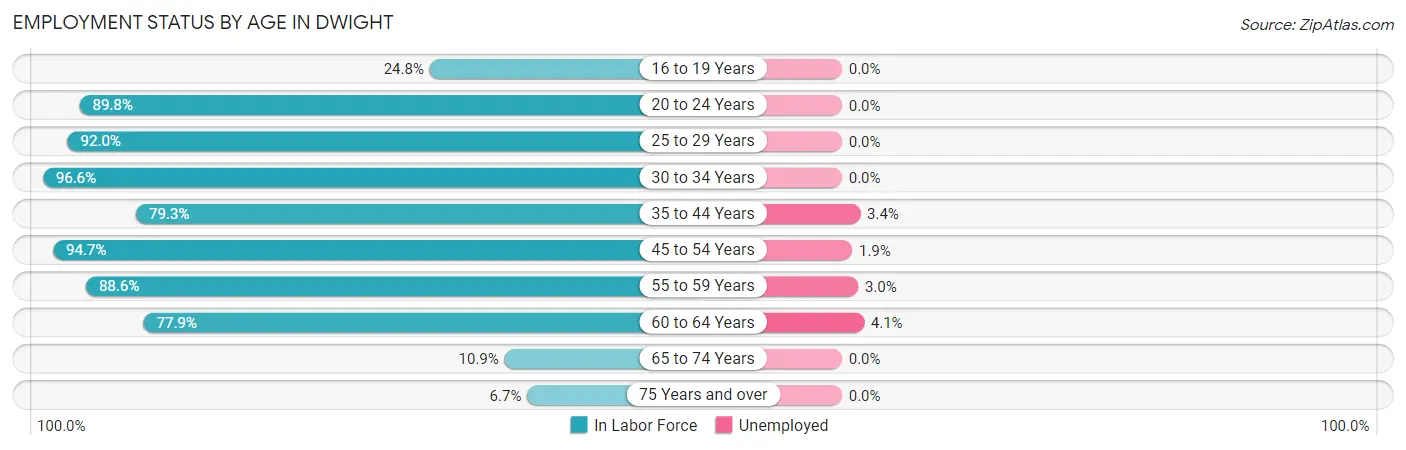
| Age Bracket | In Labor Force | Unemployed |
| 16 to 19 Years | 66 (24.8%) | 0 (0.0%) |
| 20 to 24 Years | 272 (89.8%) | 0 (0.0%) |
| 25 to 29 Years | 218 (92.0%) | 0 (0.0%) |
| 30 to 34 Years | 315 (96.6%) | 0 (0.0%) |
| 35 to 44 Years | 468 (79.3%) | 16 (3.4%) |
| 45 to 54 Years | 320 (94.7%) | 6 (1.9%) |
| 55 to 59 Years | 164 (88.6%) | 5 (3.0%) |
| 60 to 64 Years | 169 (77.9%) | 7 (4.1%) |
| 65 to 74 Years | 47 (10.9%) | 0 (0.0%) |
| 75 Years and over | 17 (6.7%) | 0 (0.0%) |
| Total | 2,055 (65.3%) | 35 (1.7%) |
Employment Status by Educational Attainment in Dwight
According to labor force statistics for Dwight, 87.4% of individuals (1,654) out of the total population between 25 and 64 years of age (1,893) are in the labor force, with 2.1% or 35 of them being unemployed. The group with the highest labor force participation rate are those with the educational attainment of bachelor's degree or higher, with 97.6% or 360 individuals in the labor force. Within the labor force, individuals with college / associate degree education have the highest percentage of unemployment, with 2.7% or 16 of them being unemployed.
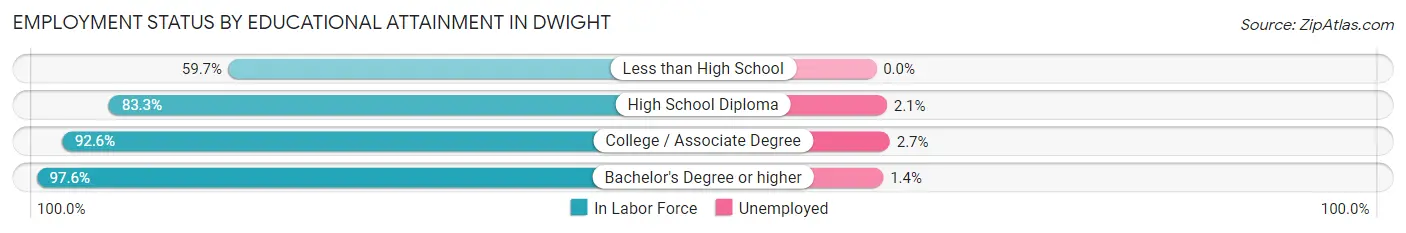
| Educational Attainment | In Labor Force | Unemployed |
| Less than High School | 89 (59.7%) | 0 (0.0%) |
| High School Diploma | 607 (83.3%) | 15 (2.1%) |
| College / Associate Degree | 598 (92.6%) | 17 (2.7%) |
| Bachelor's Degree or higher | 360 (97.6%) | 5 (1.4%) |
| Total | 1,654 (87.4%) | 40 (2.1%) |
Employment Occupations by Sex in Dwight
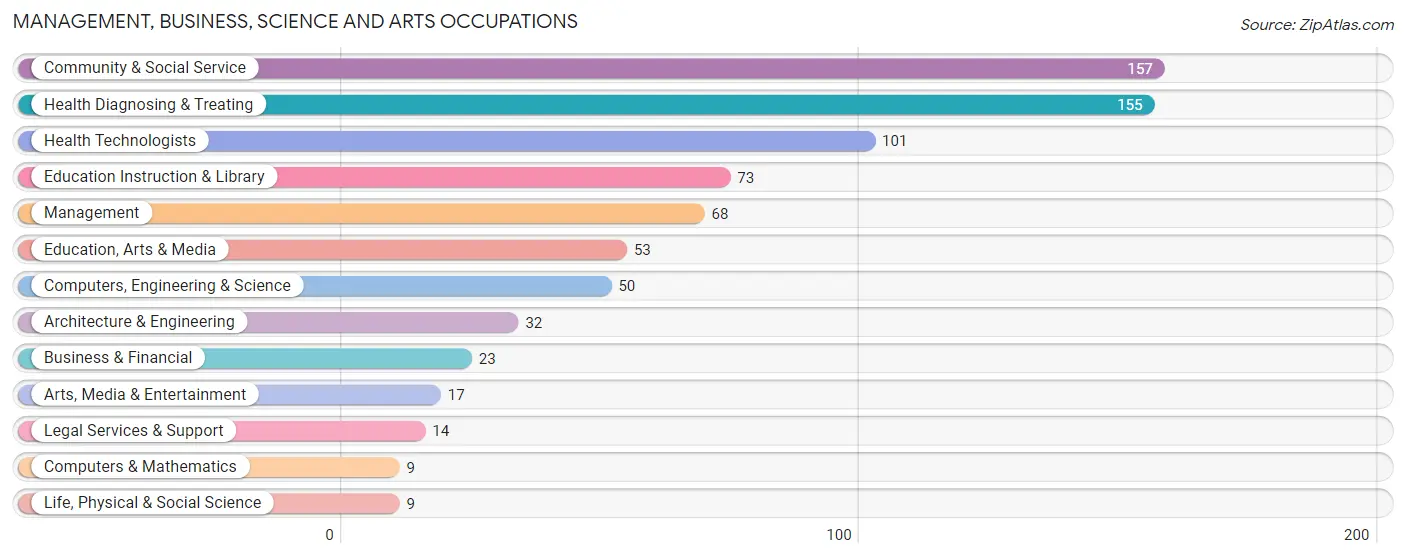
Management, Business, Science and Arts Occupations
The most common Management, Business, Science and Arts occupations in Dwight are Community & Social Service (157 | 7.8%), Health Diagnosing & Treating (155 | 7.7%), Health Technologists (101 | 5.0%), Education Instruction & Library (73 | 3.6%), and Management (68 | 3.4%).
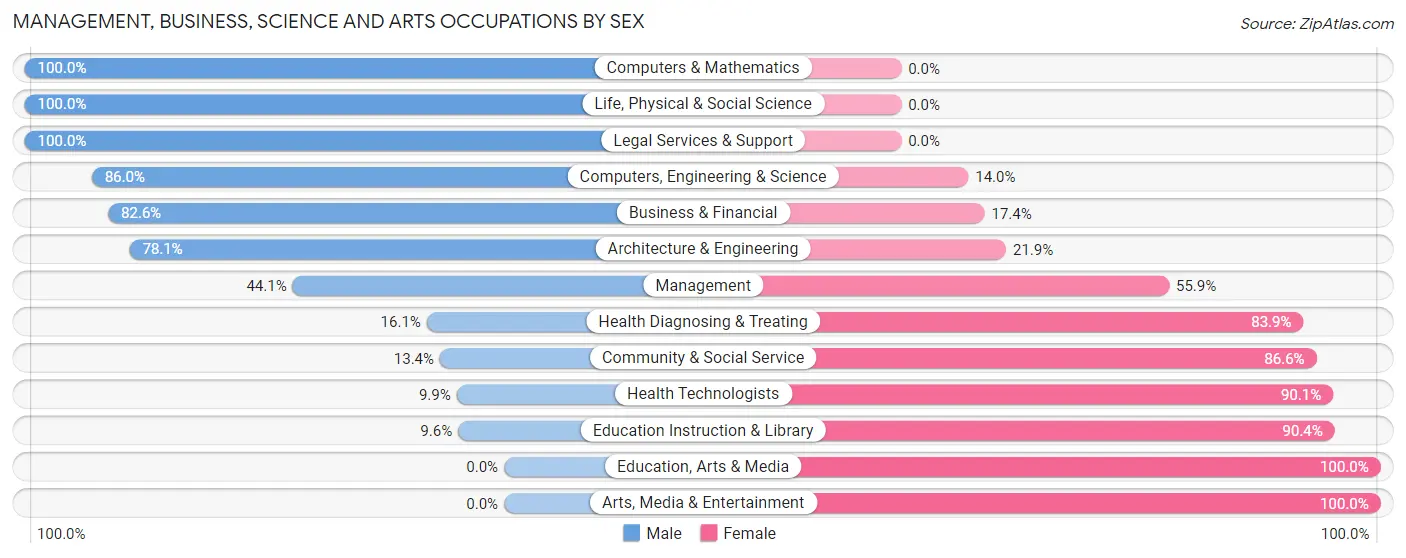
Management, Business, Science and Arts Occupations by Sex
Within the Management, Business, Science and Arts occupations in Dwight, the most male-oriented occupations are Computers & Mathematics (100.0%), Life, Physical & Social Science (100.0%), and Legal Services & Support (100.0%), while the most female-oriented occupations are Education, Arts & Media (100.0%), Arts, Media & Entertainment (100.0%), and Education Instruction & Library (90.4%).
| Occupation | Male | Female |
| Management | 30 (44.1%) | 38 (55.9%) |
| Business & Financial | 19 (82.6%) | 4 (17.4%) |
| Computers, Engineering & Science | 43 (86.0%) | 7 (14.0%) |
| Computers & Mathematics | 9 (100.0%) | 0 (0.0%) |
| Architecture & Engineering | 25 (78.1%) | 7 (21.9%) |
| Life, Physical & Social Science | 9 (100.0%) | 0 (0.0%) |
| Community & Social Service | 21 (13.4%) | 136 (86.6%) |
| Education, Arts & Media | 0 (0.0%) | 53 (100.0%) |
| Legal Services & Support | 14 (100.0%) | 0 (0.0%) |
| Education Instruction & Library | 7 (9.6%) | 66 (90.4%) |
| Arts, Media & Entertainment | 0 (0.0%) | 17 (100.0%) |
| Health Diagnosing & Treating | 25 (16.1%) | 130 (83.9%) |
| Health Technologists | 10 (9.9%) | 91 (90.1%) |
| Total (Category) | 138 (30.5%) | 315 (69.5%) |
| Total (Overall) | 1,064 (52.6%) | 958 (47.4%) |
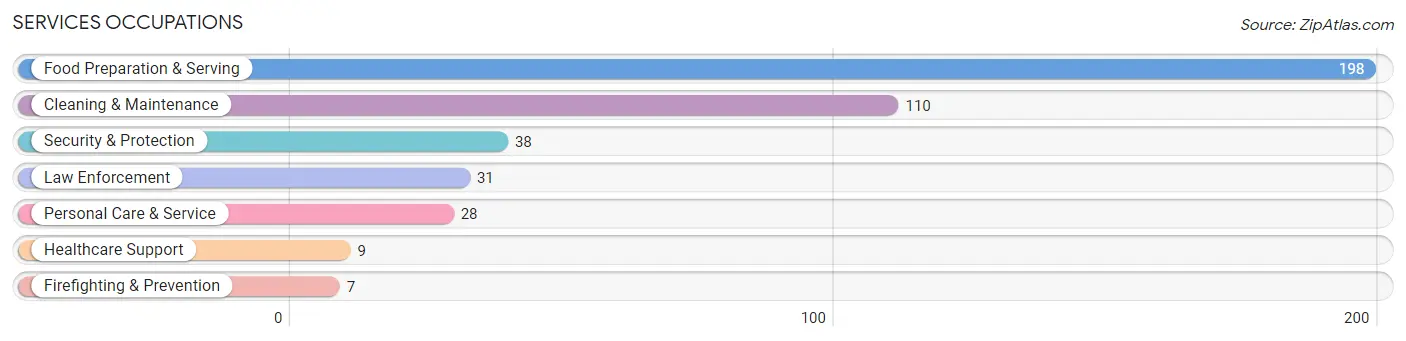
Services Occupations
The most common Services occupations in Dwight are Food Preparation & Serving (198 | 9.8%), Cleaning & Maintenance (110 | 5.4%), Security & Protection (38 | 1.9%), Law Enforcement (31 | 1.5%), and Personal Care & Service (28 | 1.4%).
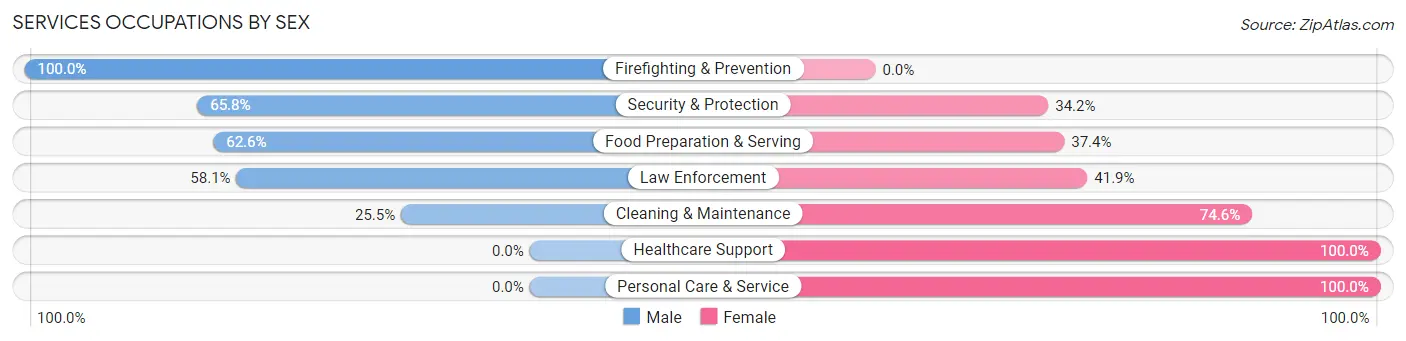
Services Occupations by Sex
Within the Services occupations in Dwight, the most male-oriented occupations are Firefighting & Prevention (100.0%), Security & Protection (65.8%), and Food Preparation & Serving (62.6%), while the most female-oriented occupations are Healthcare Support (100.0%), Personal Care & Service (100.0%), and Cleaning & Maintenance (74.6%).
| Occupation | Male | Female |
| Healthcare Support | 0 (0.0%) | 9 (100.0%) |
| Security & Protection | 25 (65.8%) | 13 (34.2%) |
| Firefighting & Prevention | 7 (100.0%) | 0 (0.0%) |
| Law Enforcement | 18 (58.1%) | 13 (41.9%) |
| Food Preparation & Serving | 124 (62.6%) | 74 (37.4%) |
| Cleaning & Maintenance | 28 (25.5%) | 82 (74.6%) |
| Personal Care & Service | 0 (0.0%) | 28 (100.0%) |
| Total (Category) | 177 (46.2%) | 206 (53.8%) |
| Total (Overall) | 1,064 (52.6%) | 958 (47.4%) |
Sales and Office Occupations
The most common Sales and Office occupations in Dwight are Sales & Related (239 | 11.8%), and Office & Administration (181 | 8.9%).
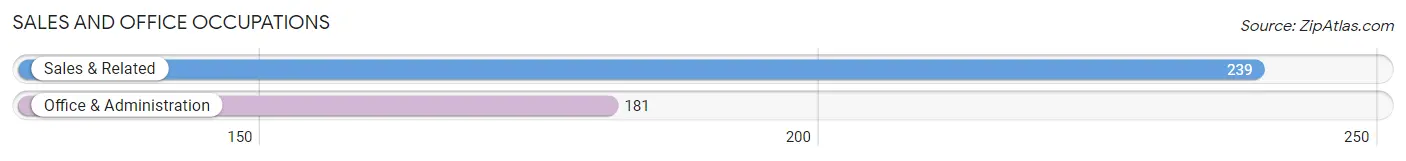
Sales and Office Occupations by Sex
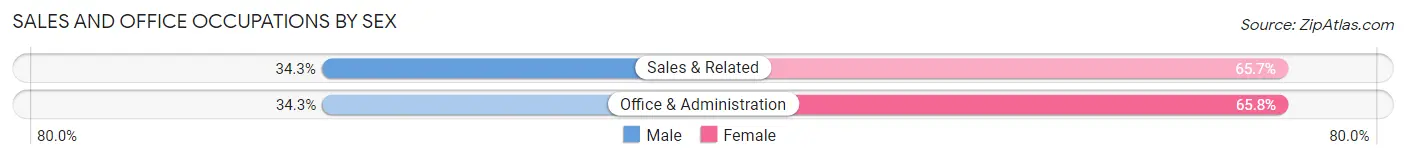
| Occupation | Male | Female |
| Sales & Related | 82 (34.3%) | 157 (65.7%) |
| Office & Administration | 62 (34.3%) | 119 (65.7%) |
| Total (Category) | 144 (34.3%) | 276 (65.7%) |
| Total (Overall) | 1,064 (52.6%) | 958 (47.4%) |
Natural Resources, Construction and Maintenance Occupations
The most common Natural Resources, Construction and Maintenance occupations in Dwight are Construction & Extraction (162 | 8.0%), and Installation, Maintenance & Repair (40 | 2.0%).
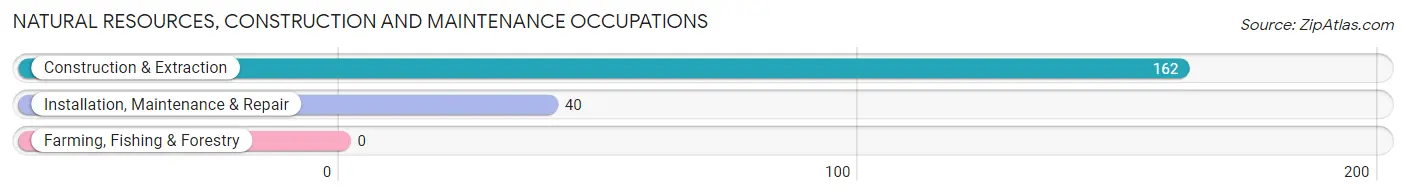
Natural Resources, Construction and Maintenance Occupations by Sex
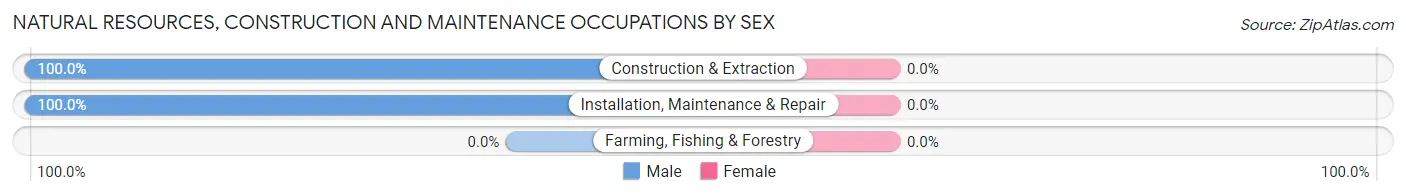
| Occupation | Male | Female |
| Farming, Fishing & Forestry | 0 (0.0%) | 0 (0.0%) |
| Construction & Extraction | 162 (100.0%) | 0 (0.0%) |
| Installation, Maintenance & Repair | 40 (100.0%) | 0 (0.0%) |
| Total (Category) | 202 (100.0%) | 0 (0.0%) |
| Total (Overall) | 1,064 (52.6%) | 958 (47.4%) |
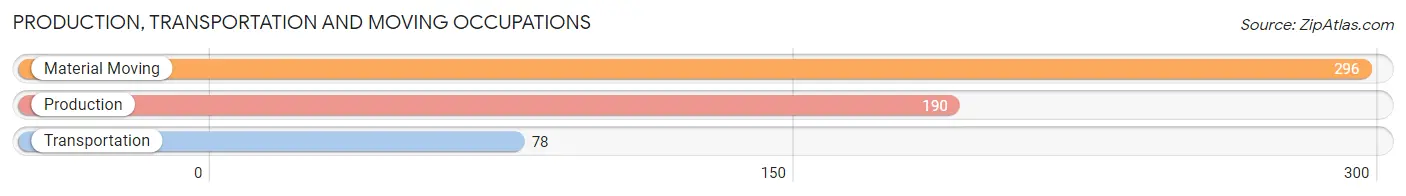
Production, Transportation and Moving Occupations
The most common Production, Transportation and Moving occupations in Dwight are Material Moving (296 | 14.6%), Production (190 | 9.4%), and Transportation (78 | 3.9%).
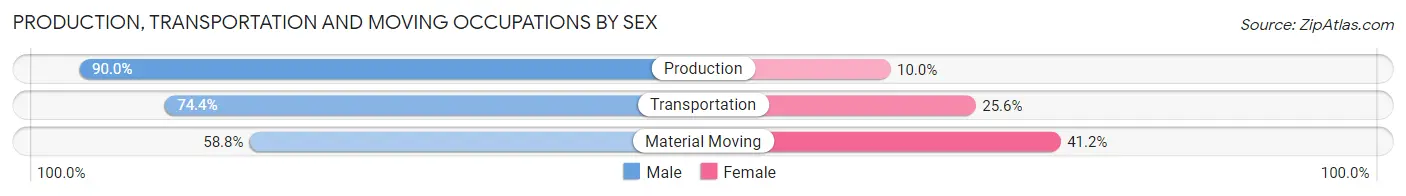
Production, Transportation and Moving Occupations by Sex
| Occupation | Male | Female |
| Production | 171 (90.0%) | 19 (10.0%) |
| Transportation | 58 (74.4%) | 20 (25.6%) |
| Material Moving | 174 (58.8%) | 122 (41.2%) |
| Total (Category) | 403 (71.5%) | 161 (28.5%) |
| Total (Overall) | 1,064 (52.6%) | 958 (47.4%) |
Employment Industries by Sex in Dwight
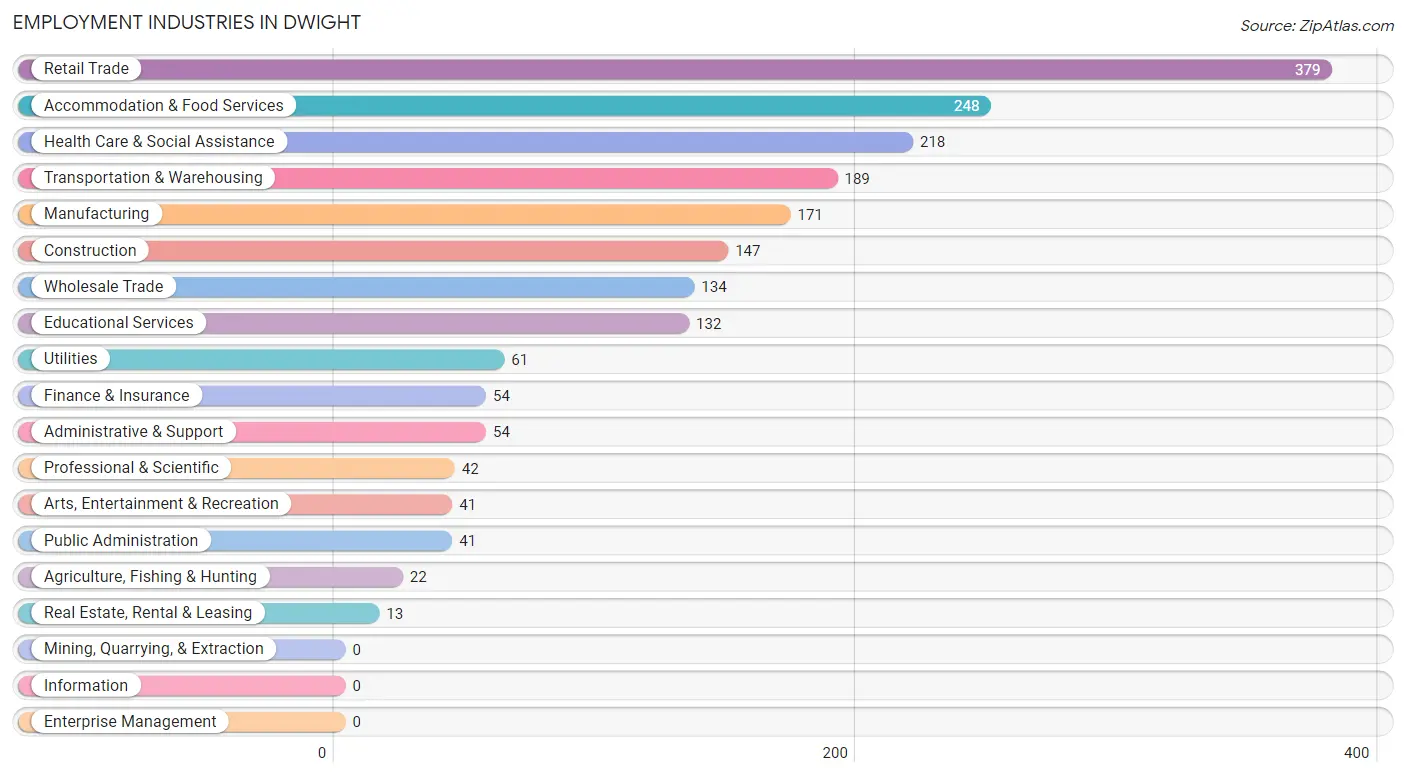
Employment Industries in Dwight
The major employment industries in Dwight include Retail Trade (379 | 18.7%), Accommodation & Food Services (248 | 12.3%), Health Care & Social Assistance (218 | 10.8%), Transportation & Warehousing (189 | 9.3%), and Manufacturing (171 | 8.5%).
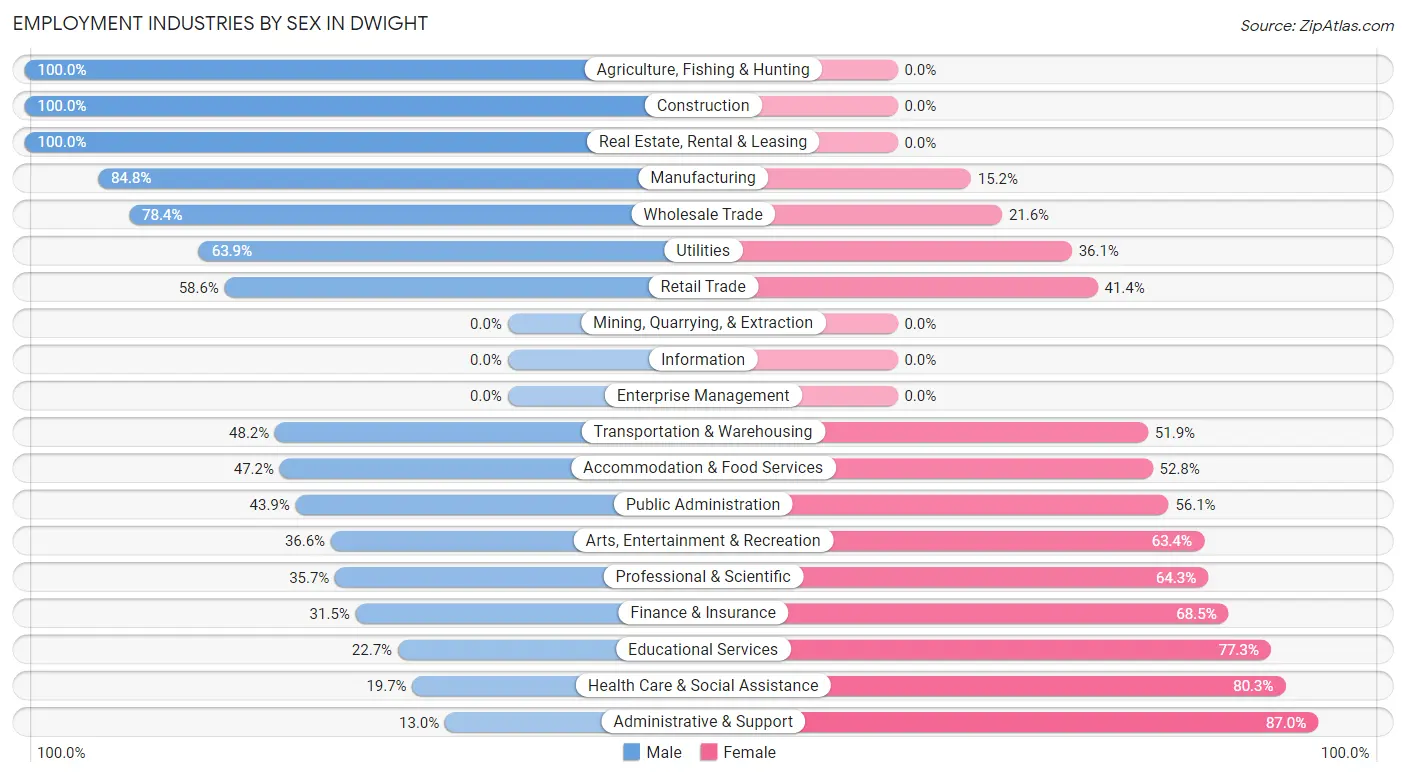
Employment Industries by Sex in Dwight
The Dwight industries that see more men than women are Agriculture, Fishing & Hunting (100.0%), Construction (100.0%), and Real Estate, Rental & Leasing (100.0%), whereas the industries that tend to have a higher number of women are Administrative & Support (87.0%), Health Care & Social Assistance (80.3%), and Educational Services (77.3%).
| Industry | Male | Female |
| Agriculture, Fishing & Hunting | 22 (100.0%) | 0 (0.0%) |
| Mining, Quarrying, & Extraction | 0 (0.0%) | 0 (0.0%) |
| Construction | 147 (100.0%) | 0 (0.0%) |
| Manufacturing | 145 (84.8%) | 26 (15.2%) |
| Wholesale Trade | 105 (78.4%) | 29 (21.6%) |
| Retail Trade | 222 (58.6%) | 157 (41.4%) |
| Transportation & Warehousing | 91 (48.1%) | 98 (51.8%) |
| Utilities | 39 (63.9%) | 22 (36.1%) |
| Information | 0 (0.0%) | 0 (0.0%) |
| Finance & Insurance | 17 (31.5%) | 37 (68.5%) |
| Real Estate, Rental & Leasing | 13 (100.0%) | 0 (0.0%) |
| Professional & Scientific | 15 (35.7%) | 27 (64.3%) |
| Enterprise Management | 0 (0.0%) | 0 (0.0%) |
| Administrative & Support | 7 (13.0%) | 47 (87.0%) |
| Educational Services | 30 (22.7%) | 102 (77.3%) |
| Health Care & Social Assistance | 43 (19.7%) | 175 (80.3%) |
| Arts, Entertainment & Recreation | 15 (36.6%) | 26 (63.4%) |
| Accommodation & Food Services | 117 (47.2%) | 131 (52.8%) |
| Public Administration | 18 (43.9%) | 23 (56.1%) |
| Total | 1,064 (52.6%) | 958 (47.4%) |
Education in Dwight
School Enrollment in Dwight
The most common levels of schooling among the 799 students in Dwight are high school (301 | 37.7%), middle school (153 | 19.2%), and elementary school (146 | 18.3%).
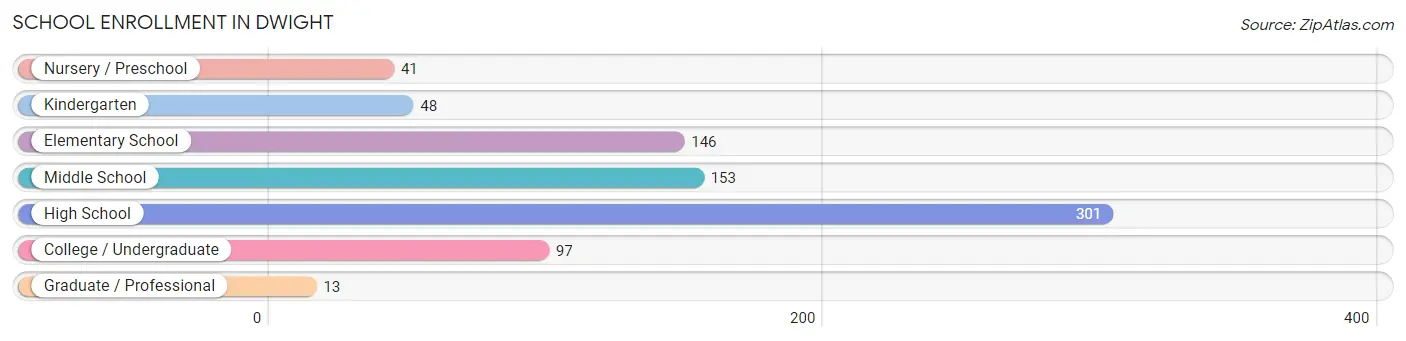
| School Level | # Students | % Students |
| Nursery / Preschool | 41 | 5.1% |
| Kindergarten | 48 | 6.0% |
| Elementary School | 146 | 18.3% |
| Middle School | 153 | 19.2% |
| High School | 301 | 37.7% |
| College / Undergraduate | 97 | 12.1% |
| Graduate / Professional | 13 | 1.6% |
| Total | 799 | 100.0% |
School Enrollment by Age by Funding Source in Dwight
Out of a total of 799 students who are enrolled in schools in Dwight, 43 (5.4%) attend a private institution, while the remaining 756 (94.6%) are enrolled in public schools. The age group of 25 to 34 year olds has the highest likelihood of being enrolled in private schools, with 9 (23.7% in the age bracket) enrolled. Conversely, the age group of 3 to 4 year olds has the lowest likelihood of being enrolled in a private school, with 41 (100.0% in the age bracket) attending a public institution.
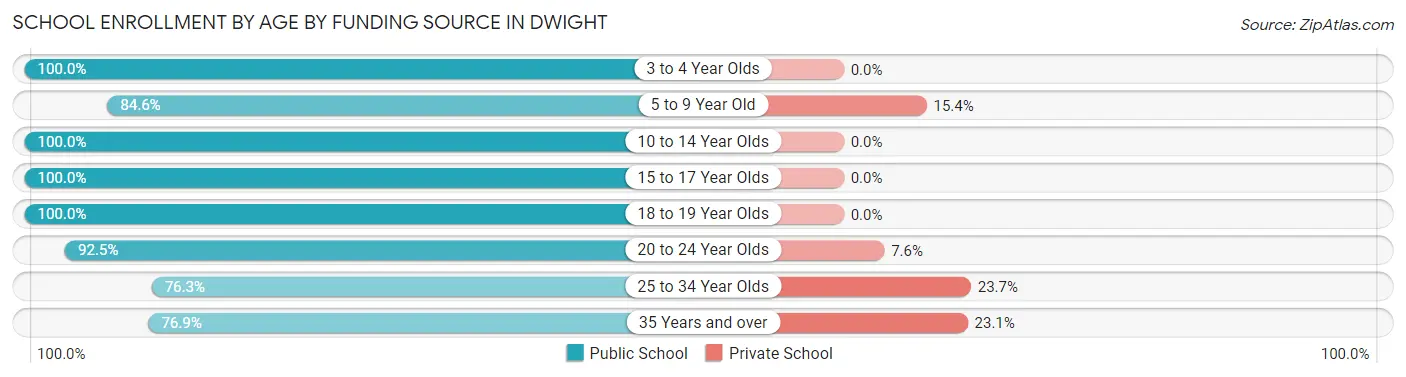
| Age Bracket | Public School | Private School |
| 3 to 4 Year Olds | 41 (100.0%) | 0 (0.0%) |
| 5 to 9 Year Old | 148 (84.6%) | 27 (15.4%) |
| 10 to 14 Year Olds | 233 (100.0%) | 0 (0.0%) |
| 15 to 17 Year Olds | 198 (100.0%) | 0 (0.0%) |
| 18 to 19 Year Olds | 48 (100.0%) | 0 (0.0%) |
| 20 to 24 Year Olds | 49 (92.4%) | 4 (7.5%) |
| 25 to 34 Year Olds | 29 (76.3%) | 9 (23.7%) |
| 35 Years and over | 10 (76.9%) | 3 (23.1%) |
| Total | 756 (94.6%) | 43 (5.4%) |
Educational Attainment by Field of Study in Dwight
Education (151 | 27.8%), science & technology (76 | 14.0%), business (72 | 13.3%), bio, nature & agricultural (60 | 11.1%), and arts & humanities (36 | 6.6%) are the most common fields of study among 543 individuals in Dwight who have obtained a bachelor's degree or higher.
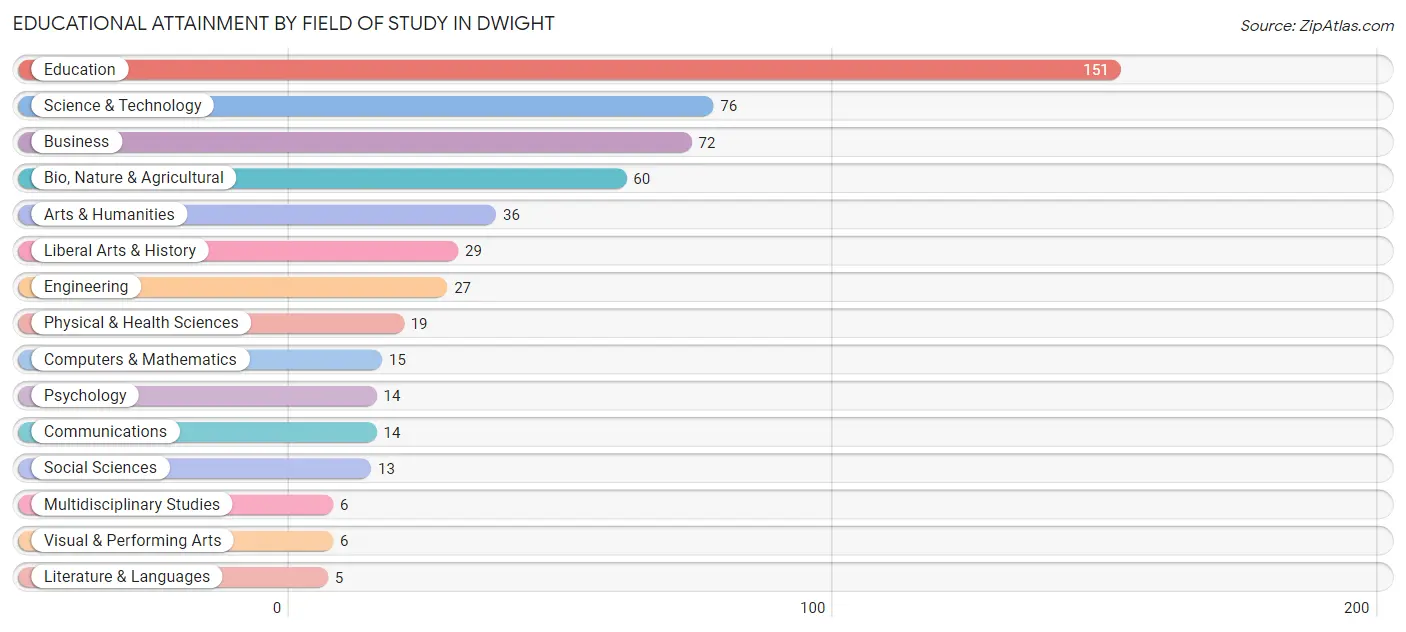
| Field of Study | # Graduates | % Graduates |
| Computers & Mathematics | 15 | 2.8% |
| Bio, Nature & Agricultural | 60 | 11.1% |
| Physical & Health Sciences | 19 | 3.5% |
| Psychology | 14 | 2.6% |
| Social Sciences | 13 | 2.4% |
| Engineering | 27 | 5.0% |
| Multidisciplinary Studies | 6 | 1.1% |
| Science & Technology | 76 | 14.0% |
| Business | 72 | 13.3% |
| Education | 151 | 27.8% |
| Literature & Languages | 5 | 0.9% |
| Liberal Arts & History | 29 | 5.3% |
| Visual & Performing Arts | 6 | 1.1% |
| Communications | 14 | 2.6% |
| Arts & Humanities | 36 | 6.6% |
| Total | 543 | 100.0% |
Transportation & Commute in Dwight
Vehicle Availability by Sex in Dwight
The most prevalent vehicle ownership categories in Dwight are males with 2 vehicles (532, accounting for 53.9%) and females with 2 vehicles (430, making up 56.2%).
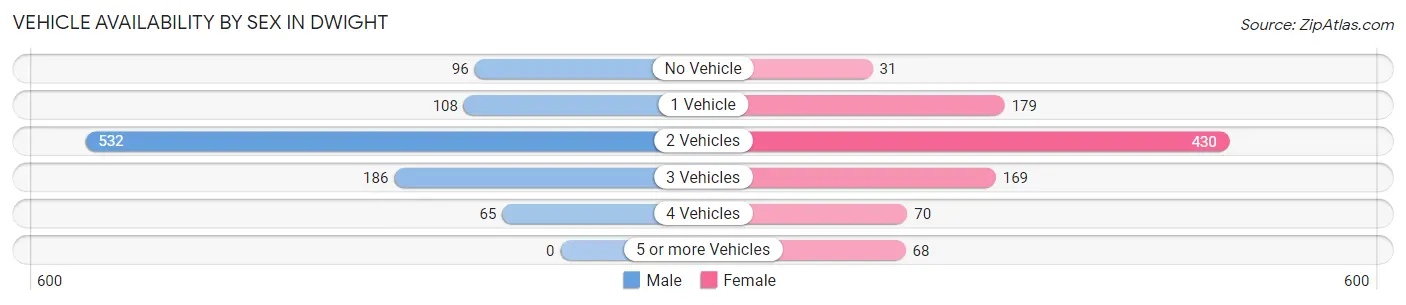
| Vehicles Available | Male | Female |
| No Vehicle | 96 (9.7%) | 31 (3.3%) |
| 1 Vehicle | 108 (10.9%) | 179 (18.9%) |
| 2 Vehicles | 532 (53.9%) | 430 (45.4%) |
| 3 Vehicles | 186 (18.8%) | 169 (17.8%) |
| 4 Vehicles | 65 (6.6%) | 70 (7.4%) |
| 5 or more Vehicles | 0 (0.0%) | 68 (7.2%) |
| Total | 987 (100.0%) | 947 (100.0%) |
Commute Time in Dwight
The most frequently occuring commute durations in Dwight are 5 to 9 minutes (323 commuters, 17.2%), 30 to 34 minutes (296 commuters, 15.8%), and 10 to 14 minutes (235 commuters, 12.5%).
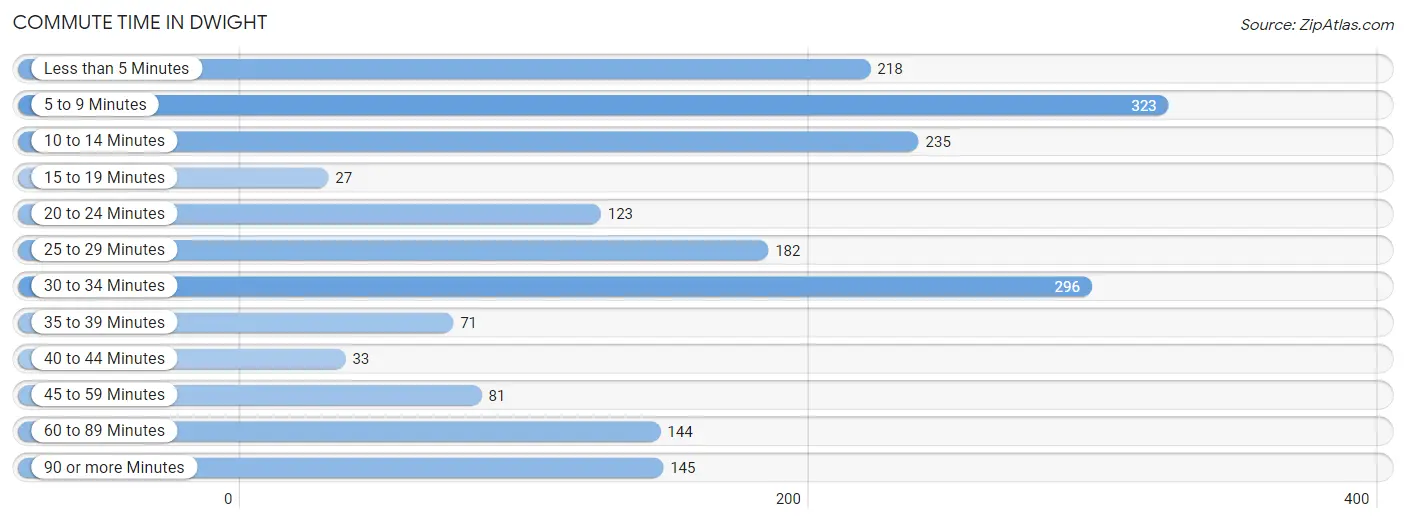
| Commute Time | # Commuters | % Commuters |
| Less than 5 Minutes | 218 | 11.6% |
| 5 to 9 Minutes | 323 | 17.2% |
| 10 to 14 Minutes | 235 | 12.5% |
| 15 to 19 Minutes | 27 | 1.4% |
| 20 to 24 Minutes | 123 | 6.6% |
| 25 to 29 Minutes | 182 | 9.7% |
| 30 to 34 Minutes | 296 | 15.8% |
| 35 to 39 Minutes | 71 | 3.8% |
| 40 to 44 Minutes | 33 | 1.8% |
| 45 to 59 Minutes | 81 | 4.3% |
| 60 to 89 Minutes | 144 | 7.7% |
| 90 or more Minutes | 145 | 7.7% |
Commute Time by Sex in Dwight
The most common commute times in Dwight are 30 to 34 minutes (176 commuters, 18.3%) for males and 5 to 9 minutes (200 commuters, 21.8%) for females.
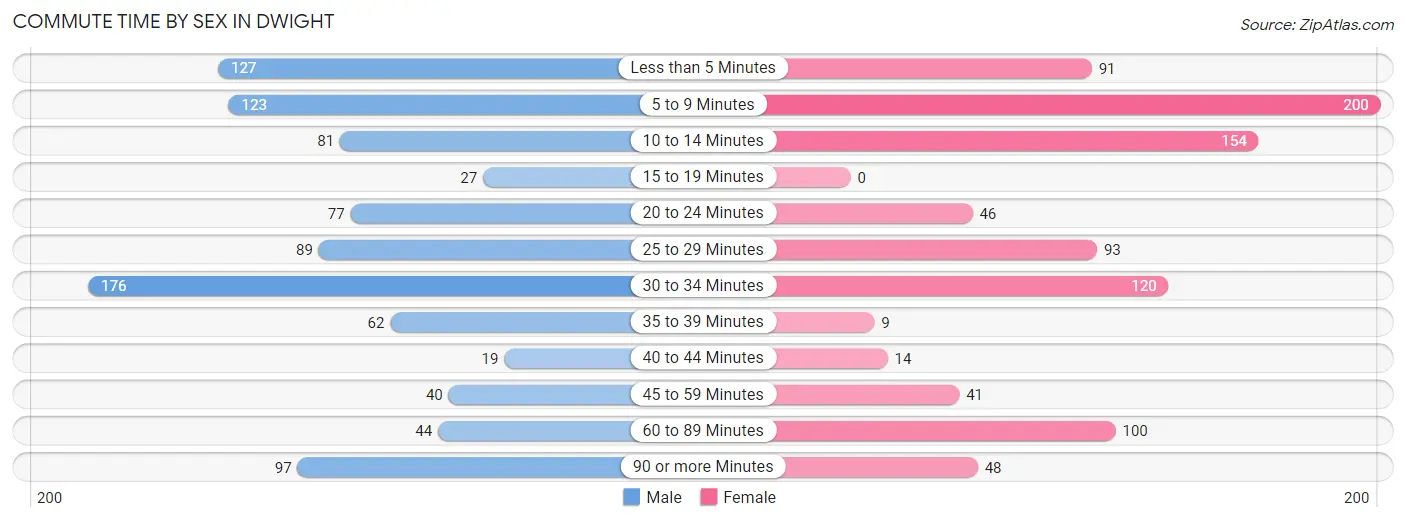
| Commute Time | Male | Female |
| Less than 5 Minutes | 127 (13.2%) | 91 (9.9%) |
| 5 to 9 Minutes | 123 (12.8%) | 200 (21.8%) |
| 10 to 14 Minutes | 81 (8.4%) | 154 (16.8%) |
| 15 to 19 Minutes | 27 (2.8%) | 0 (0.0%) |
| 20 to 24 Minutes | 77 (8.0%) | 46 (5.0%) |
| 25 to 29 Minutes | 89 (9.2%) | 93 (10.2%) |
| 30 to 34 Minutes | 176 (18.3%) | 120 (13.1%) |
| 35 to 39 Minutes | 62 (6.4%) | 9 (1.0%) |
| 40 to 44 Minutes | 19 (2.0%) | 14 (1.5%) |
| 45 to 59 Minutes | 40 (4.2%) | 41 (4.5%) |
| 60 to 89 Minutes | 44 (4.6%) | 100 (10.9%) |
| 90 or more Minutes | 97 (10.1%) | 48 (5.2%) |
Time of Departure to Work by Sex in Dwight
The most frequent times of departure to work in Dwight are 6:30 AM to 6:59 AM (165, 17.2%) for males and 12:00 AM to 4:59 AM (136, 14.8%) for females.
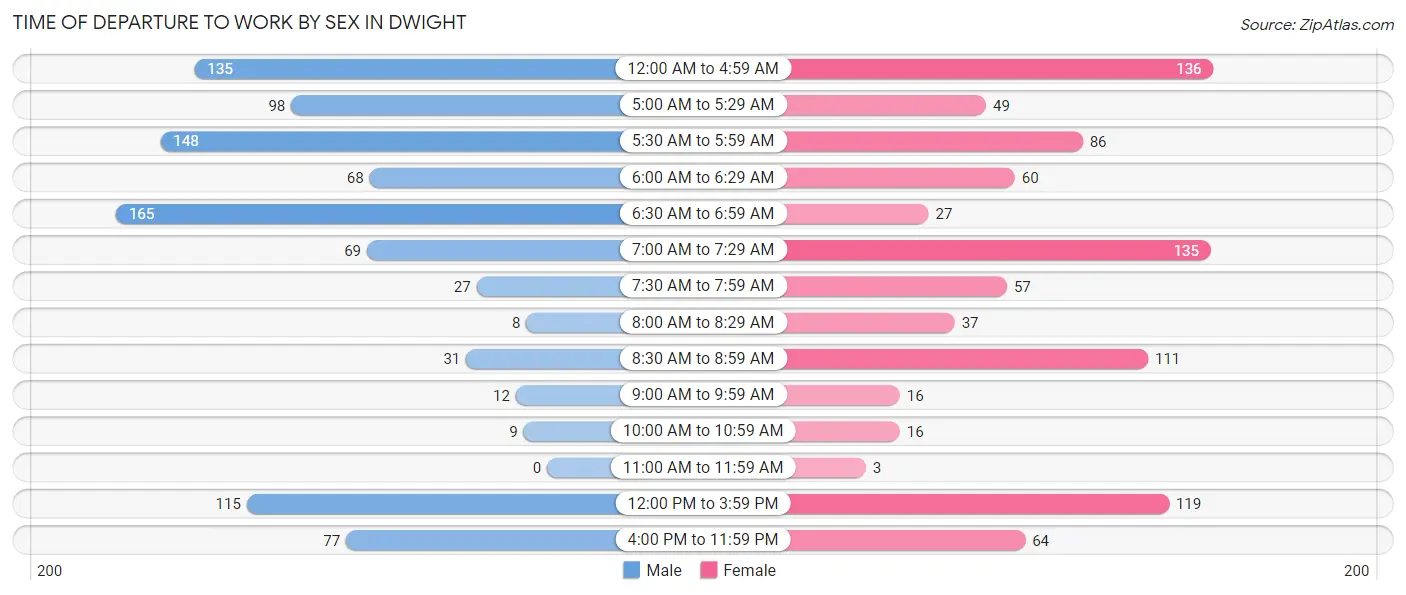
| Time of Departure | Male | Female |
| 12:00 AM to 4:59 AM | 135 (14.0%) | 136 (14.8%) |
| 5:00 AM to 5:29 AM | 98 (10.2%) | 49 (5.3%) |
| 5:30 AM to 5:59 AM | 148 (15.4%) | 86 (9.4%) |
| 6:00 AM to 6:29 AM | 68 (7.1%) | 60 (6.6%) |
| 6:30 AM to 6:59 AM | 165 (17.2%) | 27 (2.9%) |
| 7:00 AM to 7:29 AM | 69 (7.2%) | 135 (14.7%) |
| 7:30 AM to 7:59 AM | 27 (2.8%) | 57 (6.2%) |
| 8:00 AM to 8:29 AM | 8 (0.8%) | 37 (4.0%) |
| 8:30 AM to 8:59 AM | 31 (3.2%) | 111 (12.1%) |
| 9:00 AM to 9:59 AM | 12 (1.3%) | 16 (1.8%) |
| 10:00 AM to 10:59 AM | 9 (0.9%) | 16 (1.8%) |
| 11:00 AM to 11:59 AM | 0 (0.0%) | 3 (0.3%) |
| 12:00 PM to 3:59 PM | 115 (11.9%) | 119 (13.0%) |
| 4:00 PM to 11:59 PM | 77 (8.0%) | 64 (7.0%) |
| Total | 962 (100.0%) | 916 (100.0%) |
Housing Occupancy in Dwight
Occupancy by Ownership in Dwight
Of the total 1,542 dwellings in Dwight, owner-occupied units account for 1,020 (66.1%), while renter-occupied units make up 522 (33.9%).
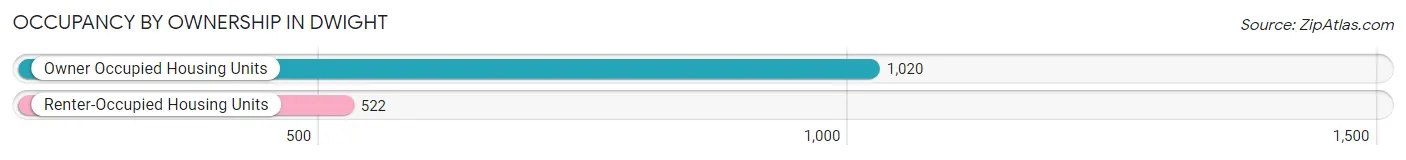
| Occupancy | # Housing Units | % Housing Units |
| Owner Occupied Housing Units | 1,020 | 66.1% |
| Renter-Occupied Housing Units | 522 | 33.9% |
| Total Occupied Housing Units | 1,542 | 100.0% |
Occupancy by Household Size in Dwight
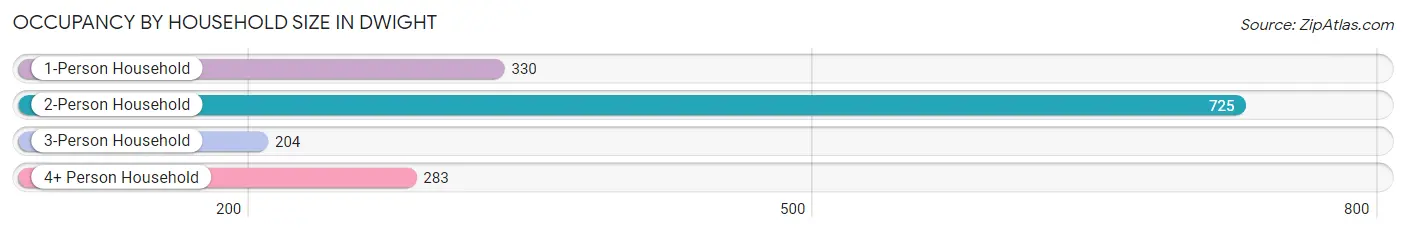
| Household Size | # Housing Units | % Housing Units |
| 1-Person Household | 330 | 21.4% |
| 2-Person Household | 725 | 47.0% |
| 3-Person Household | 204 | 13.2% |
| 4+ Person Household | 283 | 18.3% |
| Total Housing Units | 1,542 | 100.0% |
Occupancy by Ownership by Household Size in Dwight
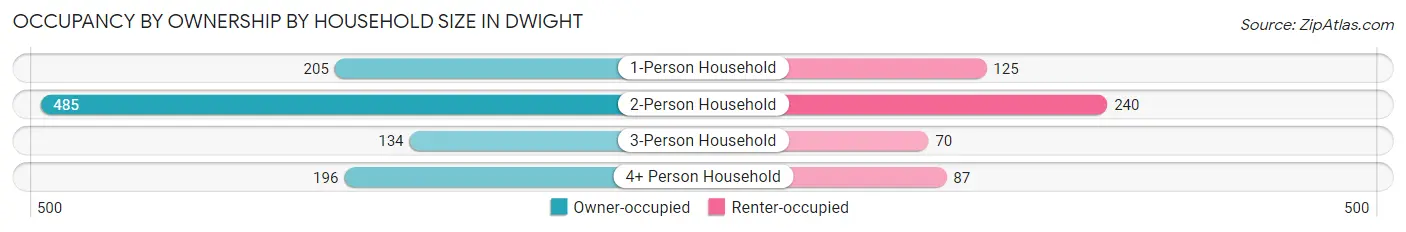
| Household Size | Owner-occupied | Renter-occupied |
| 1-Person Household | 205 (62.1%) | 125 (37.9%) |
| 2-Person Household | 485 (66.9%) | 240 (33.1%) |
| 3-Person Household | 134 (65.7%) | 70 (34.3%) |
| 4+ Person Household | 196 (69.3%) | 87 (30.7%) |
| Total Housing Units | 1,020 (66.1%) | 522 (33.9%) |
Occupancy by Educational Attainment in Dwight
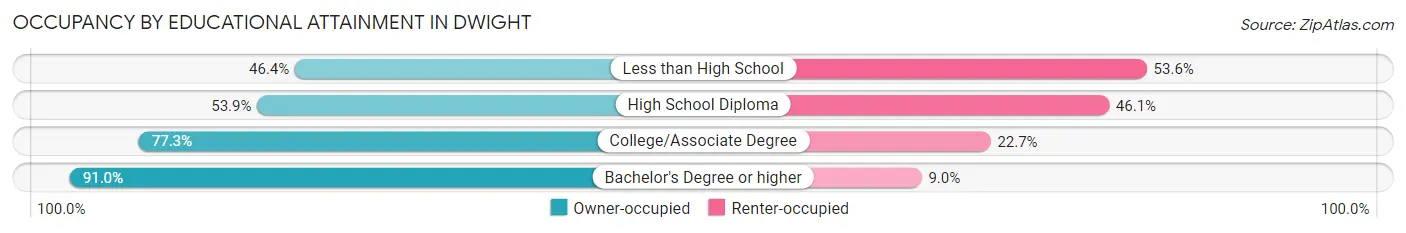
| Household Size | Owner-occupied | Renter-occupied |
| Less than High School | 83 (46.4%) | 96 (53.6%) |
| High School Diploma | 349 (53.9%) | 299 (46.1%) |
| College/Associate Degree | 355 (77.3%) | 104 (22.7%) |
| Bachelor's Degree or higher | 233 (91.0%) | 23 (9.0%) |
Occupancy by Age of Householder in Dwight
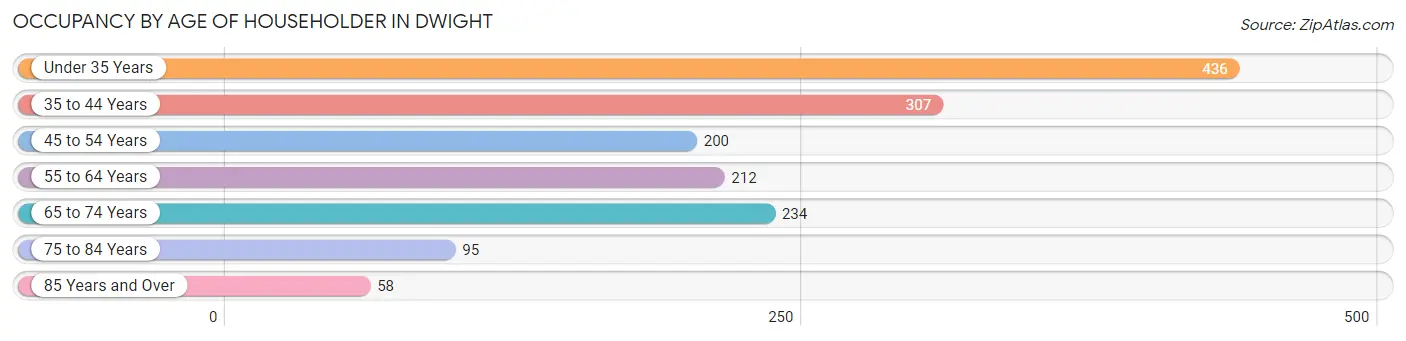
| Age Bracket | # Households | % Households |
| Under 35 Years | 436 | 28.3% |
| 35 to 44 Years | 307 | 19.9% |
| 45 to 54 Years | 200 | 13.0% |
| 55 to 64 Years | 212 | 13.8% |
| 65 to 74 Years | 234 | 15.2% |
| 75 to 84 Years | 95 | 6.2% |
| 85 Years and Over | 58 | 3.8% |
| Total | 1,542 | 100.0% |
Housing Finances in Dwight
Median Income by Occupancy in Dwight
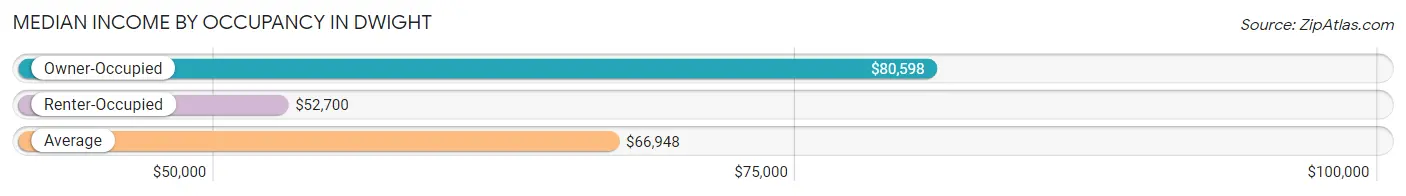
| Occupancy Type | # Households | Median Income |
| Owner-Occupied | 1,020 (66.1%) | $80,598 |
| Renter-Occupied | 522 (33.9%) | $52,700 |
| Average | 1,542 (100.0%) | $66,948 |
Occupancy by Householder Income Bracket in Dwight
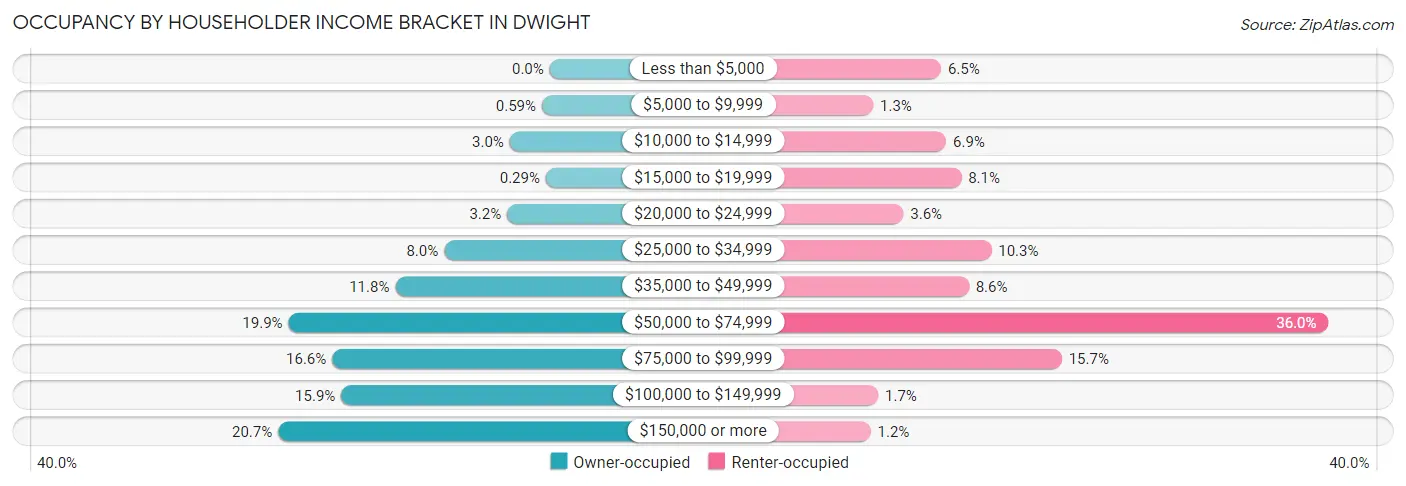
| Income Bracket | Owner-occupied | Renter-occupied |
| Less than $5,000 | 0 (0.0%) | 34 (6.5%) |
| $5,000 to $9,999 | 6 (0.6%) | 7 (1.3%) |
| $10,000 to $14,999 | 31 (3.0%) | 36 (6.9%) |
| $15,000 to $19,999 | 3 (0.3%) | 42 (8.1%) |
| $20,000 to $24,999 | 33 (3.2%) | 19 (3.6%) |
| $25,000 to $34,999 | 82 (8.0%) | 54 (10.3%) |
| $35,000 to $49,999 | 120 (11.8%) | 45 (8.6%) |
| $50,000 to $74,999 | 203 (19.9%) | 188 (36.0%) |
| $75,000 to $99,999 | 169 (16.6%) | 82 (15.7%) |
| $100,000 to $149,999 | 162 (15.9%) | 9 (1.7%) |
| $150,000 or more | 211 (20.7%) | 6 (1.1%) |
| Total | 1,020 (100.0%) | 522 (100.0%) |
Monthly Housing Cost Tiers in Dwight
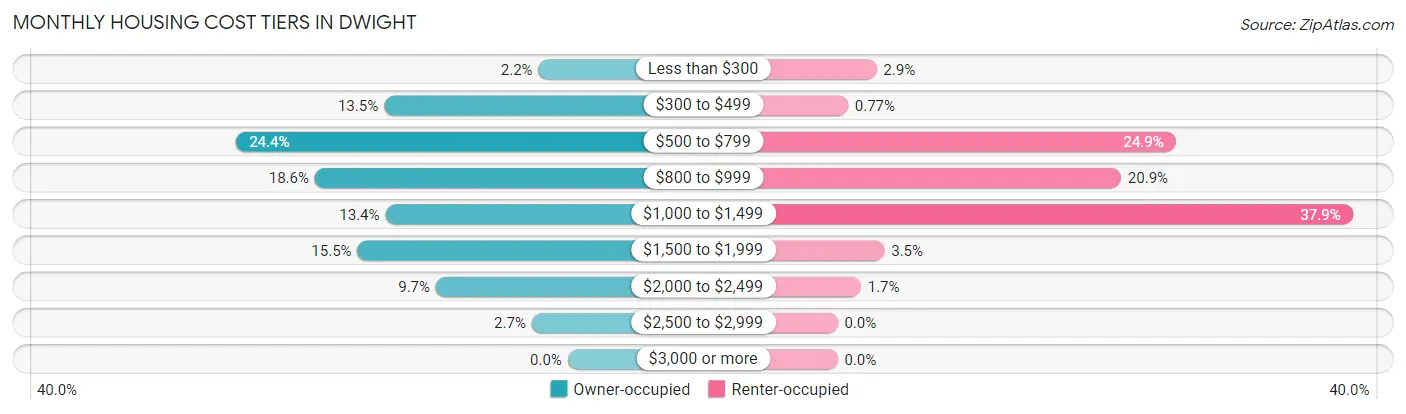
| Monthly Cost | Owner-occupied | Renter-occupied |
| Less than $300 | 22 (2.2%) | 15 (2.9%) |
| $300 to $499 | 138 (13.5%) | 4 (0.8%) |
| $500 to $799 | 249 (24.4%) | 130 (24.9%) |
| $800 to $999 | 190 (18.6%) | 109 (20.9%) |
| $1,000 to $1,499 | 137 (13.4%) | 198 (37.9%) |
| $1,500 to $1,999 | 158 (15.5%) | 18 (3.5%) |
| $2,000 to $2,499 | 99 (9.7%) | 9 (1.7%) |
| $2,500 to $2,999 | 27 (2.6%) | 0 (0.0%) |
| $3,000 or more | 0 (0.0%) | 0 (0.0%) |
| Total | 1,020 (100.0%) | 522 (100.0%) |
Physical Housing Characteristics in Dwight
Housing Structures in Dwight
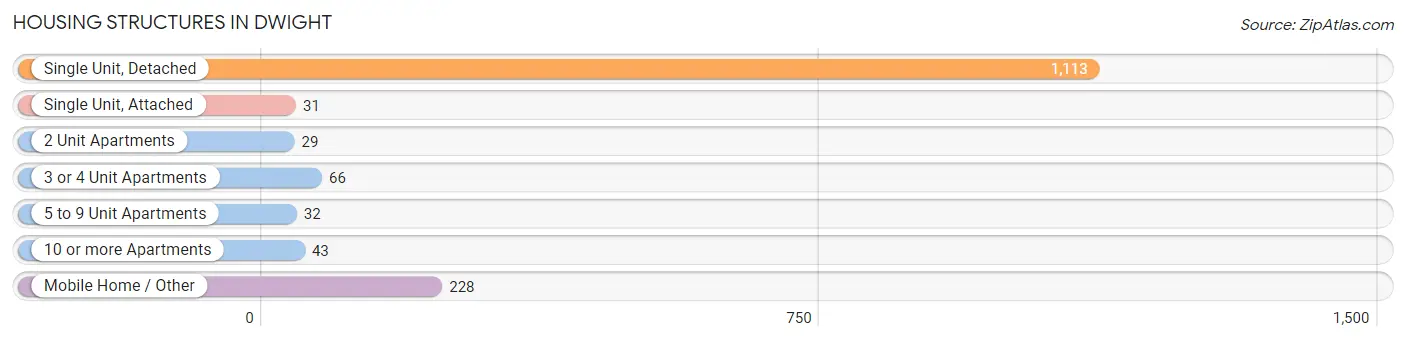
| Structure Type | # Housing Units | % Housing Units |
| Single Unit, Detached | 1,113 | 72.2% |
| Single Unit, Attached | 31 | 2.0% |
| 2 Unit Apartments | 29 | 1.9% |
| 3 or 4 Unit Apartments | 66 | 4.3% |
| 5 to 9 Unit Apartments | 32 | 2.1% |
| 10 or more Apartments | 43 | 2.8% |
| Mobile Home / Other | 228 | 14.8% |
| Total | 1,542 | 100.0% |
Housing Structures by Occupancy in Dwight
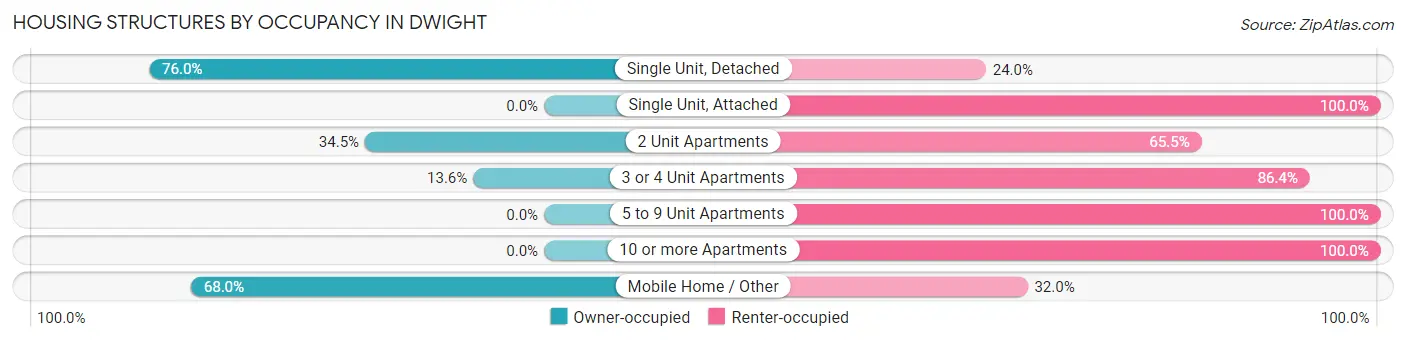
| Structure Type | Owner-occupied | Renter-occupied |
| Single Unit, Detached | 846 (76.0%) | 267 (24.0%) |
| Single Unit, Attached | 0 (0.0%) | 31 (100.0%) |
| 2 Unit Apartments | 10 (34.5%) | 19 (65.5%) |
| 3 or 4 Unit Apartments | 9 (13.6%) | 57 (86.4%) |
| 5 to 9 Unit Apartments | 0 (0.0%) | 32 (100.0%) |
| 10 or more Apartments | 0 (0.0%) | 43 (100.0%) |
| Mobile Home / Other | 155 (68.0%) | 73 (32.0%) |
| Total | 1,020 (66.1%) | 522 (33.9%) |
Housing Structures by Number of Rooms in Dwight
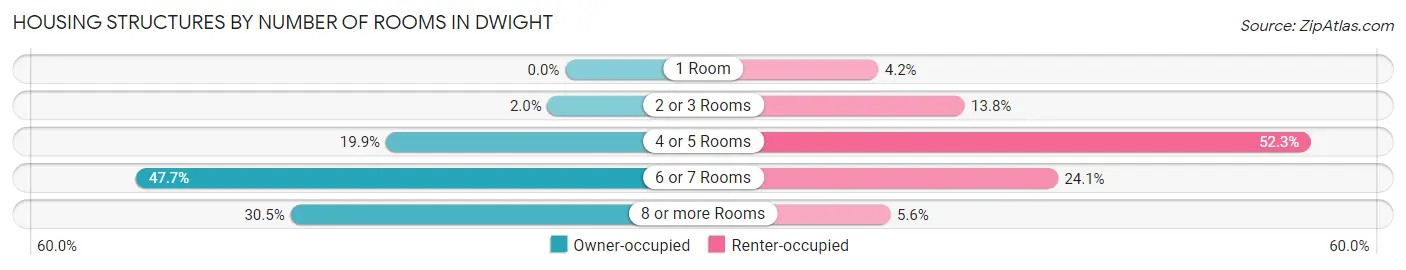
| Number of Rooms | Owner-occupied | Renter-occupied |
| 1 Room | 0 (0.0%) | 22 (4.2%) |
| 2 or 3 Rooms | 20 (2.0%) | 72 (13.8%) |
| 4 or 5 Rooms | 203 (19.9%) | 273 (52.3%) |
| 6 or 7 Rooms | 486 (47.6%) | 126 (24.1%) |
| 8 or more Rooms | 311 (30.5%) | 29 (5.6%) |
| Total | 1,020 (100.0%) | 522 (100.0%) |
Housing Structure by Heating Type in Dwight
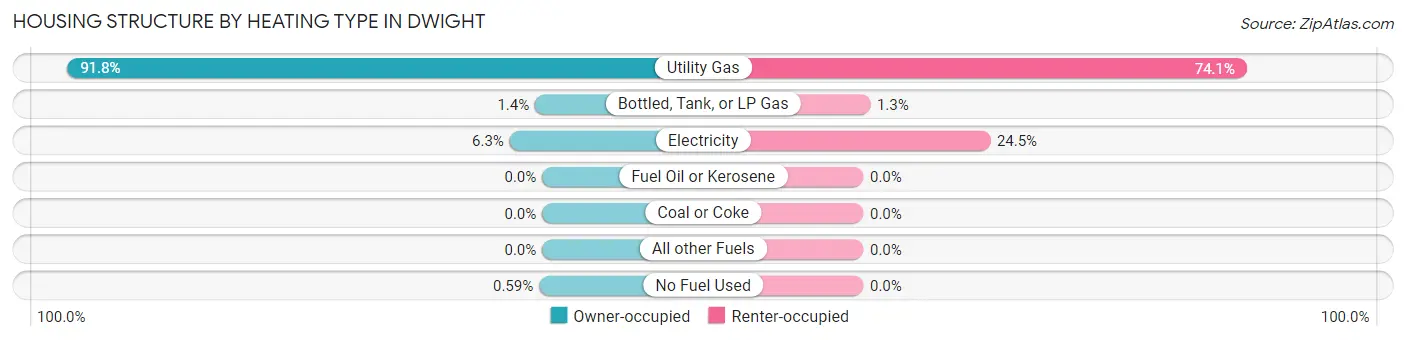
| Heating Type | Owner-occupied | Renter-occupied |
| Utility Gas | 936 (91.8%) | 387 (74.1%) |
| Bottled, Tank, or LP Gas | 14 (1.4%) | 7 (1.3%) |
| Electricity | 64 (6.3%) | 128 (24.5%) |
| Fuel Oil or Kerosene | 0 (0.0%) | 0 (0.0%) |
| Coal or Coke | 0 (0.0%) | 0 (0.0%) |
| All other Fuels | 0 (0.0%) | 0 (0.0%) |
| No Fuel Used | 6 (0.6%) | 0 (0.0%) |
| Total | 1,020 (100.0%) | 522 (100.0%) |
Household Vehicle Usage in Dwight
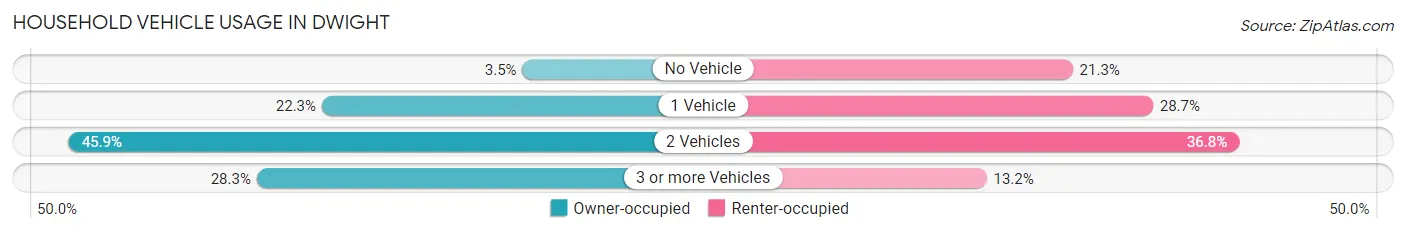
| Vehicles per Household | Owner-occupied | Renter-occupied |
| No Vehicle | 36 (3.5%) | 111 (21.3%) |
| 1 Vehicle | 227 (22.3%) | 150 (28.7%) |
| 2 Vehicles | 468 (45.9%) | 192 (36.8%) |
| 3 or more Vehicles | 289 (28.3%) | 69 (13.2%) |
| Total | 1,020 (100.0%) | 522 (100.0%) |
Real Estate & Mortgages in Dwight
Real Estate and Mortgage Overview in Dwight
| Characteristic | Without Mortgage | With Mortgage |
| Housing Units | 472 | 548 |
| Median Property Value | $115,100 | $159,800 |
| Median Household Income | $53,875 | $144 |
| Monthly Housing Costs | $630 | $0 |
| Real Estate Taxes | $2,082 | $2 |
Property Value by Mortgage Status in Dwight
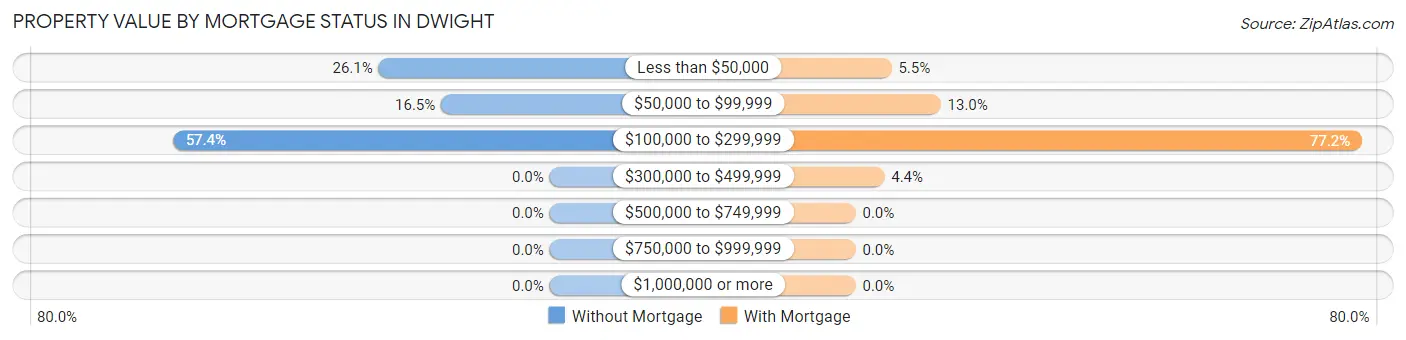
| Property Value | Without Mortgage | With Mortgage |
| Less than $50,000 | 123 (26.1%) | 30 (5.5%) |
| $50,000 to $99,999 | 78 (16.5%) | 71 (13.0%) |
| $100,000 to $299,999 | 271 (57.4%) | 423 (77.2%) |
| $300,000 to $499,999 | 0 (0.0%) | 24 (4.4%) |
| $500,000 to $749,999 | 0 (0.0%) | 0 (0.0%) |
| $750,000 to $999,999 | 0 (0.0%) | 0 (0.0%) |
| $1,000,000 or more | 0 (0.0%) | 0 (0.0%) |
| Total | 472 (100.0%) | 548 (100.0%) |
Household Income by Mortgage Status in Dwight
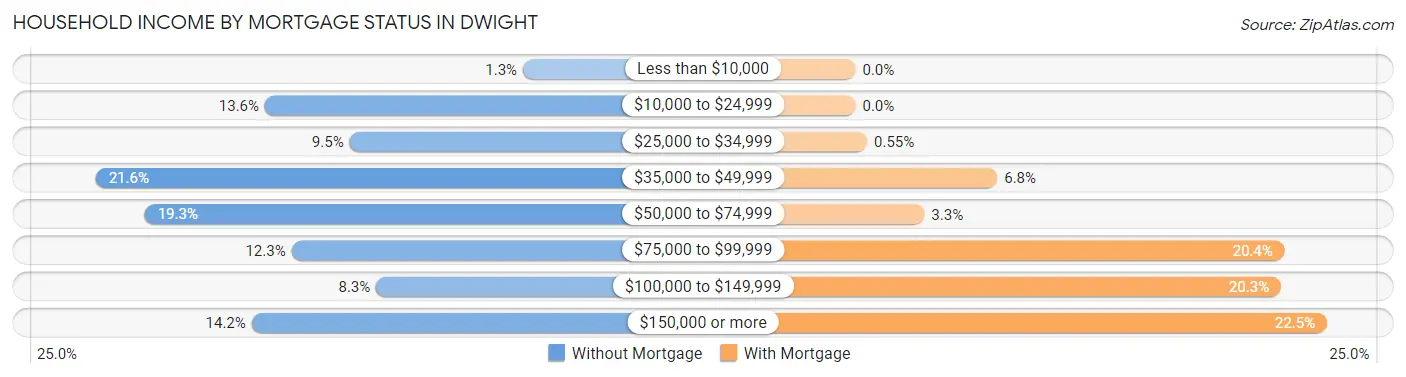
| Household Income | Without Mortgage | With Mortgage |
| Less than $10,000 | 6 (1.3%) | 0 (0.0%) |
| $10,000 to $24,999 | 64 (13.6%) | 0 (0.0%) |
| $25,000 to $34,999 | 45 (9.5%) | 3 (0.5%) |
| $35,000 to $49,999 | 102 (21.6%) | 37 (6.8%) |
| $50,000 to $74,999 | 91 (19.3%) | 18 (3.3%) |
| $75,000 to $99,999 | 58 (12.3%) | 112 (20.4%) |
| $100,000 to $149,999 | 39 (8.3%) | 111 (20.3%) |
| $150,000 or more | 67 (14.2%) | 123 (22.5%) |
| Total | 472 (100.0%) | 548 (100.0%) |
Property Value to Household Income Ratio in Dwight
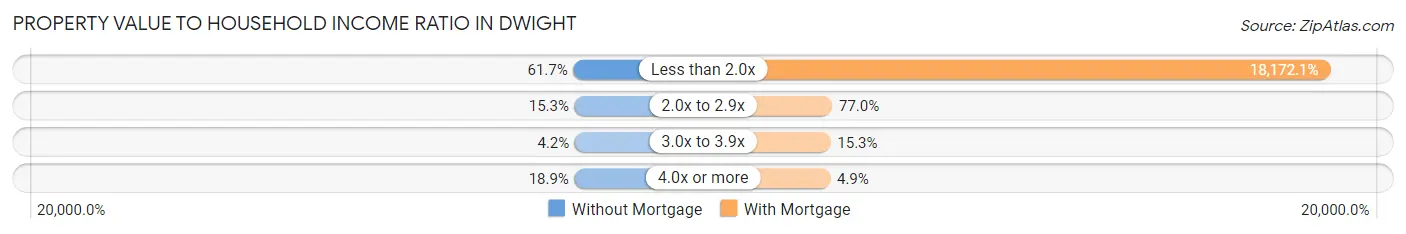
| Value-to-Income Ratio | Without Mortgage | With Mortgage |
| Less than 2.0x | 291 (61.7%) | 99,583 (18,172.1%) |
| 2.0x to 2.9x | 72 (15.2%) | 422 (77.0%) |
| 3.0x to 3.9x | 20 (4.2%) | 84 (15.3%) |
| 4.0x or more | 89 (18.9%) | 27 (4.9%) |
| Total | 472 (100.0%) | 548 (100.0%) |
Real Estate Taxes by Mortgage Status in Dwight
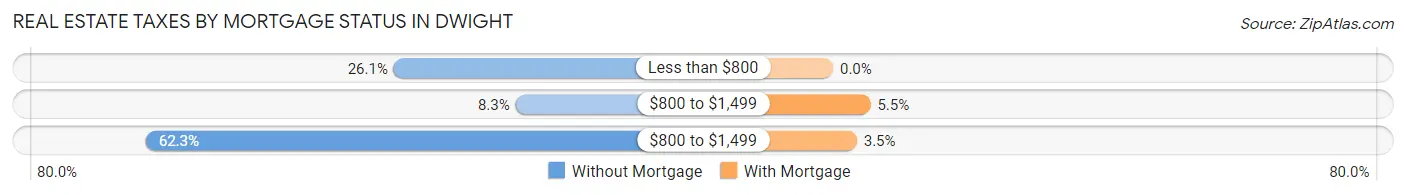
| Property Taxes | Without Mortgage | With Mortgage |
| Less than $800 | 123 (26.1%) | 0 (0.0%) |
| $800 to $1,499 | 39 (8.3%) | 30 (5.5%) |
| $800 to $1,499 | 294 (62.3%) | 19 (3.5%) |
| Total | 472 (100.0%) | 548 (100.0%) |
Health & Disability in Dwight
Health Insurance Coverage by Age in Dwight
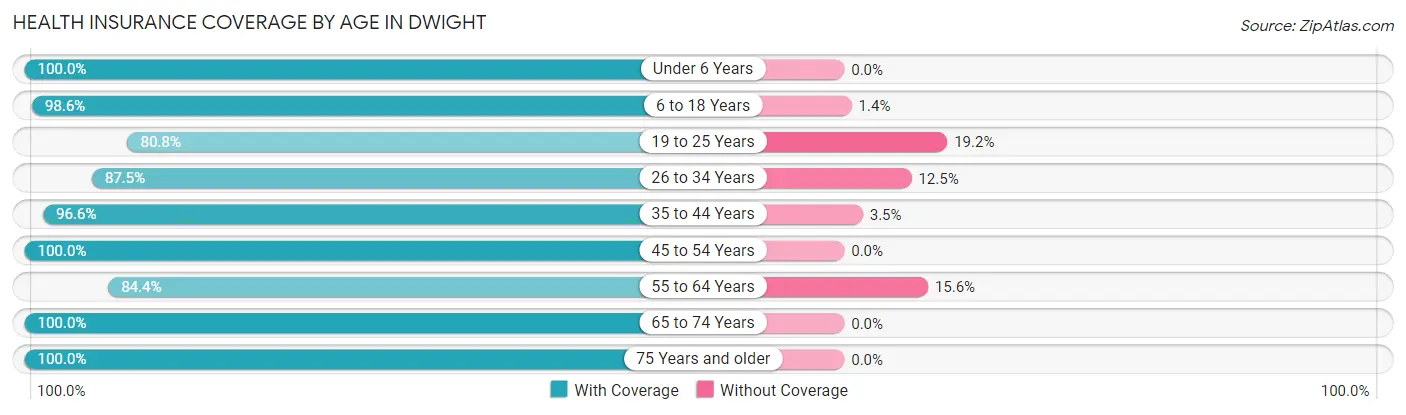
| Age Bracket | With Coverage | Without Coverage |
| Under 6 Years | 230 (100.0%) | 0 (0.0%) |
| 6 to 18 Years | 646 (98.6%) | 9 (1.4%) |
| 19 to 25 Years | 345 (80.8%) | 82 (19.2%) |
| 26 to 34 Years | 426 (87.5%) | 61 (12.5%) |
| 35 to 44 Years | 560 (96.6%) | 20 (3.5%) |
| 45 to 54 Years | 338 (100.0%) | 0 (0.0%) |
| 55 to 64 Years | 330 (84.4%) | 61 (15.6%) |
| 65 to 74 Years | 410 (100.0%) | 0 (0.0%) |
| 75 Years and older | 219 (100.0%) | 0 (0.0%) |
| Total | 3,504 (93.8%) | 233 (6.2%) |
Health Insurance Coverage by Citizenship Status in Dwight
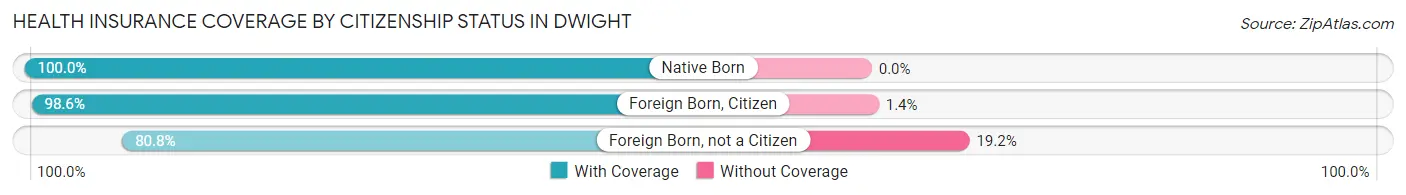
| Citizenship Status | With Coverage | Without Coverage |
| Native Born | 230 (100.0%) | 0 (0.0%) |
| Foreign Born, Citizen | 646 (98.6%) | 9 (1.4%) |
| Foreign Born, not a Citizen | 345 (80.8%) | 82 (19.2%) |
Health Insurance Coverage by Household Income in Dwight
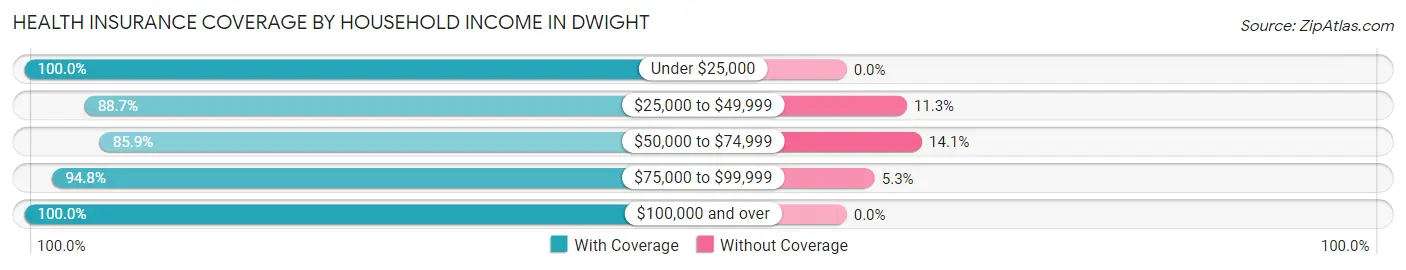
| Household Income | With Coverage | Without Coverage |
| Under $25,000 | 430 (100.0%) | 0 (0.0%) |
| $25,000 to $49,999 | 575 (88.7%) | 73 (11.3%) |
| $50,000 to $74,999 | 797 (85.9%) | 131 (14.1%) |
| $75,000 to $99,999 | 523 (94.8%) | 29 (5.2%) |
| $100,000 and over | 1,081 (100.0%) | 0 (0.0%) |
Public vs Private Health Insurance Coverage by Age in Dwight
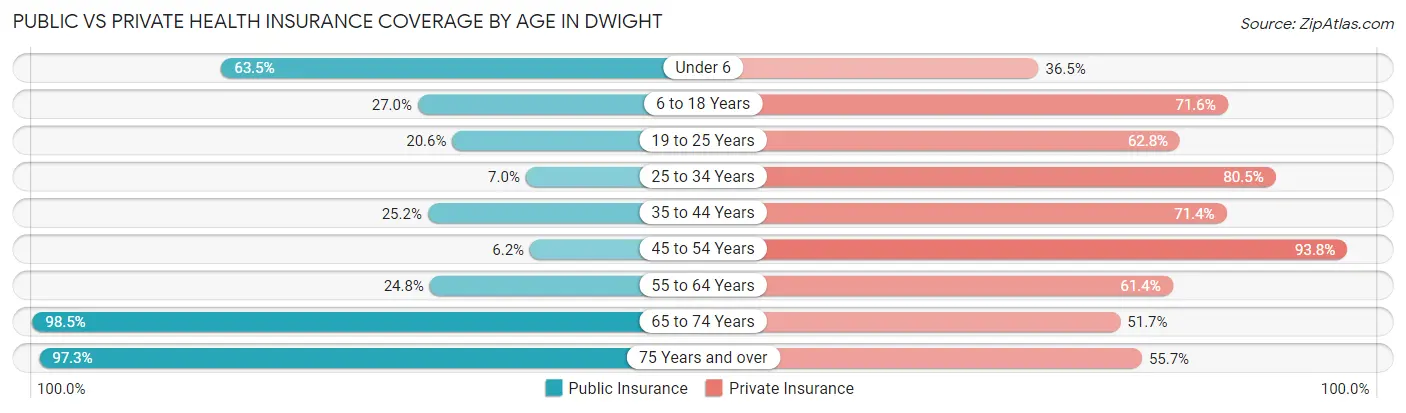
| Age Bracket | Public Insurance | Private Insurance |
| Under 6 | 146 (63.5%) | 84 (36.5%) |
| 6 to 18 Years | 177 (27.0%) | 469 (71.6%) |
| 19 to 25 Years | 88 (20.6%) | 268 (62.8%) |
| 25 to 34 Years | 34 (7.0%) | 392 (80.5%) |
| 35 to 44 Years | 146 (25.2%) | 414 (71.4%) |
| 45 to 54 Years | 21 (6.2%) | 317 (93.8%) |
| 55 to 64 Years | 97 (24.8%) | 240 (61.4%) |
| 65 to 74 Years | 404 (98.5%) | 212 (51.7%) |
| 75 Years and over | 213 (97.3%) | 122 (55.7%) |
| Total | 1,326 (35.5%) | 2,518 (67.4%) |
Disability Status by Sex by Age in Dwight
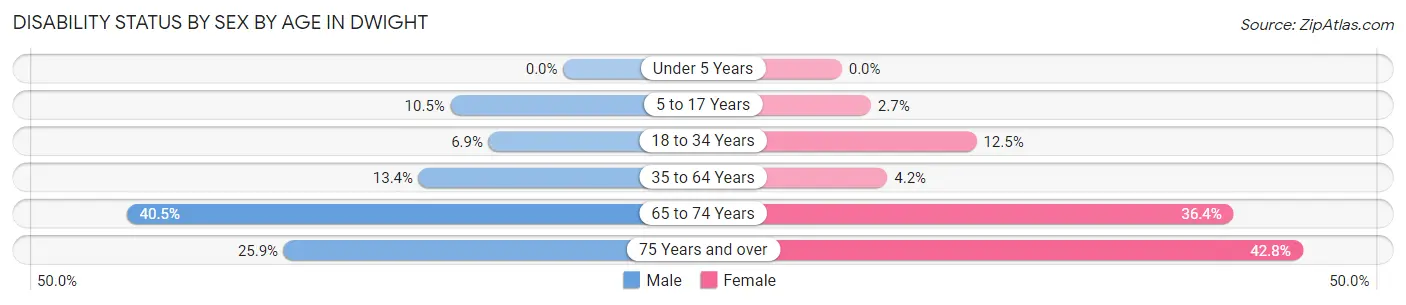
| Age Bracket | Male | Female |
| Under 5 Years | 0 (0.0%) | 0 (0.0%) |
| 5 to 17 Years | 32 (10.5%) | 9 (2.7%) |
| 18 to 34 Years | 34 (6.9%) | 58 (12.5%) |
| 35 to 64 Years | 90 (13.4%) | 27 (4.2%) |
| 65 to 74 Years | 77 (40.5%) | 80 (36.4%) |
| 75 Years and over | 21 (25.9%) | 59 (42.7%) |
Disability Class by Sex by Age in Dwight
Disability Class: Hearing Difficulty
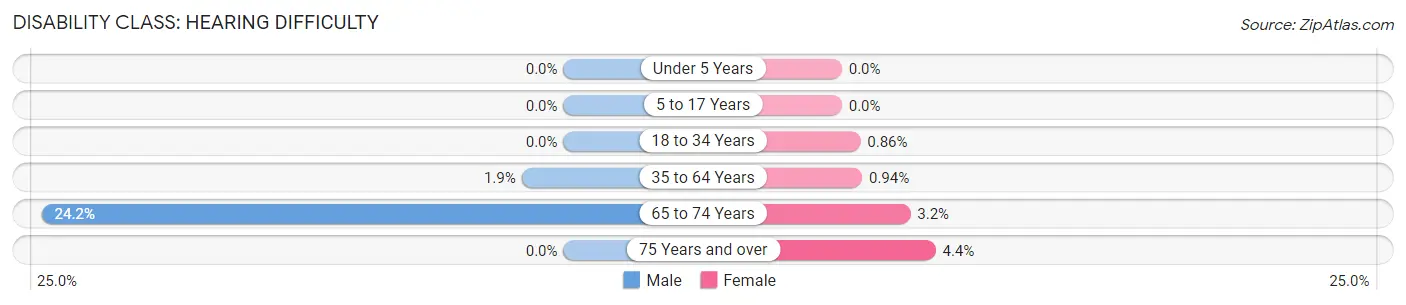
| Age Bracket | Male | Female |
| Under 5 Years | 0 (0.0%) | 0 (0.0%) |
| 5 to 17 Years | 0 (0.0%) | 0 (0.0%) |
| 18 to 34 Years | 0 (0.0%) | 4 (0.9%) |
| 35 to 64 Years | 13 (1.9%) | 6 (0.9%) |
| 65 to 74 Years | 46 (24.2%) | 7 (3.2%) |
| 75 Years and over | 0 (0.0%) | 6 (4.3%) |
Disability Class: Vision Difficulty
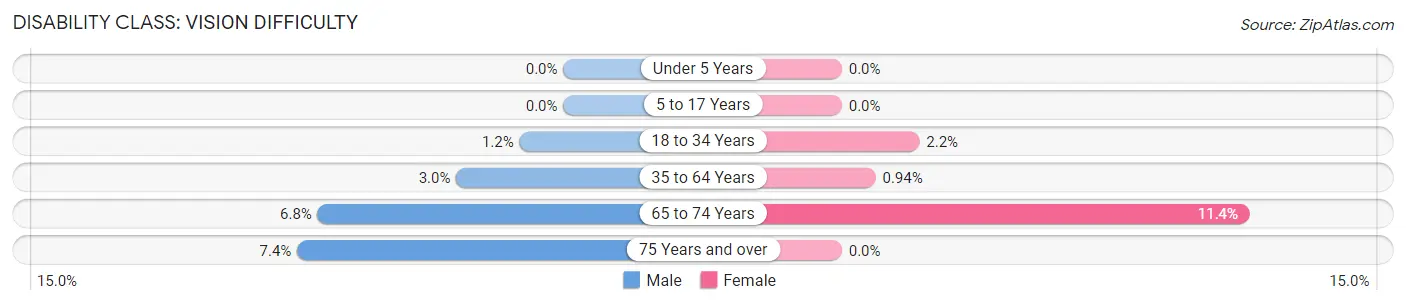
| Age Bracket | Male | Female |
| Under 5 Years | 0 (0.0%) | 0 (0.0%) |
| 5 to 17 Years | 0 (0.0%) | 0 (0.0%) |
| 18 to 34 Years | 6 (1.2%) | 10 (2.2%) |
| 35 to 64 Years | 20 (3.0%) | 6 (0.9%) |
| 65 to 74 Years | 13 (6.8%) | 25 (11.4%) |
| 75 Years and over | 6 (7.4%) | 0 (0.0%) |
Disability Class: Cognitive Difficulty
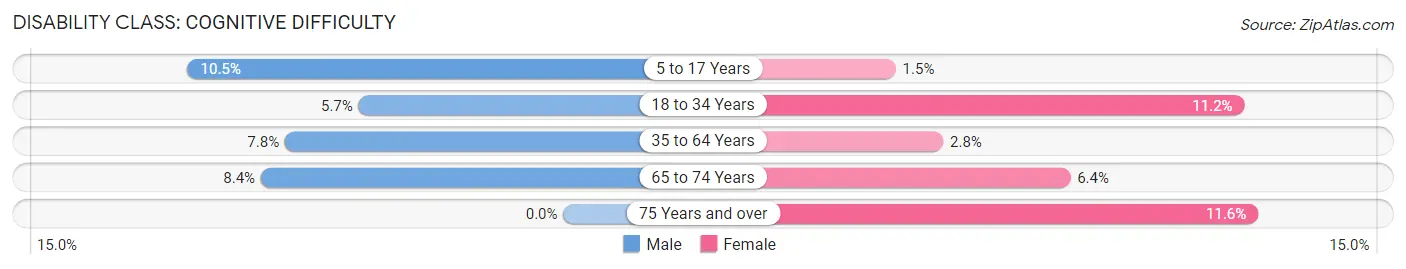
| Age Bracket | Male | Female |
| 5 to 17 Years | 32 (10.5%) | 5 (1.5%) |
| 18 to 34 Years | 28 (5.7%) | 52 (11.2%) |
| 35 to 64 Years | 52 (7.7%) | 18 (2.8%) |
| 65 to 74 Years | 16 (8.4%) | 14 (6.4%) |
| 75 Years and over | 0 (0.0%) | 16 (11.6%) |
Disability Class: Ambulatory Difficulty
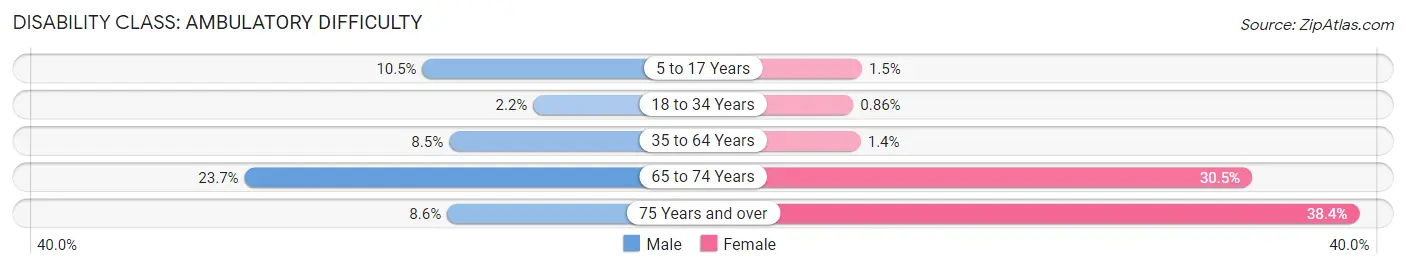
| Age Bracket | Male | Female |
| 5 to 17 Years | 32 (10.5%) | 5 (1.5%) |
| 18 to 34 Years | 11 (2.2%) | 4 (0.9%) |
| 35 to 64 Years | 57 (8.5%) | 9 (1.4%) |
| 65 to 74 Years | 45 (23.7%) | 67 (30.4%) |
| 75 Years and over | 7 (8.6%) | 53 (38.4%) |
Disability Class: Self-Care Difficulty
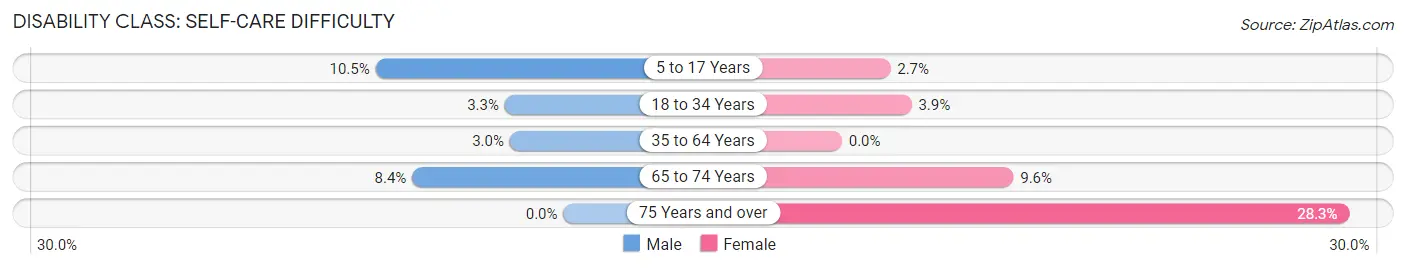
| Age Bracket | Male | Female |
| 5 to 17 Years | 32 (10.5%) | 9 (2.7%) |
| 18 to 34 Years | 16 (3.3%) | 18 (3.9%) |
| 35 to 64 Years | 20 (3.0%) | 0 (0.0%) |
| 65 to 74 Years | 16 (8.4%) | 21 (9.6%) |
| 75 Years and over | 0 (0.0%) | 39 (28.3%) |
Technology Access in Dwight
Computing Device Access in Dwight
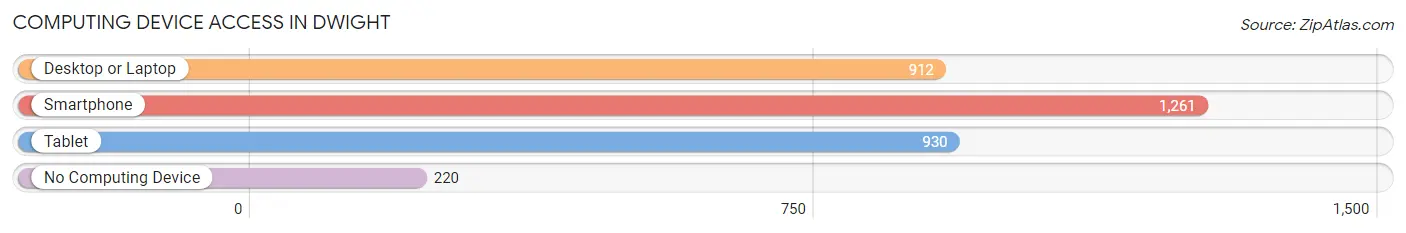
| Device Type | # Households | % Households |
| Desktop or Laptop | 912 | 59.1% |
| Smartphone | 1,261 | 81.8% |
| Tablet | 930 | 60.3% |
| No Computing Device | 220 | 14.3% |
| Total | 1,542 | 100.0% |
Internet Access in Dwight
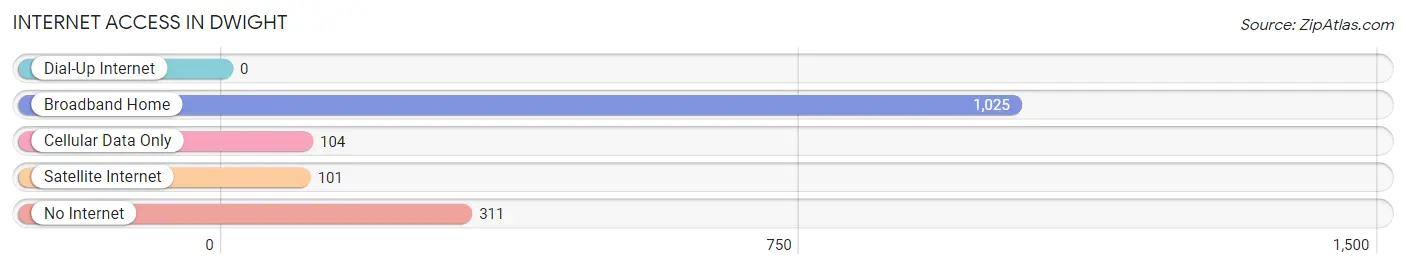
| Internet Type | # Households | % Households |
| Dial-Up Internet | 0 | 0.0% |
| Broadband Home | 1,025 | 66.5% |
| Cellular Data Only | 104 | 6.7% |
| Satellite Internet | 101 | 6.6% |
| No Internet | 311 | 20.2% |
| Total | 1,542 | 100.0% |
Dwight Summary
Dwight is a small village located in Livingston County, Illinois, United States. It is situated about 80 miles southwest of Chicago and is part of the Chicago metropolitan area. The population of Dwight was 2,890 at the 2010 census.
History
Dwight was founded in 1854 by Dr. John Dwight, a prominent physician from New York. He purchased a large tract of land in the area and began to develop it into a town. The town was named after him and was incorporated in 1859.
Dwight was an important stop on the Chicago and Alton Railroad, which ran through the town. This allowed the town to become a major shipping center for the surrounding area. The railroad also helped to bring in new businesses and industries to the town.
In the late 19th century, Dwight was a major center for the production of agricultural implements. The town was home to several factories that produced plows, harrows, and other farm equipment. The town also had a large number of grain elevators and warehouses.
In the early 20th century, Dwight was a major center for the production of coal. The town had several coal mines and was home to several coal-related businesses. The town also had a large number of brickyards and other industries.
Geography
Dwight is located at 41°3'25"N 88°25'17"W (41.056944, -88.421389). The village is situated in the central part of Livingston County, about 80 miles southwest of Chicago. The village is located on the Kankakee River, which flows through the town.
The village has a total area of 1.3 square miles, all of which is land. The village is located in a flat, open area with few trees. The soil is mostly sandy loam and is well-suited for agriculture.
Economy
Dwight’s economy is largely based on agriculture and manufacturing. The town is home to several large farms that produce corn, soybeans, and other crops. The town also has several factories that produce agricultural implements, furniture, and other products.
The town also has several small businesses, including restaurants, retail stores, and service providers. The town is also home to several banks and other financial institutions.
Demographics
As of the 2010 census, there were 2,890 people, 1,093 households, and 745 families living in Dwight. The population density was 2,213.3 people per square mile. The racial makeup of the village was 97.2% White, 0.7% African American, 0.2% Native American, 0.3% Asian, 0.1% Pacific Islander, 0.7% from other races, and 0.9% from two or more races. Hispanic or Latino of any race were 2.2% of the population.
The median income for a household in Dwight was $50,938, and the median income for a family was $60,000. The per capita income for the village was $22,845. About 6.2% of families and 8.2% of the population were below the poverty line, including 10.2% of those under age 18 and 5.2% of those age 65 or over.
Common Questions
What is Per Capita Income in Dwight?
Per Capita income in Dwight is $35,794.
What is the Median Family Income in Dwight?
Median Family Income in Dwight is $69,414.
What is the Median Household income in Dwight?
Median Household Income in Dwight is $66,948.
What is Income or Wage Gap in Dwight?
Income or Wage Gap in Dwight is 26.3%.
Women in Dwight earn 73.7 cents for every dollar earned by a man.
What is Inequality or Gini Index in Dwight?
Inequality or Gini Index in Dwight is 0.41.
What is the Total Population of Dwight?
Total Population of Dwight is 3,814.
What is the Total Male Population of Dwight?
Total Male Population of Dwight is 1,919.
What is the Total Female Population of Dwight?
Total Female Population of Dwight is 1,895.
What is the Ratio of Males per 100 Females in Dwight?
There are 101.27 Males per 100 Females in Dwight.
What is the Ratio of Females per 100 Males in Dwight?
There are 98.75 Females per 100 Males in Dwight.
What is the Median Population Age in Dwight?
Median Population Age in Dwight is 36.7 Years.
What is the Average Family Size in Dwight
Average Family Size in Dwight is 2.7 People.
What is the Average Household Size in Dwight
Average Household Size in Dwight is 2.4 People.
How Large is the Labor Force in Dwight?
There are 2,055 People in the Labor Forcein in Dwight.
What is the Percentage of People in the Labor Force in Dwight?
65.3% of People are in the Labor Force in Dwight.
What is the Unemployment Rate in Dwight?
Unemployment Rate in Dwight is 1.7%.