Zip Codes with the Highest Percentage of Households Without a Vehicle in Belleville, IL
RELATED REPORTS & OPTIONS
Households without a Cars
Belleville
Compare Zip Codes
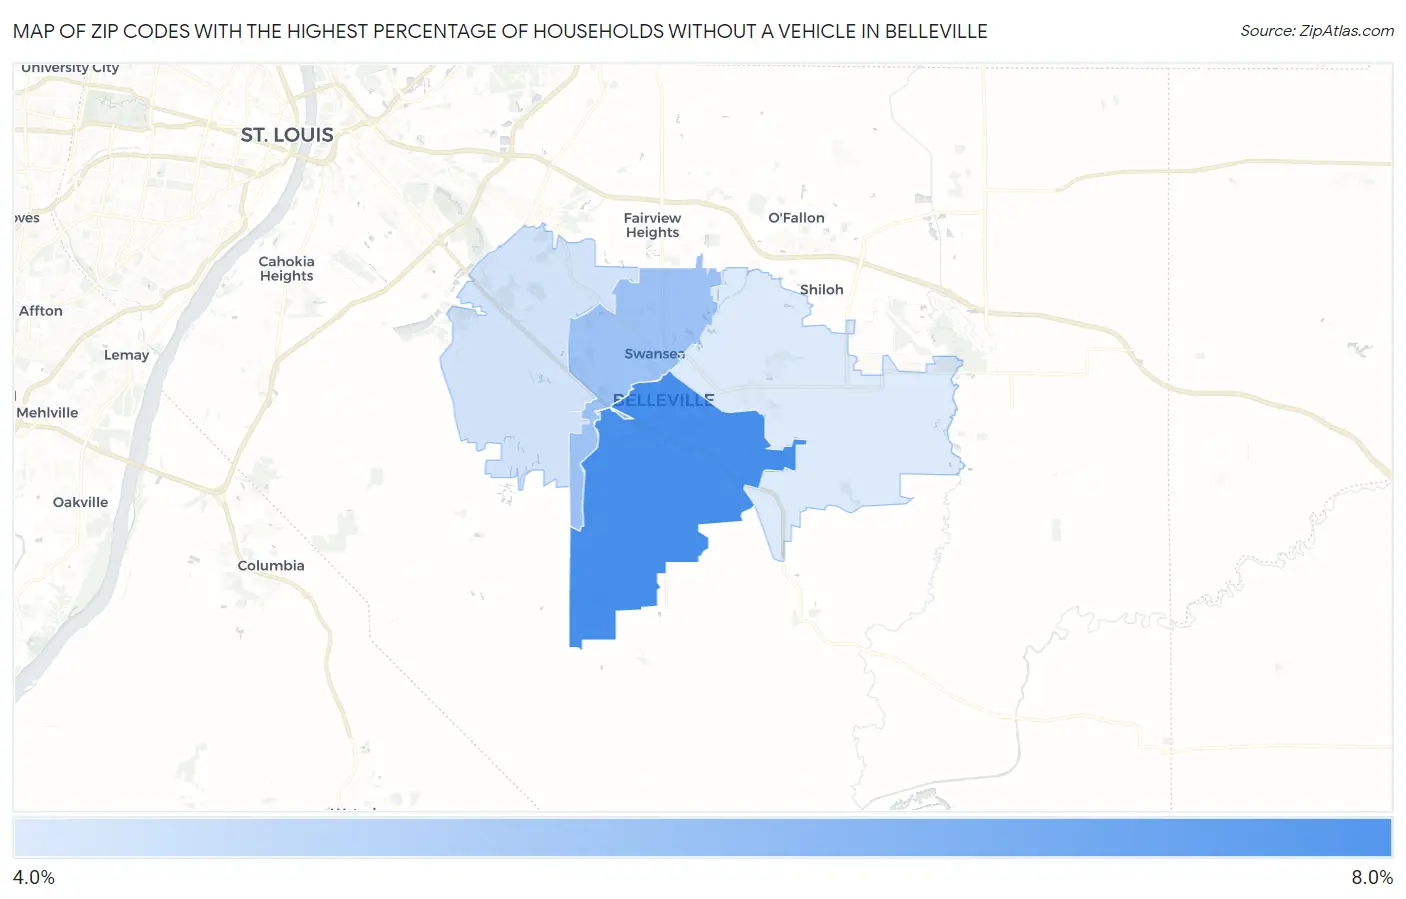
Map of Zip Codes with the Highest Percentage of Households Without a Vehicle in Belleville
4.3%
7.0%
Zip Codes with the Highest Percentage of Households Without a Vehicle in Belleville, IL
| Zip Code | Housholds Without a Car | vs State | vs National | |
| 1. | 62220 | 7.0% | 10.8%(-3.80)#328 | 8.3%(-1.30)#8,573 |
| 2. | 62226 | 5.5% | 10.8%(-5.30)#469 | 8.3%(-2.80)#11,625 |
| 3. | 62223 | 4.5% | 10.8%(-6.30)#589 | 8.3%(-3.80)#14,229 |
| 4. | 62221 | 4.3% | 10.8%(-6.50)#617 | 8.3%(-4.00)#14,800 |
1
Common Questions
What are the Top 3 Zip Codes with the Highest Percentage of Households Without a Vehicle in Belleville, IL?
Top 3 Zip Codes with the Highest Percentage of Households Without a Vehicle in Belleville, IL are:
What zip code has the Highest Percentage of Households Without a Vehicle in Belleville, IL?
62220 has the Highest Percentage of Households Without a Vehicle in Belleville, IL with 7.0%.
What is the Percentage of Households Without a Vehicle in Belleville, IL?
Percentage of Households Without a Vehicle in Belleville is 7.1%.
What is the Percentage of Households Without a Vehicle in Illinois?
Percentage of Households Without a Vehicle in Illinois is 10.8%.
What is the Percentage of Households Without a Vehicle in the United States?
Percentage of Households Without a Vehicle in the United States is 8.3%.