Zip Codes with the Highest Percentage of Hawaiian / Pacific Population in Quincy, IL
RELATED REPORTS & OPTIONS
Hawaiian / Pacific
Quincy
Compare Zip Codes
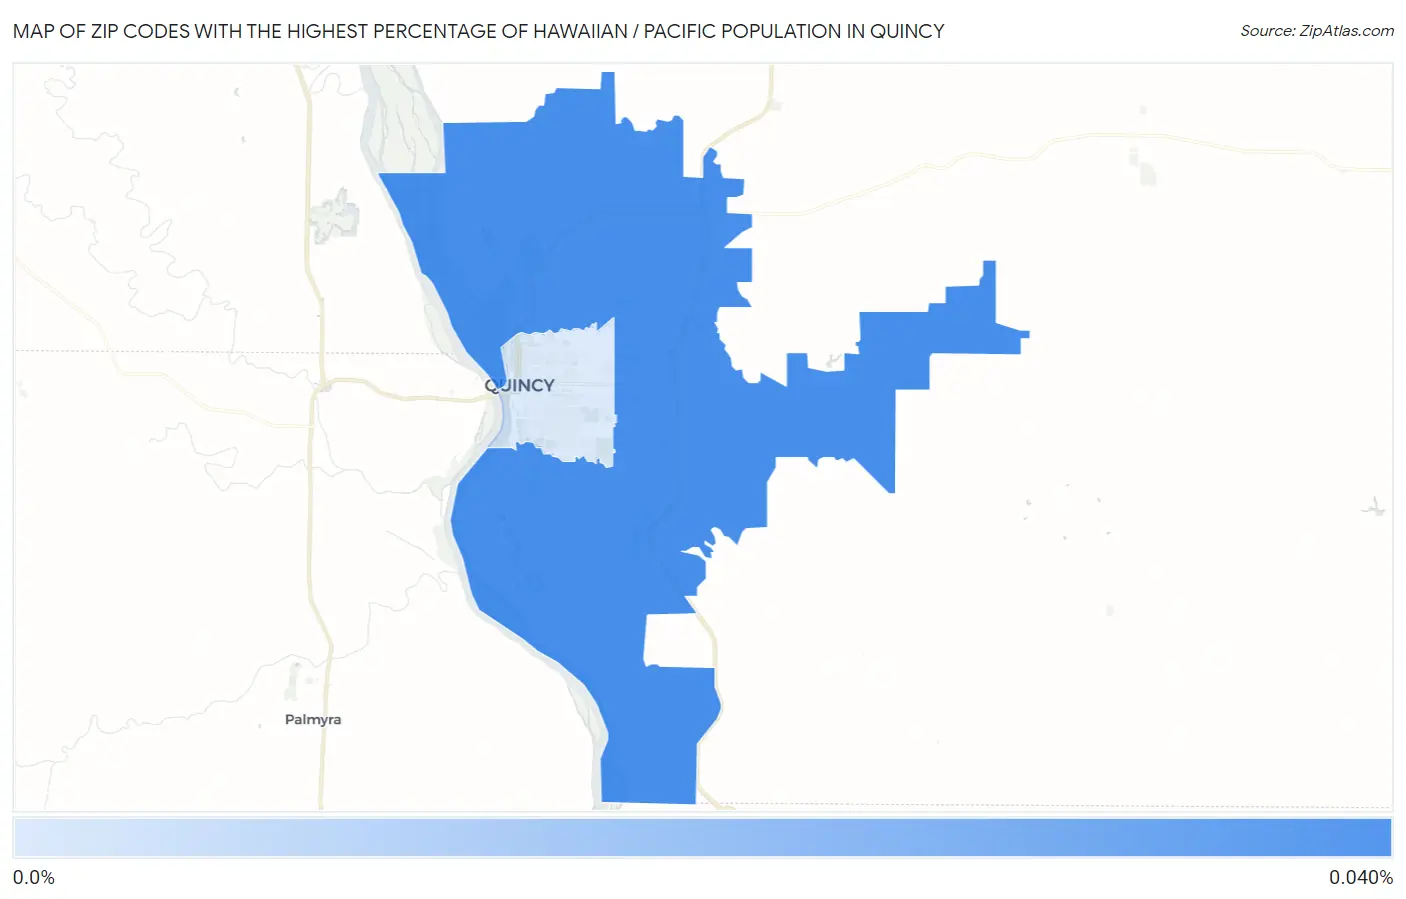
Map of Zip Codes with the Highest Percentage of Hawaiian / Pacific Population in Quincy
0.0065%
0.036%
Zip Codes with the Highest Percentage of Hawaiian / Pacific Population in Quincy, IL
| Zip Code | Hawaiian / Pacific | vs State | vs National | |
| 1. | 62305 | 0.036% | 0.043%(-0.007)#128 | 0.19%(-0.153)#5,474 |
| 2. | 62301 | 0.0065% | 0.043%(-0.036)#171 | 0.19%(-0.182)#6,366 |
1
Common Questions
What are the Top Zip Codes with the Highest Percentage of Hawaiian / Pacific Population in Quincy, IL?
Top Zip Codes with the Highest Percentage of Hawaiian / Pacific Population in Quincy, IL are:
What zip code has the Highest Percentage of Hawaiian / Pacific Population in Quincy, IL?
62305 has the Highest Percentage of Hawaiian / Pacific Population in Quincy, IL with 0.036%.
What is the Percentage of Hawaiian / Pacific Population in Quincy, IL?
Percentage of Hawaiian / Pacific Population in Quincy is 0.0051%.
What is the Percentage of Hawaiian / Pacific Population in Illinois?
Percentage of Hawaiian / Pacific Population in Illinois is 0.043%.
What is the Percentage of Hawaiian / Pacific Population in the United States?
Percentage of Hawaiian / Pacific Population in the United States is 0.19%.