Zip Codes with the Highest Percentage of Population Employed in Accommodation & Food Services in Milford, CT
RELATED REPORTS & OPTIONS
Accommodation & Food Services
Milford
Compare Zip Codes
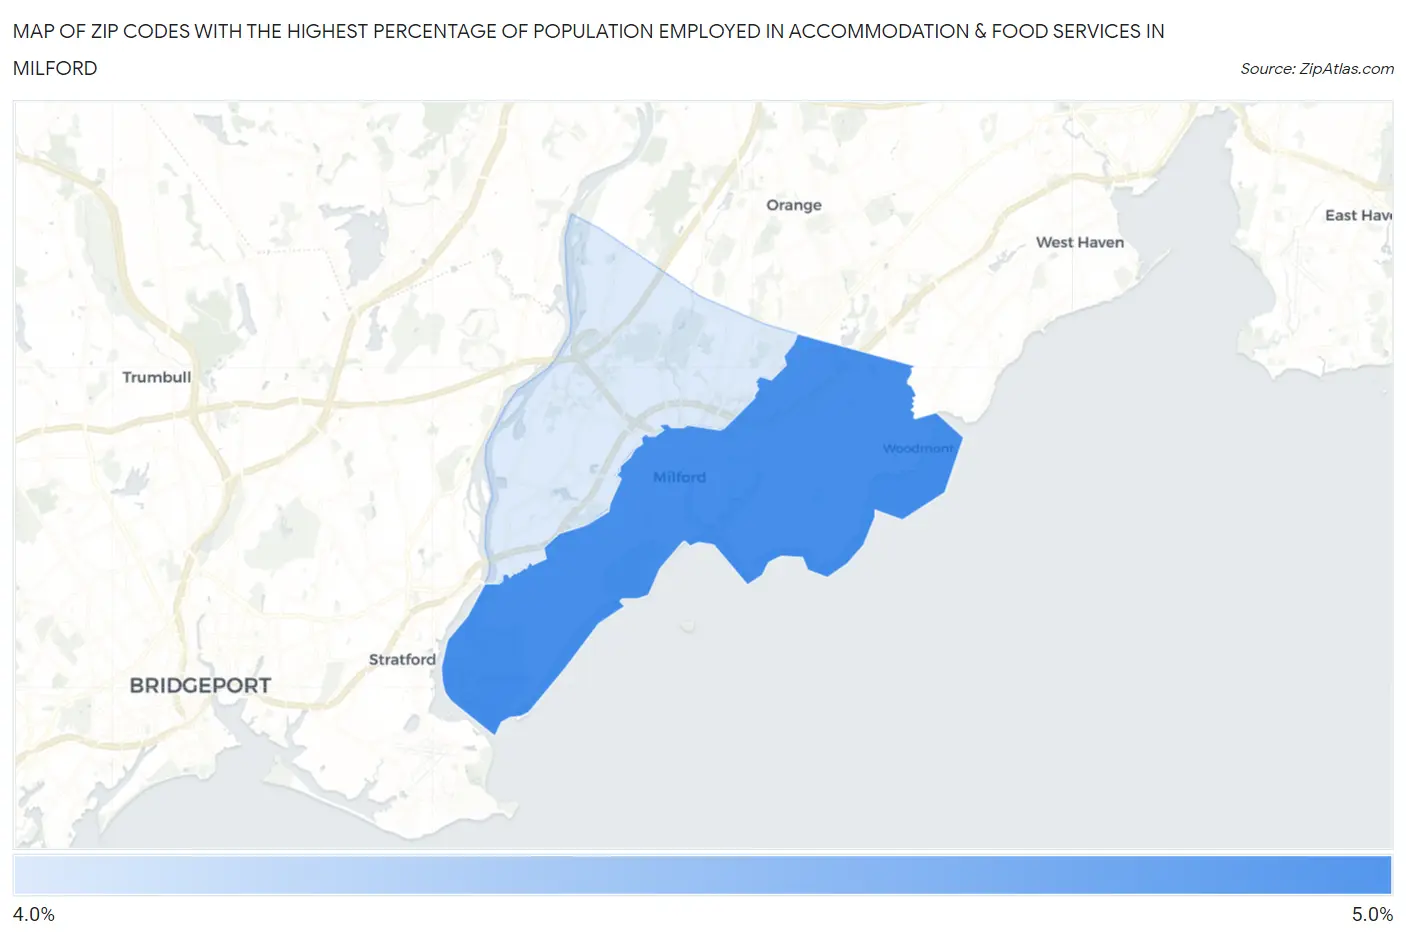
Map of Zip Codes with the Highest Percentage of Population Employed in Accommodation & Food Services in Milford
4.1%
4.9%
Zip Codes with the Highest Percentage of Population Employed in Accommodation & Food Services in Milford, CT
| Zip Code | % Employed | vs State | vs National | |
| 1. | 06460 | 4.9% | 5.6%(-0.751)#128 | 6.9%(-2.00)#17,217 |
| 2. | 06461 | 4.1% | 5.6%(-1.54)#163 | 6.9%(-2.78)#19,819 |
1
Common Questions
What are the Top Zip Codes with the Highest Percentage of Population Employed in Accommodation & Food Services in Milford, CT?
Top Zip Codes with the Highest Percentage of Population Employed in Accommodation & Food Services in Milford, CT are:
What zip code has the Highest Percentage of Population Employed in Accommodation & Food Services in Milford, CT?
06460 has the Highest Percentage of Population Employed in Accommodation & Food Services in Milford, CT with 4.9%.
What is the Percentage of Population Employed in Accommodation & Food Services in Connecticut?
Percentage of Population Employed in Accommodation & Food Services in Connecticut is 5.6%.
What is the Percentage of Population Employed in Accommodation & Food Services in the United States?
Percentage of Population Employed in Accommodation & Food Services in the United States is 6.9%.