Zip Codes with the Highest Percentage of Population Employed in Accommodation & Food Services in Hamden, CT
RELATED REPORTS & OPTIONS
Accommodation & Food Services
Hamden
Compare Zip Codes
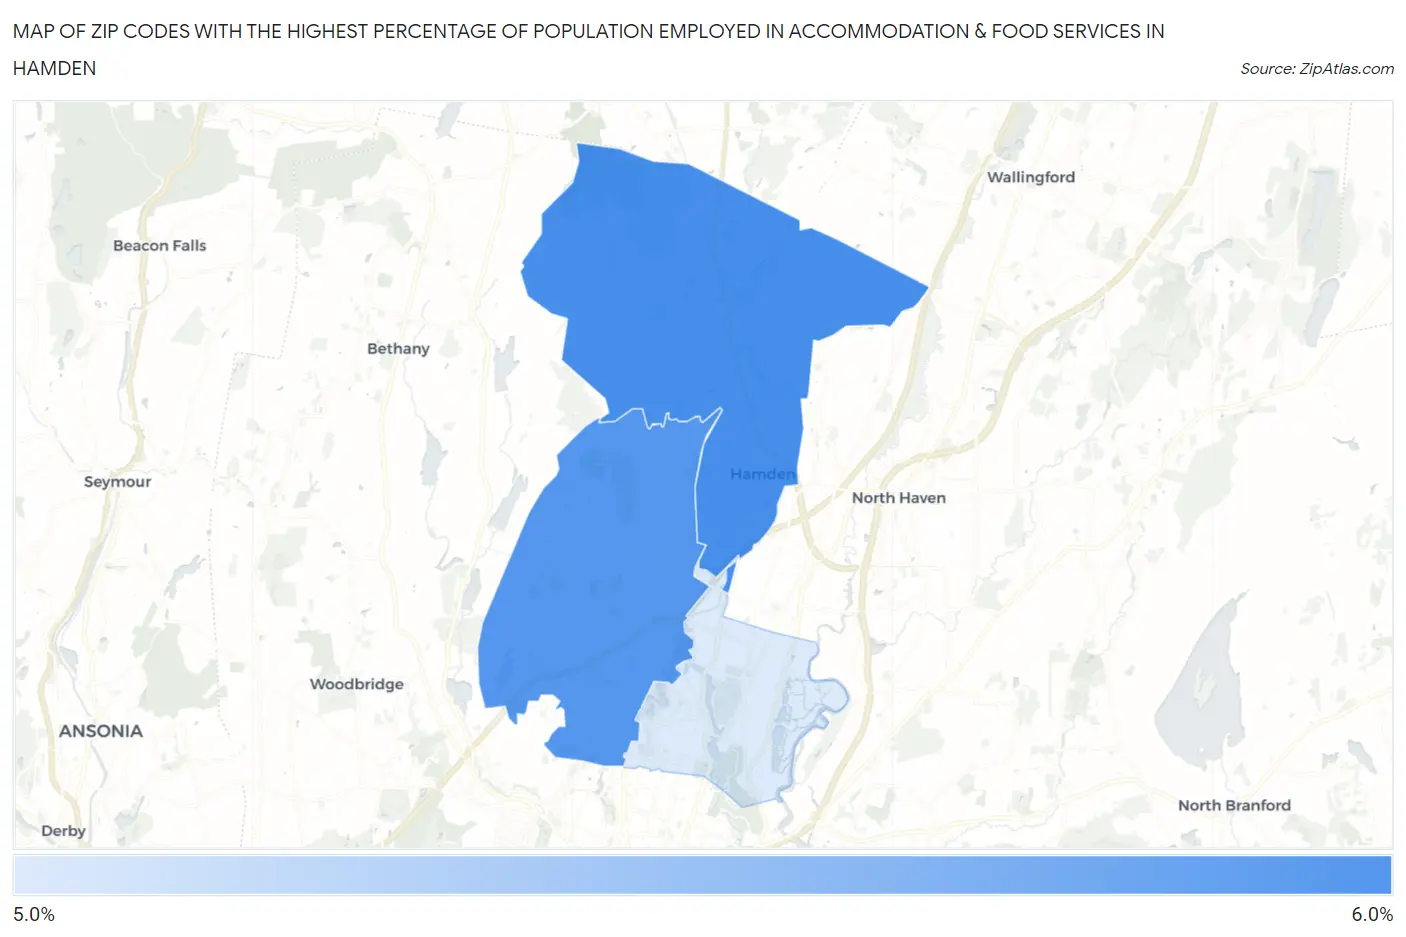
Map of Zip Codes with the Highest Percentage of Population Employed in Accommodation & Food Services in Hamden
5.7%
5.9%
Zip Codes with the Highest Percentage of Population Employed in Accommodation & Food Services in Hamden, CT
| Zip Code | % Employed | vs State | vs National | |
| 1. | 06518 | 5.9% | 5.6%(+0.258)#97 | 6.9%(-0.989)#13,796 |
| 2. | 06514 | 5.9% | 5.6%(+0.245)#100 | 6.9%(-1.00)#13,852 |
| 3. | 06517 | 5.7% | 5.6%(+0.107)#102 | 6.9%(-1.14)#14,257 |
1
Common Questions
What are the Top Zip Codes with the Highest Percentage of Population Employed in Accommodation & Food Services in Hamden, CT?
Top Zip Codes with the Highest Percentage of Population Employed in Accommodation & Food Services in Hamden, CT are:
What zip code has the Highest Percentage of Population Employed in Accommodation & Food Services in Hamden, CT?
06518 has the Highest Percentage of Population Employed in Accommodation & Food Services in Hamden, CT with 5.9%.
What is the Percentage of Population Employed in Accommodation & Food Services in Connecticut?
Percentage of Population Employed in Accommodation & Food Services in Connecticut is 5.6%.
What is the Percentage of Population Employed in Accommodation & Food Services in the United States?
Percentage of Population Employed in Accommodation & Food Services in the United States is 6.9%.