Zip Codes with the Highest Percentage of Population Employed in Accommodation & Food Services in New Haven, CT
RELATED REPORTS & OPTIONS
Accommodation & Food Services
New Haven
Compare Zip Codes
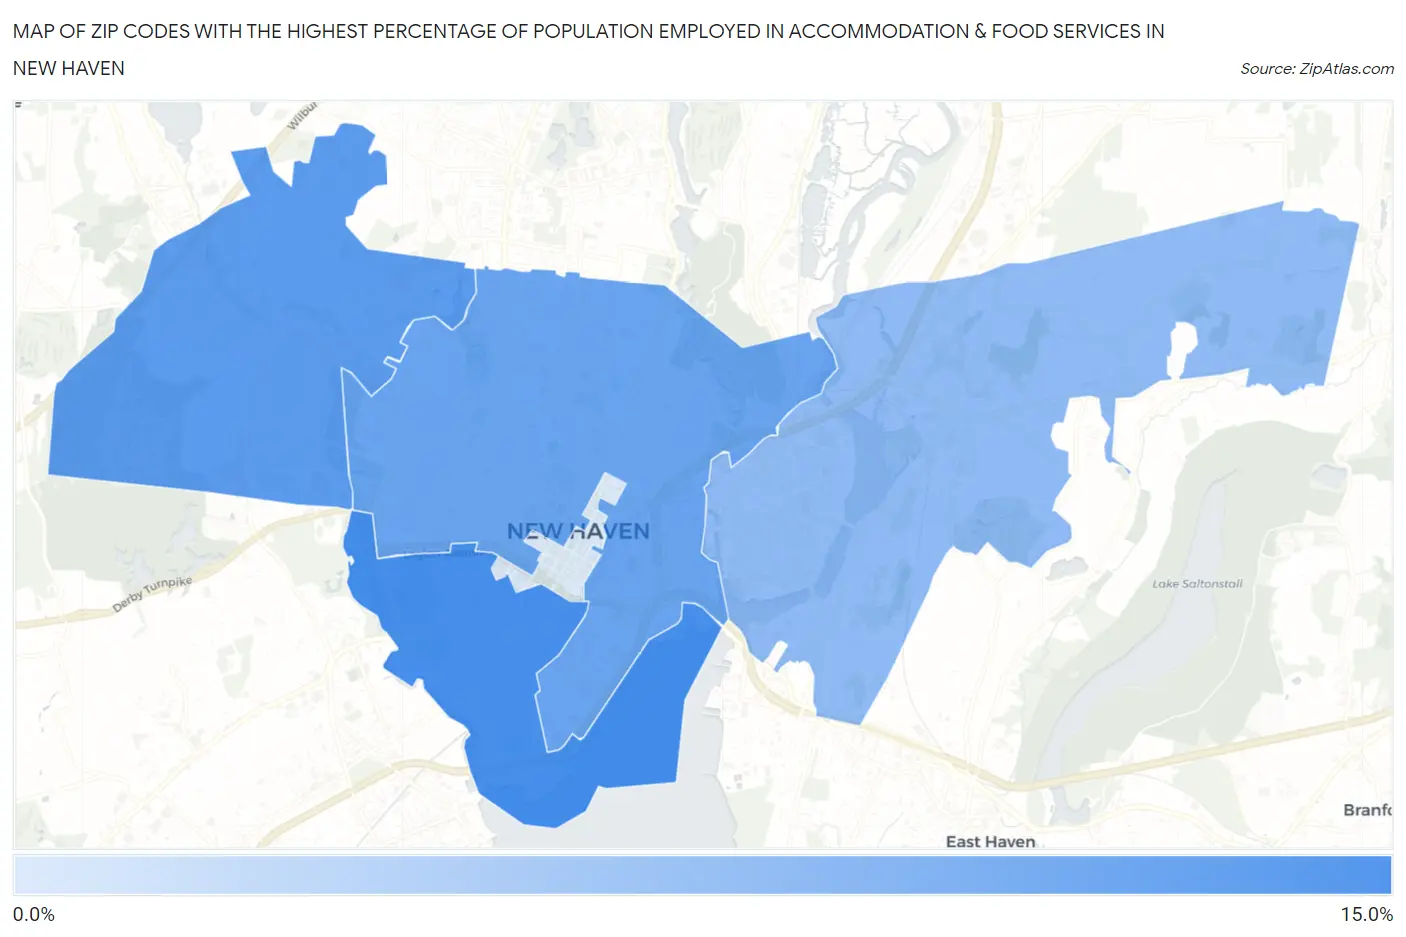
Map of Zip Codes with the Highest Percentage of Population Employed in Accommodation & Food Services in New Haven
1.7%
10.1%
Zip Codes with the Highest Percentage of Population Employed in Accommodation & Food Services in New Haven, CT
| Zip Code | % Employed | vs State | vs National | |
| 1. | 06519 | 10.1% | 5.6%(+4.43)#16 | 6.9%(+3.18)#4,451 |
| 2. | 06515 | 9.0% | 5.6%(+3.40)#27 | 6.9%(+2.15)#5,908 |
| 3. | 06511 | 8.1% | 5.6%(+2.46)#41 | 6.9%(+1.21)#7,635 |
| 4. | 06513 | 6.0% | 5.6%(+0.351)#93 | 6.9%(-0.897)#13,496 |
| 5. | 06510 | 1.7% | 5.6%(-3.90)#248 | 6.9%(-5.14)#26,065 |
1
Common Questions
What are the Top 3 Zip Codes with the Highest Percentage of Population Employed in Accommodation & Food Services in New Haven, CT?
Top 3 Zip Codes with the Highest Percentage of Population Employed in Accommodation & Food Services in New Haven, CT are:
What zip code has the Highest Percentage of Population Employed in Accommodation & Food Services in New Haven, CT?
06519 has the Highest Percentage of Population Employed in Accommodation & Food Services in New Haven, CT with 10.1%.
What is the Percentage of Population Employed in Accommodation & Food Services in New Haven, CT?
Percentage of Population Employed in Accommodation & Food Services in New Haven is 7.5%.
What is the Percentage of Population Employed in Accommodation & Food Services in Connecticut?
Percentage of Population Employed in Accommodation & Food Services in Connecticut is 5.6%.
What is the Percentage of Population Employed in Accommodation & Food Services in the United States?
Percentage of Population Employed in Accommodation & Food Services in the United States is 6.9%.