Lakeville, CT Map & Demographics
Lakeville Map
Lakeville Overview
$62,257
PER CAPITA INCOME
$147,500
AVG FAMILY INCOME
$87,401
AVG HOUSEHOLD INCOME
31.8%
WAGE / INCOME GAP [ % ]
68.2¢/ $1
WAGE / INCOME GAP [ $ ]
0.46
INEQUALITY / GINI INDEX
886
TOTAL POPULATION
395
MALE POPULATION
491
FEMALE POPULATION
80.45
MALES / 100 FEMALES
124.30
FEMALES / 100 MALES
49.1
MEDIAN AGE
2.9
AVG FAMILY SIZE
2.4
AVG HOUSEHOLD SIZE
502
LABOR FORCE [ PEOPLE ]
69.3%
PERCENT IN LABOR FORCE
Lakeville Zip Codes
Lakeville Area Codes
Income in Lakeville
Income Overview in Lakeville
Per Capita Income in Lakeville is $62,257, while median incomes of families and households are $147,500 and $87,401 respectively.
| Characteristic | Number | Measure |
| Per Capita Income | 886 | $62,257 |
| Median Family Income | 232 | $147,500 |
| Mean Family Income | 232 | $182,237 |
| Median Household Income | 339 | $87,401 |
| Mean Household Income | 339 | $158,205 |
| Income Deficit | 232 | $0 |
| Wage / Income Gap (%) | 886 | 31.80% |
| Wage / Income Gap ($) | 886 | 68.20¢ per $1 |
| Gini / Inequality Index | 886 | 0.46 |
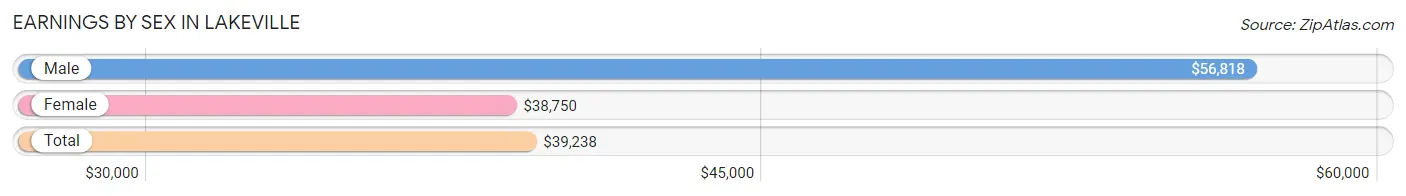
Earnings by Sex in Lakeville
Average Earnings in Lakeville are $39,238, $56,818 for men and $38,750 for women, a difference of 31.8%.
| Sex | Number | Average Earnings |
| Male | 240 (41.7%) | $56,818 |
| Female | 335 (58.3%) | $38,750 |
| Total | 575 (100.0%) | $39,238 |
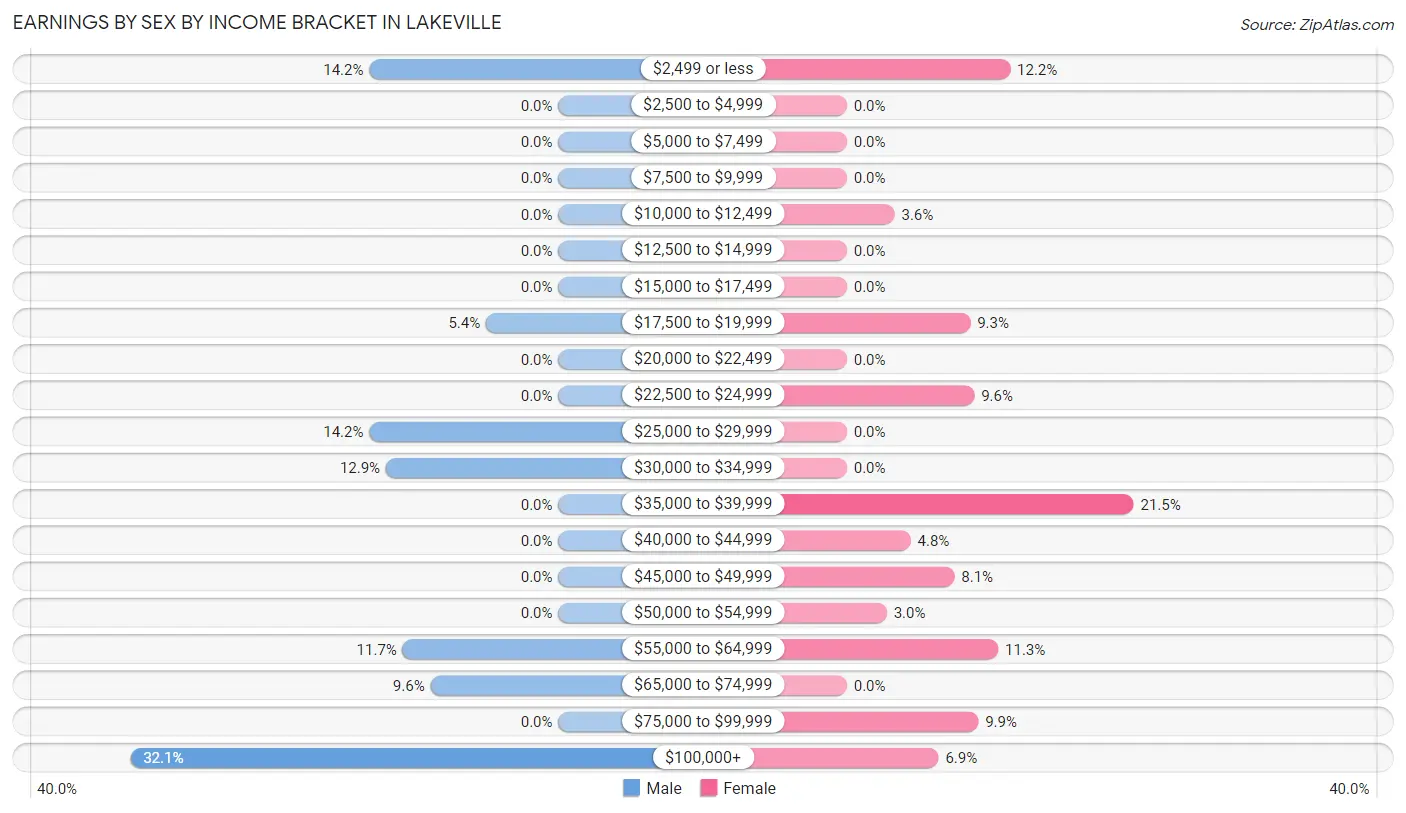
Earnings by Sex by Income Bracket in Lakeville
The most common earnings brackets in Lakeville are $100,000+ for men (77 | 32.1%) and $35,000 to $39,999 for women (72 | 21.5%).
| Income | Male | Female |
| $2,499 or less | 34 (14.2%) | 41 (12.2%) |
| $2,500 to $4,999 | 0 (0.0%) | 0 (0.0%) |
| $5,000 to $7,499 | 0 (0.0%) | 0 (0.0%) |
| $7,500 to $9,999 | 0 (0.0%) | 0 (0.0%) |
| $10,000 to $12,499 | 0 (0.0%) | 12 (3.6%) |
| $12,500 to $14,999 | 0 (0.0%) | 0 (0.0%) |
| $15,000 to $17,499 | 0 (0.0%) | 0 (0.0%) |
| $17,500 to $19,999 | 13 (5.4%) | 31 (9.2%) |
| $20,000 to $22,499 | 0 (0.0%) | 0 (0.0%) |
| $22,500 to $24,999 | 0 (0.0%) | 32 (9.6%) |
| $25,000 to $29,999 | 34 (14.2%) | 0 (0.0%) |
| $30,000 to $34,999 | 31 (12.9%) | 0 (0.0%) |
| $35,000 to $39,999 | 0 (0.0%) | 72 (21.5%) |
| $40,000 to $44,999 | 0 (0.0%) | 16 (4.8%) |
| $45,000 to $49,999 | 0 (0.0%) | 27 (8.1%) |
| $50,000 to $54,999 | 0 (0.0%) | 10 (3.0%) |
| $55,000 to $64,999 | 28 (11.7%) | 38 (11.3%) |
| $65,000 to $74,999 | 23 (9.6%) | 0 (0.0%) |
| $75,000 to $99,999 | 0 (0.0%) | 33 (9.9%) |
| $100,000+ | 77 (32.1%) | 23 (6.9%) |
| Total | 240 (100.0%) | 335 (100.0%) |
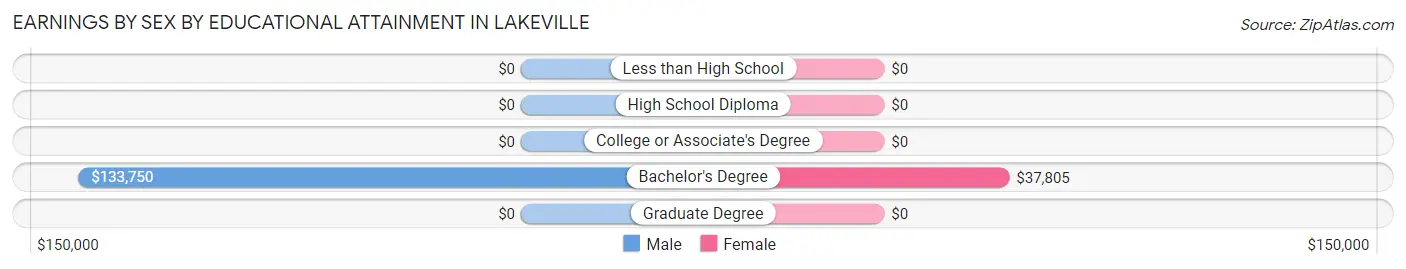
Earnings by Sex by Educational Attainment in Lakeville
Average earnings in Lakeville are $64,706 for men and $39,482 for women, a difference of 39.0%. Men with an educational attainment of bachelor's degree enjoy the highest average annual earnings of $133,750, while those with bachelor's degree education earn the least with $133,750. Women with an educational attainment of bachelor's degree earn the most with the average annual earnings of $37,805, while those with bachelor's degree education have the smallest earnings of $37,805.
| Educational Attainment | Male Income | Female Income |
| Less than High School | - | - |
| High School Diploma | - | - |
| College or Associate's Degree | - | - |
| Bachelor's Degree | $133,750 | $37,805 |
| Graduate Degree | - | - |
| Total | $64,706 | $39,482 |
Family Income in Lakeville
Family Income Brackets in Lakeville
According to the Lakeville family income data, there are 77 families falling into the $200,000+ income range, which is the most common income bracket and makes up 33.2% of all families.
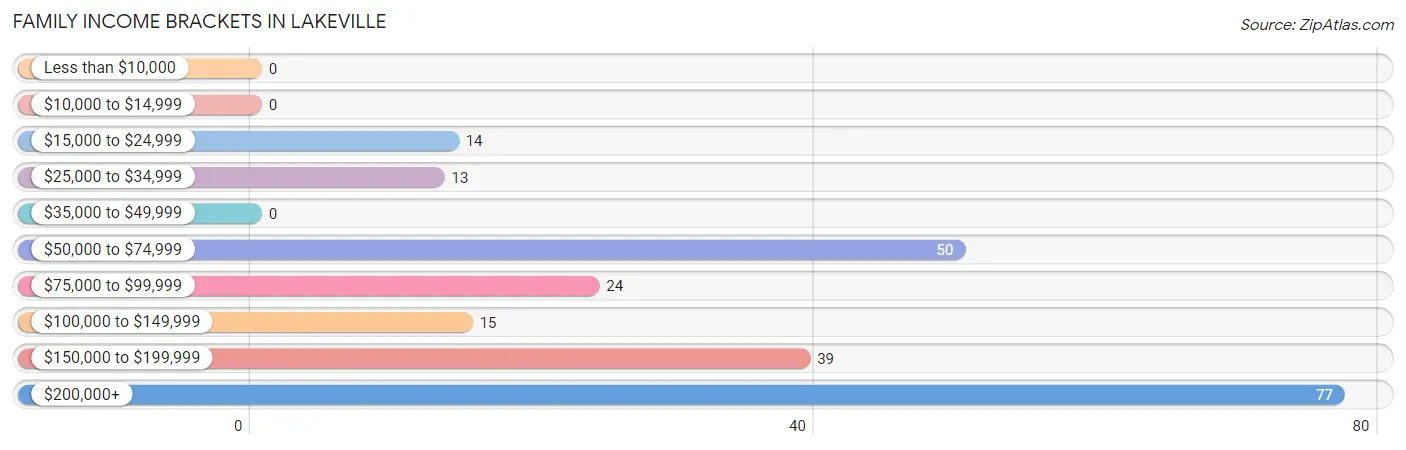
| Income Bracket | # Families | % Families |
| Less than $10,000 | 0 | 0.0% |
| $10,000 to $14,999 | 0 | 0.0% |
| $15,000 to $24,999 | 14 | 6.0% |
| $25,000 to $34,999 | 13 | 5.6% |
| $35,000 to $49,999 | 0 | 0.0% |
| $50,000 to $74,999 | 50 | 21.6% |
| $75,000 to $99,999 | 24 | 10.3% |
| $100,000 to $149,999 | 15 | 6.5% |
| $150,000 to $199,999 | 39 | 16.8% |
| $200,000+ | 77 | 33.2% |
Family Income by Famaliy Size in Lakeville
2-person families (111 | 47.8%) account for the highest median family income in Lakeville with $151,875 per family, while 2-person families (111 | 47.8%) have the highest median income of $75,938 per family member.
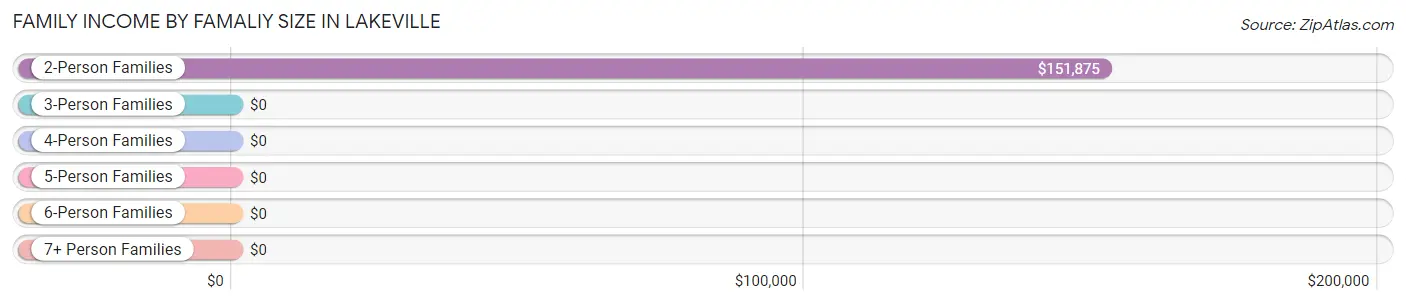
| Income Bracket | # Families | Median Income |
| 2-Person Families | 111 (47.8%) | $151,875 |
| 3-Person Families | 66 (28.4%) | $0 |
| 4-Person Families | 41 (17.7%) | $0 |
| 5-Person Families | 14 (6.0%) | $0 |
| 6-Person Families | 0 (0.0%) | $0 |
| 7+ Person Families | 0 (0.0%) | $0 |
| Total | 232 (100.0%) | $147,500 |
Family Income by Number of Earners in Lakeville
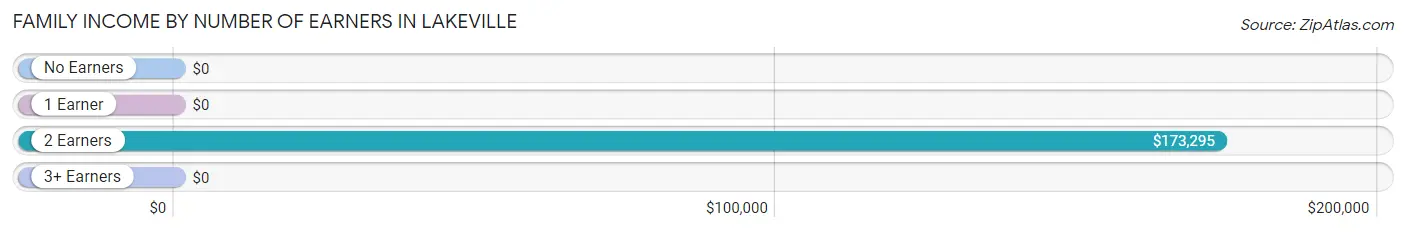
| Number of Earners | # Families | Median Income |
| No Earners | 11 (4.7%) | $0 |
| 1 Earner | 100 (43.1%) | $0 |
| 2 Earners | 91 (39.2%) | $173,295 |
| 3+ Earners | 30 (12.9%) | $0 |
| Total | 232 (100.0%) | $147,500 |
Household Income in Lakeville
Household Income Brackets in Lakeville
With 101 households falling in the category, the $75,000 to $99,999 income range is the most frequent in Lakeville, accounting for 29.8% of all households.
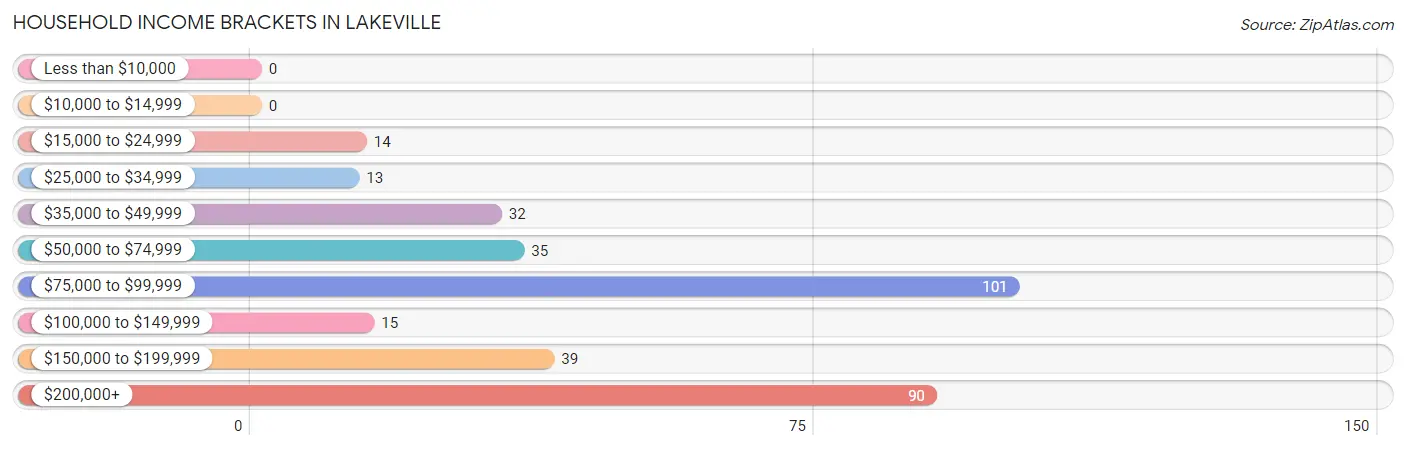
| Income Bracket | # Households | % Households |
| Less than $10,000 | 0 | 0.0% |
| $10,000 to $14,999 | 0 | 0.0% |
| $15,000 to $24,999 | 14 | 4.1% |
| $25,000 to $34,999 | 13 | 3.8% |
| $35,000 to $49,999 | 32 | 9.4% |
| $50,000 to $74,999 | 35 | 10.3% |
| $75,000 to $99,999 | 101 | 29.8% |
| $100,000 to $149,999 | 15 | 4.4% |
| $150,000 to $199,999 | 39 | 11.5% |
| $200,000+ | 90 | 26.5% |
Household Income by Householder Age in Lakeville
The median household income in Lakeville is $87,401, with the highest median household income of $150,208 found in the 45 to 64 years age bracket for the primary householder. A total of 113 households (33.3%) fall into this category.
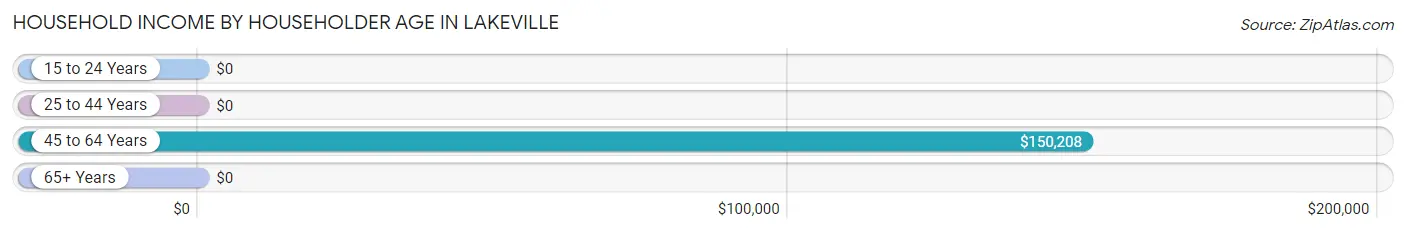
| Income Bracket | # Households | Median Income |
| 15 to 24 Years | 0 (0.0%) | $0 |
| 25 to 44 Years | 79 (23.3%) | $0 |
| 45 to 64 Years | 113 (33.3%) | $150,208 |
| 65+ Years | 147 (43.4%) | $0 |
| Total | 339 (100.0%) | $87,401 |
Poverty in Lakeville
Income Below Poverty by Sex and Age in Lakeville
With 10.4% poverty level for males and 10.6% for females among the residents of Lakeville, 55 to 64 year old males and 12 to 14 year old females are the most vulnerable to poverty, with 28 males (23.7%) and 13 females (100.0%) in their respective age groups living below the poverty level.
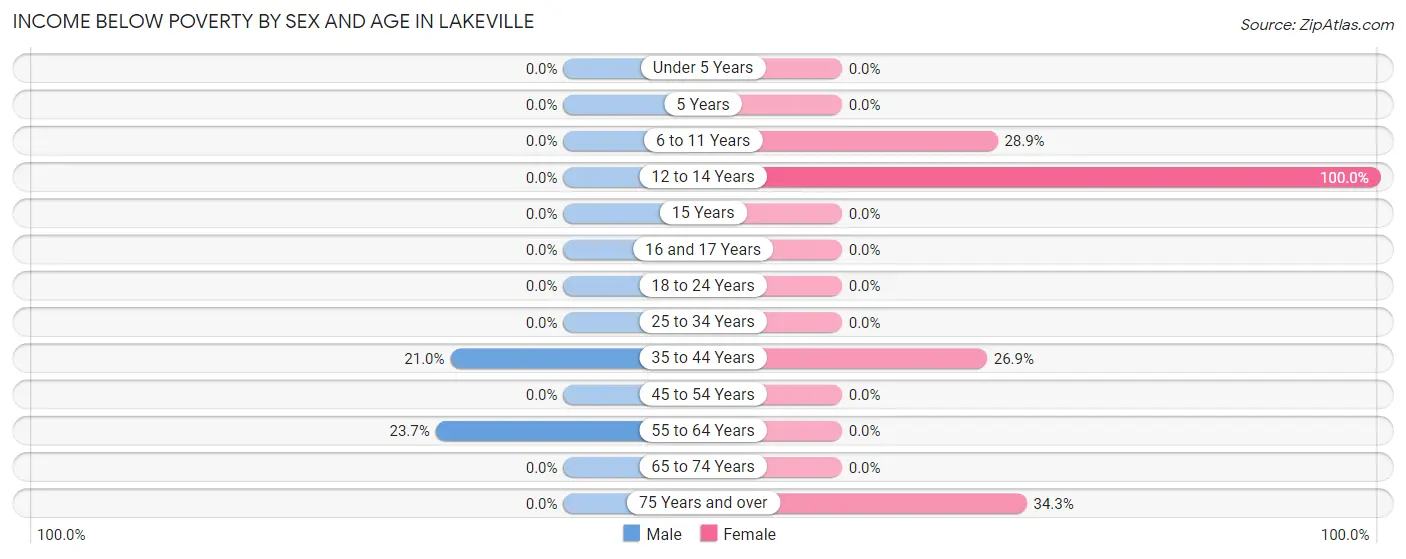
| Age Bracket | Male | Female |
| Under 5 Years | 0 (0.0%) | 0 (0.0%) |
| 5 Years | 0 (0.0%) | 0 (0.0%) |
| 6 to 11 Years | 0 (0.0%) | 13 (28.9%) |
| 12 to 14 Years | 0 (0.0%) | 13 (100.0%) |
| 15 Years | 0 (0.0%) | 0 (0.0%) |
| 16 and 17 Years | 0 (0.0%) | 0 (0.0%) |
| 18 to 24 Years | 0 (0.0%) | 0 (0.0%) |
| 25 to 34 Years | 0 (0.0%) | 0 (0.0%) |
| 35 to 44 Years | 13 (21.0%) | 14 (26.9%) |
| 45 to 54 Years | 0 (0.0%) | 0 (0.0%) |
| 55 to 64 Years | 28 (23.7%) | 0 (0.0%) |
| 65 to 74 Years | 0 (0.0%) | 0 (0.0%) |
| 75 Years and over | 0 (0.0%) | 12 (34.3%) |
| Total | 41 (10.4%) | 52 (10.6%) |
Income Above Poverty by Sex and Age in Lakeville
According to the poverty statistics in Lakeville, males aged under 5 years and females aged 5 years are the age groups that are most secure financially, with 100.0% of males and 100.0% of females in these age groups living above the poverty line.
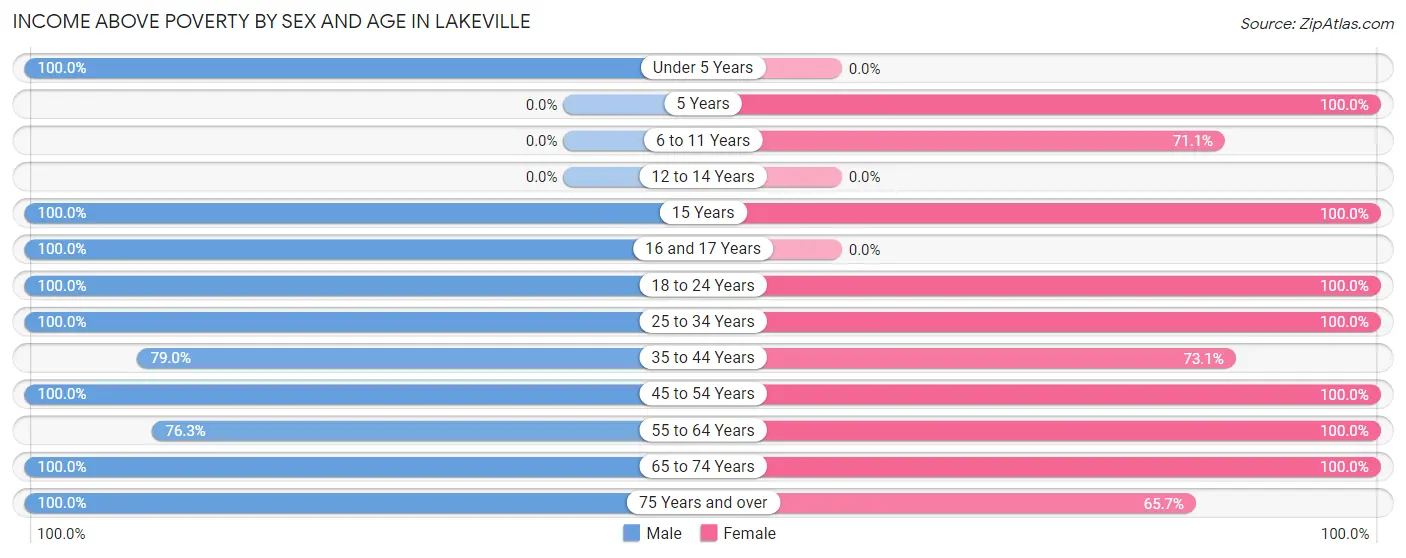
| Age Bracket | Male | Female |
| Under 5 Years | 52 (100.0%) | 0 (0.0%) |
| 5 Years | 0 (0.0%) | 17 (100.0%) |
| 6 to 11 Years | 0 (0.0%) | 32 (71.1%) |
| 12 to 14 Years | 0 (0.0%) | 0 (0.0%) |
| 15 Years | 16 (100.0%) | 19 (100.0%) |
| 16 and 17 Years | 33 (100.0%) | 0 (0.0%) |
| 18 to 24 Years | 18 (100.0%) | 24 (100.0%) |
| 25 to 34 Years | 11 (100.0%) | 46 (100.0%) |
| 35 to 44 Years | 49 (79.0%) | 38 (73.1%) |
| 45 to 54 Years | 15 (100.0%) | 99 (100.0%) |
| 55 to 64 Years | 90 (76.3%) | 54 (100.0%) |
| 65 to 74 Years | 35 (100.0%) | 87 (100.0%) |
| 75 Years and over | 35 (100.0%) | 23 (65.7%) |
| Total | 354 (89.6%) | 439 (89.4%) |
Income Below Poverty Among Married-Couple Families in Lakeville
The poverty statistics for married-couple families in Lakeville show that 7.9% or 14 of the total 177 families live below the poverty line. Families with 1 or 2 children have the highest poverty rate of 16.9%, comprising of 14 families. On the other hand, families with no children have the lowest poverty rate of 0.0%, which includes 0 families.
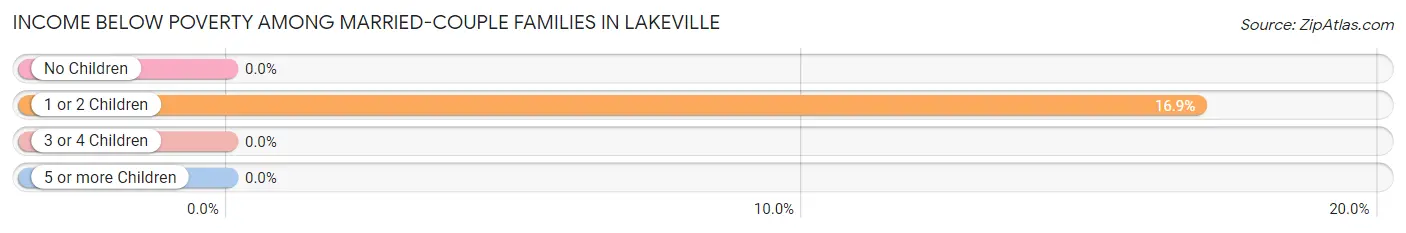
| Children | Above Poverty | Below Poverty |
| No Children | 94 (100.0%) | 0 (0.0%) |
| 1 or 2 Children | 69 (83.1%) | 14 (16.9%) |
| 3 or 4 Children | 0 (0.0%) | 0 (0.0%) |
| 5 or more Children | 0 (0.0%) | 0 (0.0%) |
| Total | 163 (92.1%) | 14 (7.9%) |
Income Below Poverty Among Single-Parent Households in Lakeville
| Children | Single Father | Single Mother |
| No Children | 0 (0.0%) | 0 (0.0%) |
| 1 or 2 Children | 0 (0.0%) | 0 (0.0%) |
| 3 or 4 Children | 0 (0.0%) | 0 (0.0%) |
| 5 or more Children | 0 (0.0%) | 0 (0.0%) |
| Total | 0 (0.0%) | 0 (0.0%) |
Income Below Poverty Among Married-Couple vs Single-Parent Households in Lakeville
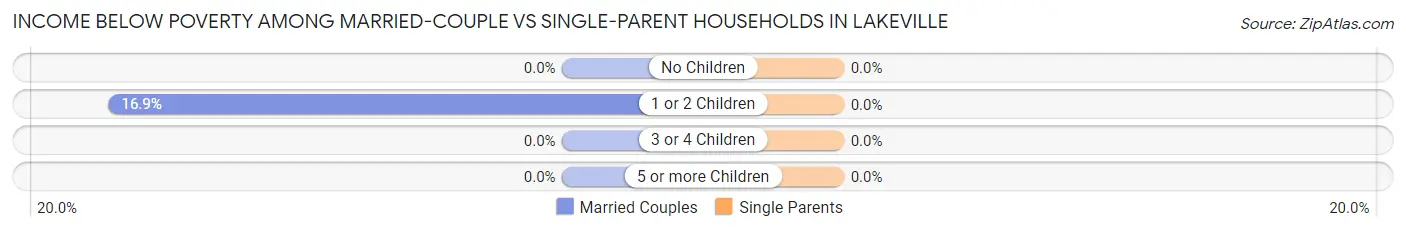
| Children | Married-Couple Families | Single-Parent Households |
| No Children | 0 (0.0%) | 0 (0.0%) |
| 1 or 2 Children | 14 (16.9%) | 0 (0.0%) |
| 3 or 4 Children | 0 (0.0%) | 0 (0.0%) |
| 5 or more Children | 0 (0.0%) | 0 (0.0%) |
| Total | 14 (7.9%) | 0 (0.0%) |
Race in Lakeville
The most populous races in Lakeville are , and White / Caucasian (886 | 100.0%).
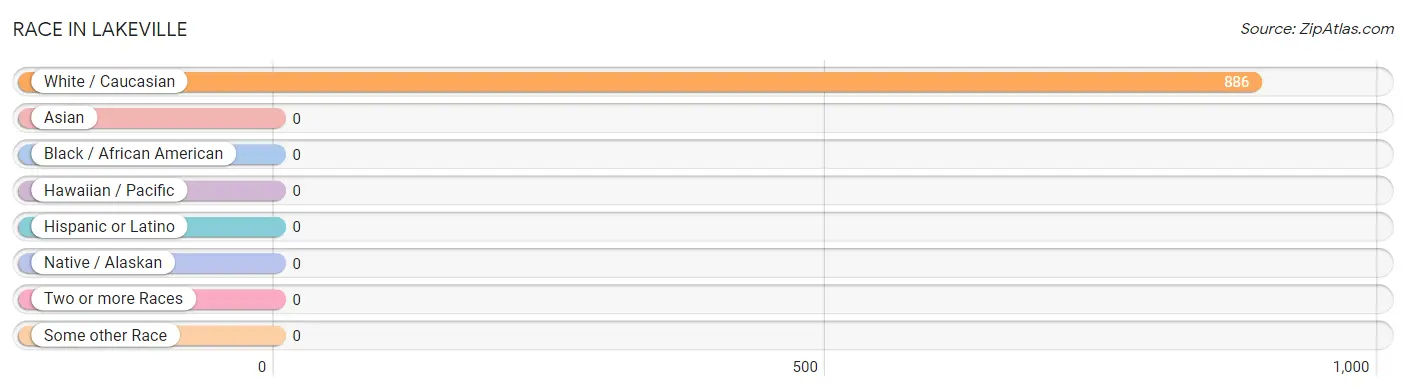
| Race | # Population | % Population |
| Asian | 0 | 0.0% |
| Black / African American | 0 | 0.0% |
| Hawaiian / Pacific | 0 | 0.0% |
| Hispanic or Latino | 0 | 0.0% |
| Native / Alaskan | 0 | 0.0% |
| White / Caucasian | 886 | 100.0% |
| Two or more Races | 0 | 0.0% |
| Some other Race | 0 | 0.0% |
| Total | 886 | 100.0% |
Ancestry in Lakeville
The most populous ancestries reported in Lakeville are Irish (262 | 29.6%), German (246 | 27.8%), English (232 | 26.2%), Italian (205 | 23.1%), and Dutch (43 | 4.9%), together accounting for 111.5% of all Lakeville residents.
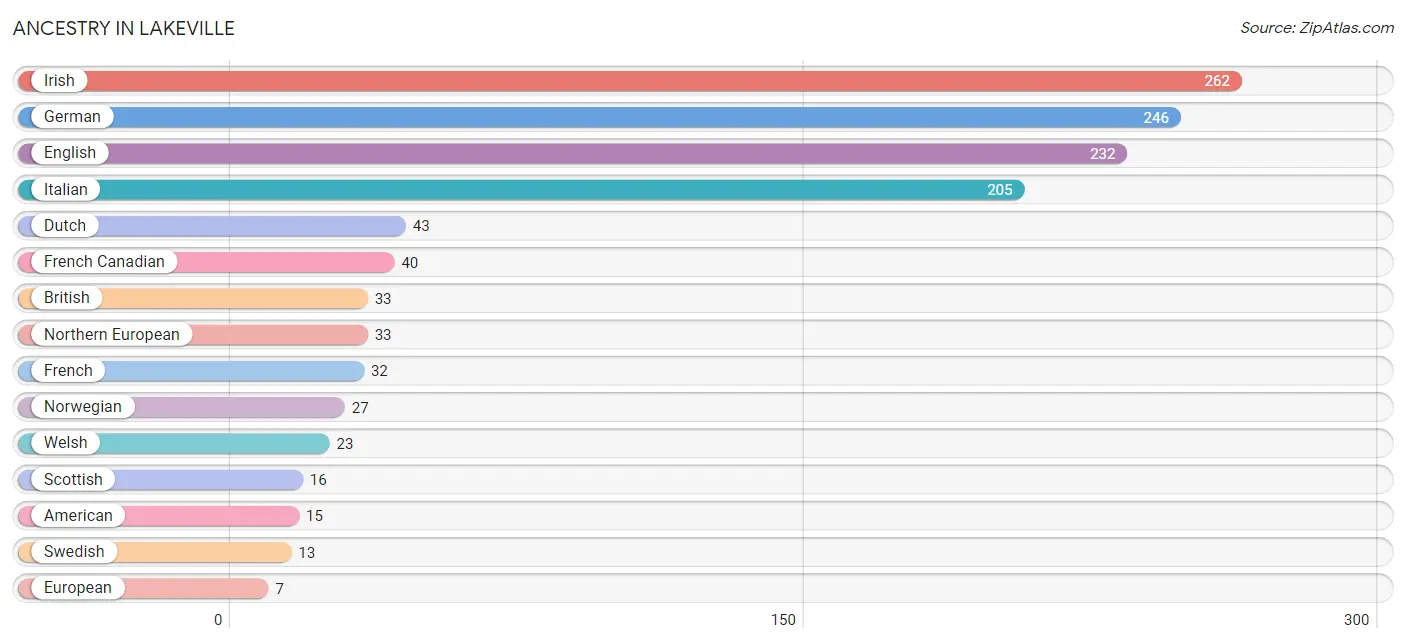
| Ancestry | # Population | % Population |
| American | 15 | 1.7% |
| British | 33 | 3.7% |
| Dutch | 43 | 4.9% |
| English | 232 | 26.2% |
| European | 7 | 0.8% |
| French | 32 | 3.6% |
| French Canadian | 40 | 4.5% |
| German | 246 | 27.8% |
| Hungarian | 4 | 0.4% |
| Irish | 262 | 29.6% |
| Italian | 205 | 23.1% |
| Lithuanian | 3 | 0.3% |
| Northern European | 33 | 3.7% |
| Norwegian | 27 | 3.0% |
| Scottish | 16 | 1.8% |
| Swedish | 13 | 1.5% |
| Welsh | 23 | 2.6% | View All 17 Rows |
Immigrants in Lakeville
The most numerous immigrant groups reported in Lakeville came from , and Canada (10 | 1.1%), together accounting for 1.1% of all Lakeville residents.

| Immigration Origin | # Population | % Population |
| Canada | 10 | 1.1% | View All 1 Rows |
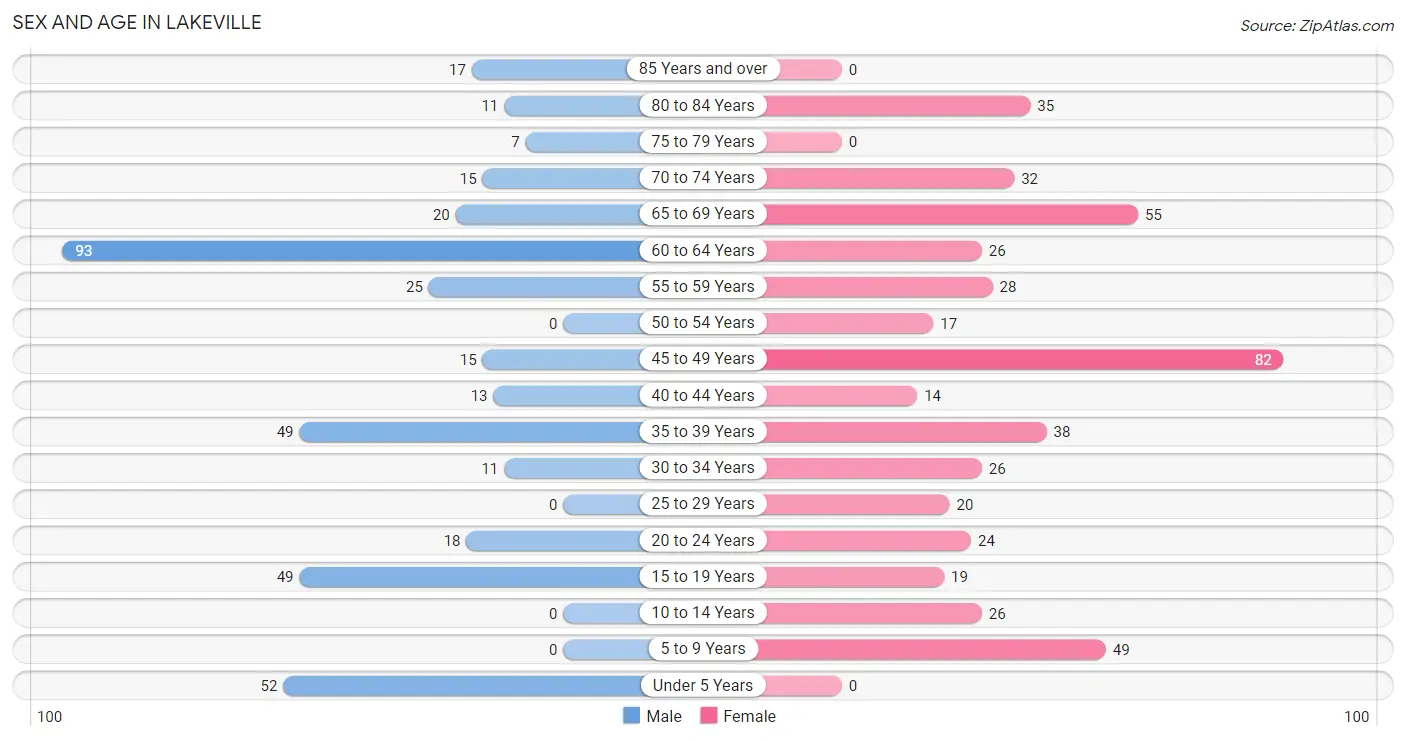
Sex and Age in Lakeville
Sex and Age in Lakeville
The most populous age groups in Lakeville are 60 to 64 Years (93 | 23.5%) for men and 45 to 49 Years (82 | 16.7%) for women.
| Age Bracket | Male | Female |
| Under 5 Years | 52 (13.2%) | 0 (0.0%) |
| 5 to 9 Years | 0 (0.0%) | 49 (10.0%) |
| 10 to 14 Years | 0 (0.0%) | 26 (5.3%) |
| 15 to 19 Years | 49 (12.4%) | 19 (3.9%) |
| 20 to 24 Years | 18 (4.6%) | 24 (4.9%) |
| 25 to 29 Years | 0 (0.0%) | 20 (4.1%) |
| 30 to 34 Years | 11 (2.8%) | 26 (5.3%) |
| 35 to 39 Years | 49 (12.4%) | 38 (7.7%) |
| 40 to 44 Years | 13 (3.3%) | 14 (2.9%) |
| 45 to 49 Years | 15 (3.8%) | 82 (16.7%) |
| 50 to 54 Years | 0 (0.0%) | 17 (3.5%) |
| 55 to 59 Years | 25 (6.3%) | 28 (5.7%) |
| 60 to 64 Years | 93 (23.5%) | 26 (5.3%) |
| 65 to 69 Years | 20 (5.1%) | 55 (11.2%) |
| 70 to 74 Years | 15 (3.8%) | 32 (6.5%) |
| 75 to 79 Years | 7 (1.8%) | 0 (0.0%) |
| 80 to 84 Years | 11 (2.8%) | 35 (7.1%) |
| 85 Years and over | 17 (4.3%) | 0 (0.0%) |
| Total | 395 (100.0%) | 491 (100.0%) |
Families and Households in Lakeville
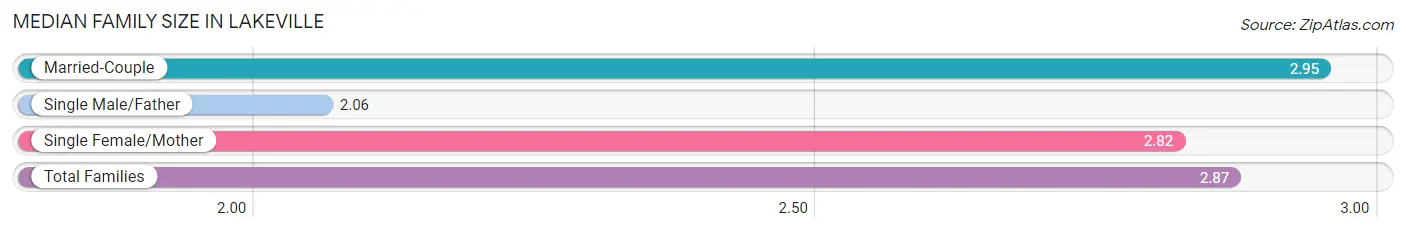
Median Family Size in Lakeville
The median family size in Lakeville is 2.87 persons per family, with married-couple families (177 | 76.3%) accounting for the largest median family size of 2.95 persons per family. On the other hand, single male/father families (17 | 7.3%) represent the smallest median family size with 2.06 persons per family.
| Family Type | # Families | Family Size |
| Married-Couple | 177 (76.3%) | 2.95 |
| Single Male/Father | 17 (7.3%) | 2.06 |
| Single Female/Mother | 38 (16.4%) | 2.82 |
| Total Families | 232 (100.0%) | 2.87 |
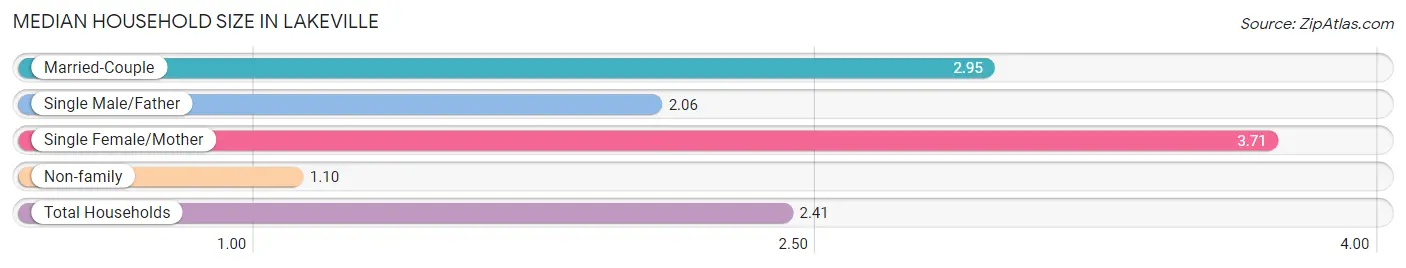
Median Household Size in Lakeville
The median household size in Lakeville is 2.41 persons per household, with single female/mother households (38 | 11.2%) accounting for the largest median household size of 3.71 persons per household. non-family households (107 | 31.6%) represent the smallest median household size with 1.10 persons per household.
| Household Type | # Households | Household Size |
| Married-Couple | 177 (52.2%) | 2.95 |
| Single Male/Father | 17 (5.0%) | 2.06 |
| Single Female/Mother | 38 (11.2%) | 3.71 |
| Non-family | 107 (31.6%) | 1.10 |
| Total Households | 339 (100.0%) | 2.41 |
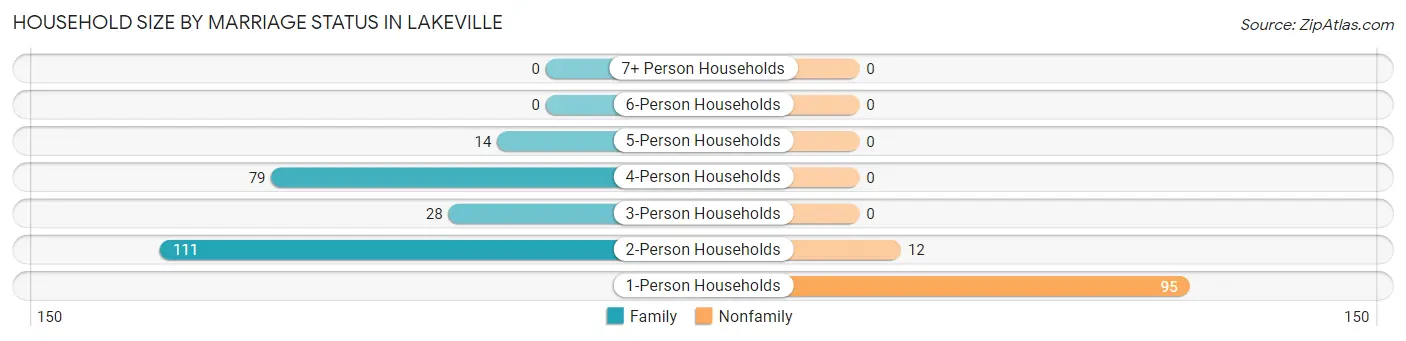
Household Size by Marriage Status in Lakeville
Out of a total of 339 households in Lakeville, 232 (68.4%) are family households, while 107 (31.6%) are nonfamily households. The most numerous type of family households are 2-person households, comprising 111, and the most common type of nonfamily households are 1-person households, comprising 95.
| Household Size | Family Households | Nonfamily Households |
| 1-Person Households | - | 95 (28.0%) |
| 2-Person Households | 111 (32.7%) | 12 (3.5%) |
| 3-Person Households | 28 (8.3%) | 0 (0.0%) |
| 4-Person Households | 79 (23.3%) | 0 (0.0%) |
| 5-Person Households | 14 (4.1%) | 0 (0.0%) |
| 6-Person Households | 0 (0.0%) | 0 (0.0%) |
| 7+ Person Households | 0 (0.0%) | 0 (0.0%) |
| Total | 232 (68.4%) | 107 (31.6%) |
Female Fertility in Lakeville
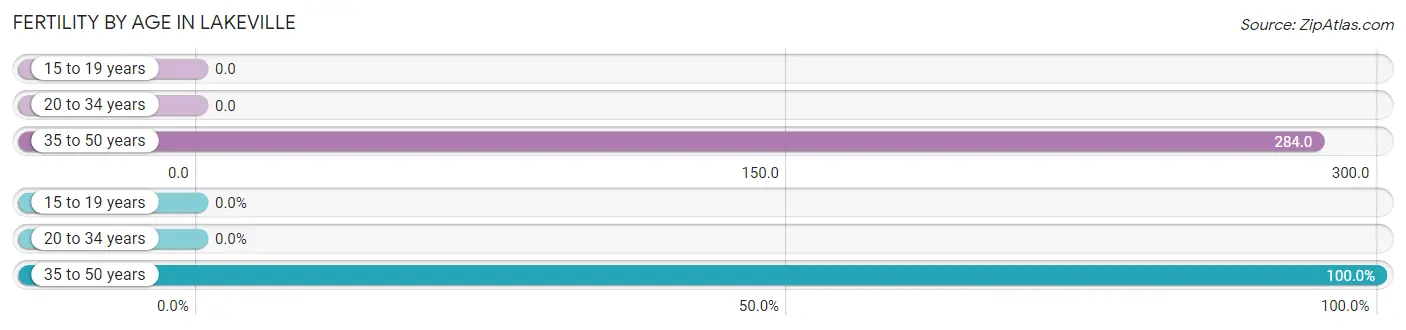
Fertility by Age in Lakeville
Average fertility rate in Lakeville is 170.0 births per 1,000 women. Women in the age bracket of 35 to 50 years have the highest fertility rate with 284.0 births per 1,000 women. Women in the age bracket of 35 to 50 years acount for 100.0% of all women with births.
| Age Bracket | Women with Births | Births / 1,000 Women |
| 15 to 19 years | 0 (0.0%) | 0.0 |
| 20 to 34 years | 0 (0.0%) | 0.0 |
| 35 to 50 years | 38 (100.0%) | 284.0 |
| Total | 38 (100.0%) | 170.0 |
Fertility by Age by Marriage Status in Lakeville
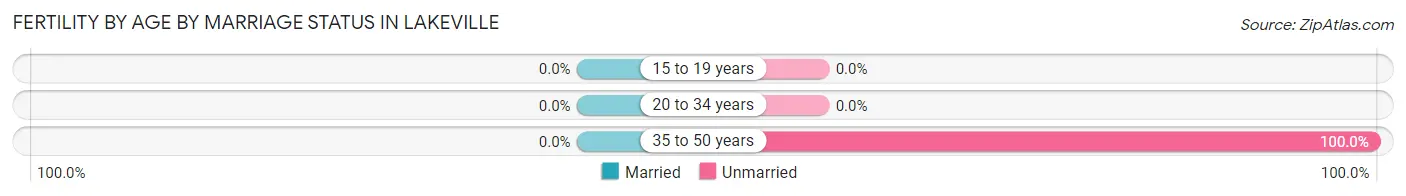
| Age Bracket | Married | Unmarried |
| 15 to 19 years | 0 (0.0%) | 0 (0.0%) |
| 20 to 34 years | 0 (0.0%) | 0 (0.0%) |
| 35 to 50 years | 0 (0.0%) | 38 (100.0%) |
| Total | 0 (0.0%) | 38 (100.0%) |
Fertility by Education in Lakeville
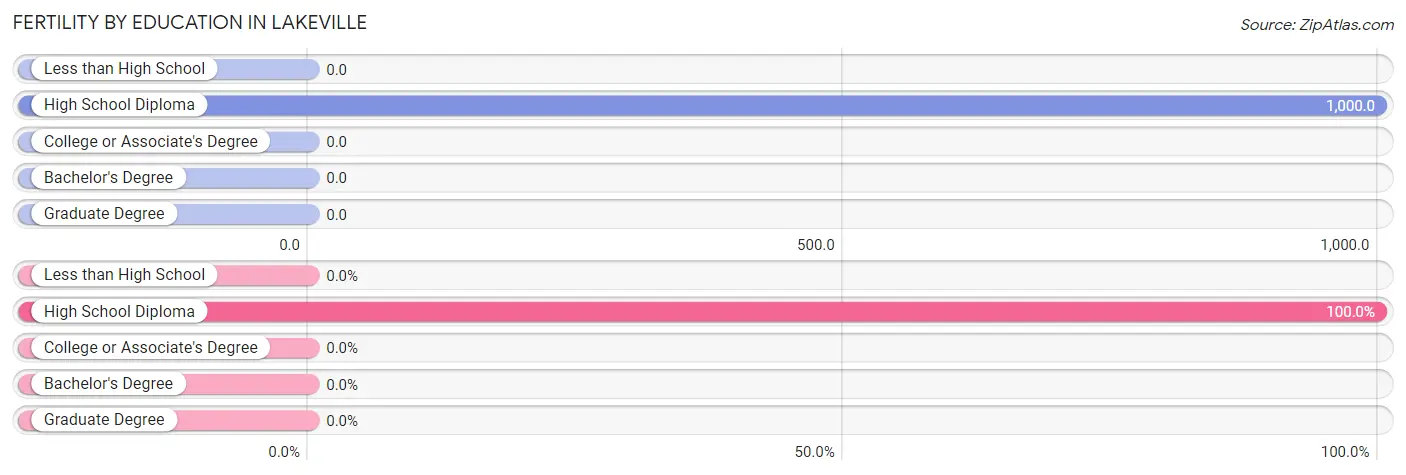
| Educational Attainment | Women with Births | Births / 1,000 Women |
| Less than High School | 0 (0.0%) | 0.0 |
| High School Diploma | 38 (100.0%) | 1,000.0 |
| College or Associate's Degree | 0 (0.0%) | 0.0 |
| Bachelor's Degree | 0 (0.0%) | 0.0 |
| Graduate Degree | 0 (0.0%) | 0.0 |
| Total | 38 (100.0%) | 170.0 |
Fertility by Education by Marriage Status in Lakeville
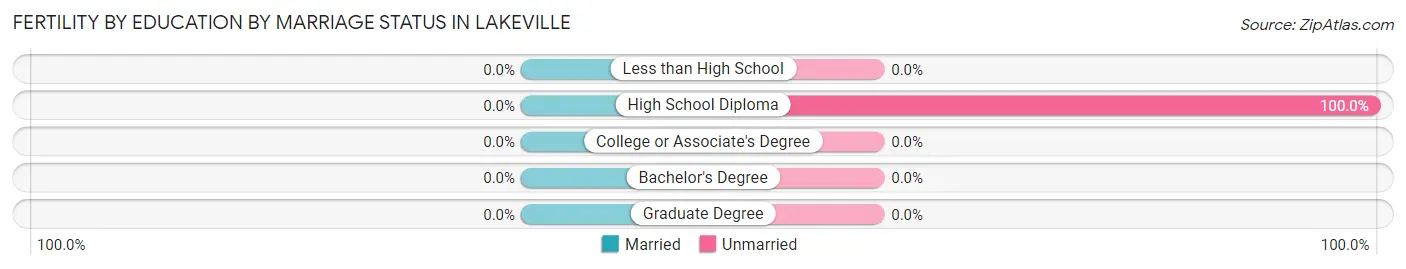
| Educational Attainment | Married | Unmarried |
| Less than High School | 0 (0.0%) | 0 (0.0%) |
| High School Diploma | 0 (0.0%) | 38 (100.0%) |
| College or Associate's Degree | 0 (0.0%) | 0 (0.0%) |
| Bachelor's Degree | 0 (0.0%) | 0 (0.0%) |
| Graduate Degree | 0 (0.0%) | 0 (0.0%) |
| Total | 0 (0.0%) | 38 (100.0%) |
Employment Characteristics in Lakeville
Employment by Class of Employer in Lakeville
Among the 456 employed individuals in Lakeville, private company employees (194 | 42.5%), self-employed (not incorporated) (108 | 23.7%), and local government employees (49 | 10.7%) make up the most common classes of employment.
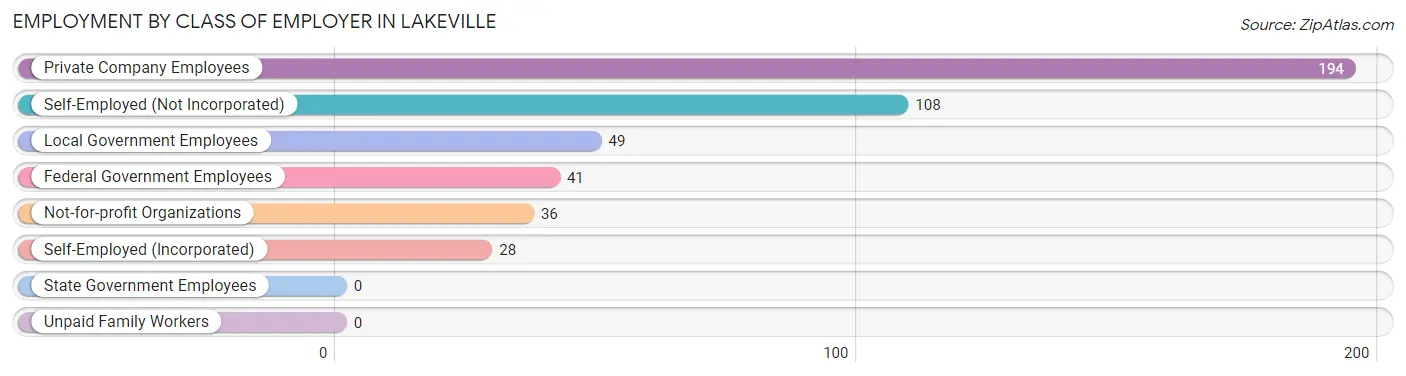
| Employer Class | # Employees | % Employees |
| Private Company Employees | 194 | 42.5% |
| Self-Employed (Incorporated) | 28 | 6.1% |
| Self-Employed (Not Incorporated) | 108 | 23.7% |
| Not-for-profit Organizations | 36 | 7.9% |
| Local Government Employees | 49 | 10.7% |
| State Government Employees | 0 | 0.0% |
| Federal Government Employees | 41 | 9.0% |
| Unpaid Family Workers | 0 | 0.0% |
| Total | 456 | 100.0% |
Employment Status by Age in Lakeville
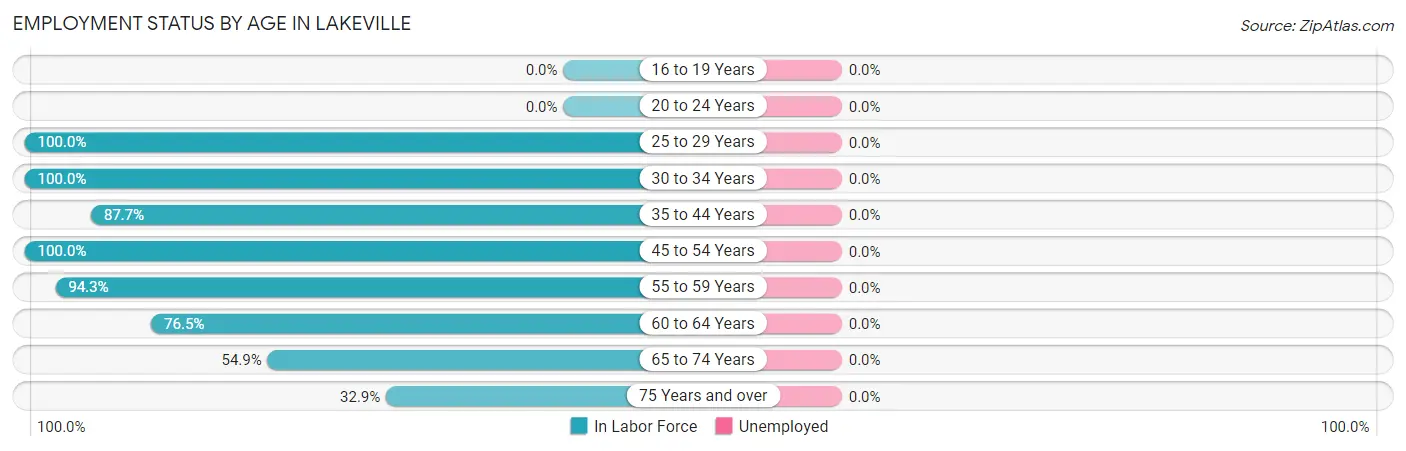
| Age Bracket | In Labor Force | Unemployed |
| 16 to 19 Years | 0 (0.0%) | 0 (0.0%) |
| 20 to 24 Years | 0 (0.0%) | 0 (0.0%) |
| 25 to 29 Years | 20 (100.0%) | 0 (0.0%) |
| 30 to 34 Years | 37 (100.0%) | 0 (0.0%) |
| 35 to 44 Years | 100 (87.7%) | 0 (0.0%) |
| 45 to 54 Years | 114 (100.0%) | 0 (0.0%) |
| 55 to 59 Years | 50 (94.3%) | 0 (0.0%) |
| 60 to 64 Years | 91 (76.5%) | 0 (0.0%) |
| 65 to 74 Years | 67 (54.9%) | 0 (0.0%) |
| 75 Years and over | 23 (32.9%) | 0 (0.0%) |
| Total | 502 (69.3%) | 0 (0.0%) |
Employment Status by Educational Attainment in Lakeville

| Educational Attainment | In Labor Force | Unemployed |
| Less than High School | 0 (0.0%) | 0 (0.0%) |
| High School Diploma | 92 (100.0%) | 0 (0.0%) |
| College / Associate Degree | 67 (100.0%) | 0 (0.0%) |
| Bachelor's Degree or higher | 253 (84.9%) | 0 (0.0%) |
| Total | 412 (90.2%) | 0 (0.0%) |
Employment Occupations by Sex in Lakeville
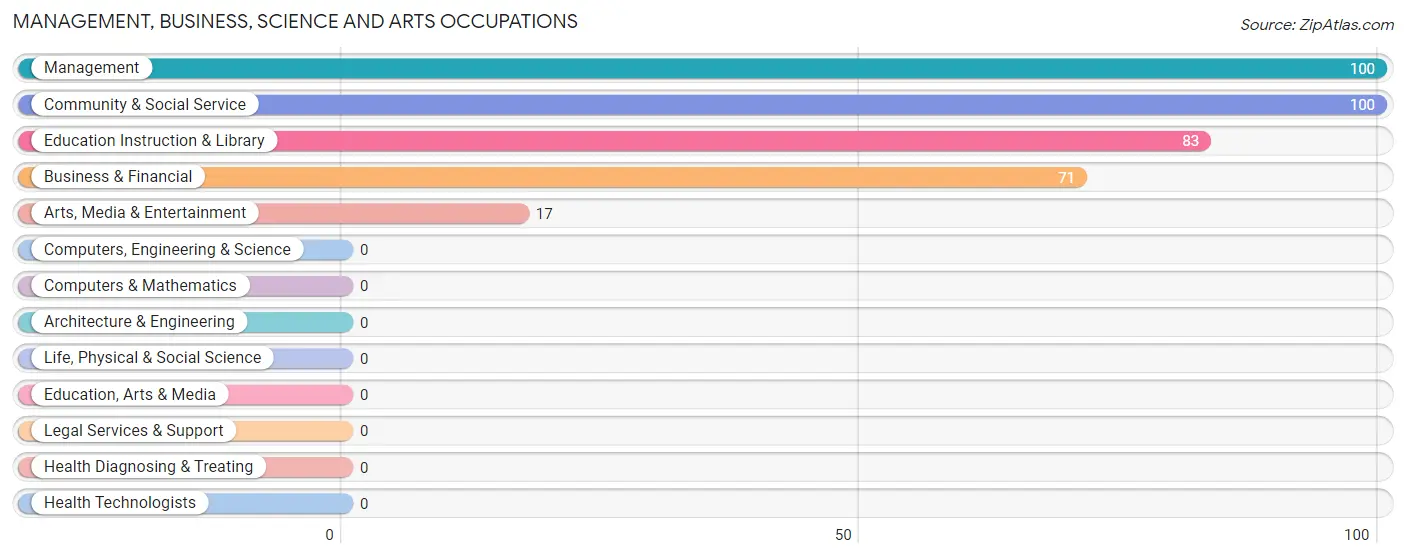
Management, Business, Science and Arts Occupations
The most common Management, Business, Science and Arts occupations in Lakeville are Management (100 | 19.9%), Community & Social Service (100 | 19.9%), Education Instruction & Library (83 | 16.5%), Business & Financial (71 | 14.1%), and Arts, Media & Entertainment (17 | 3.4%).
Management, Business, Science and Arts Occupations by Sex
Within the Management, Business, Science and Arts occupations in Lakeville, the most male-oriented occupations are Arts, Media & Entertainment (100.0%), Management (50.0%), and Community & Social Service (31.0%), while the most female-oriented occupations are Business & Financial (85.9%), Education Instruction & Library (83.1%), and Community & Social Service (69.0%).
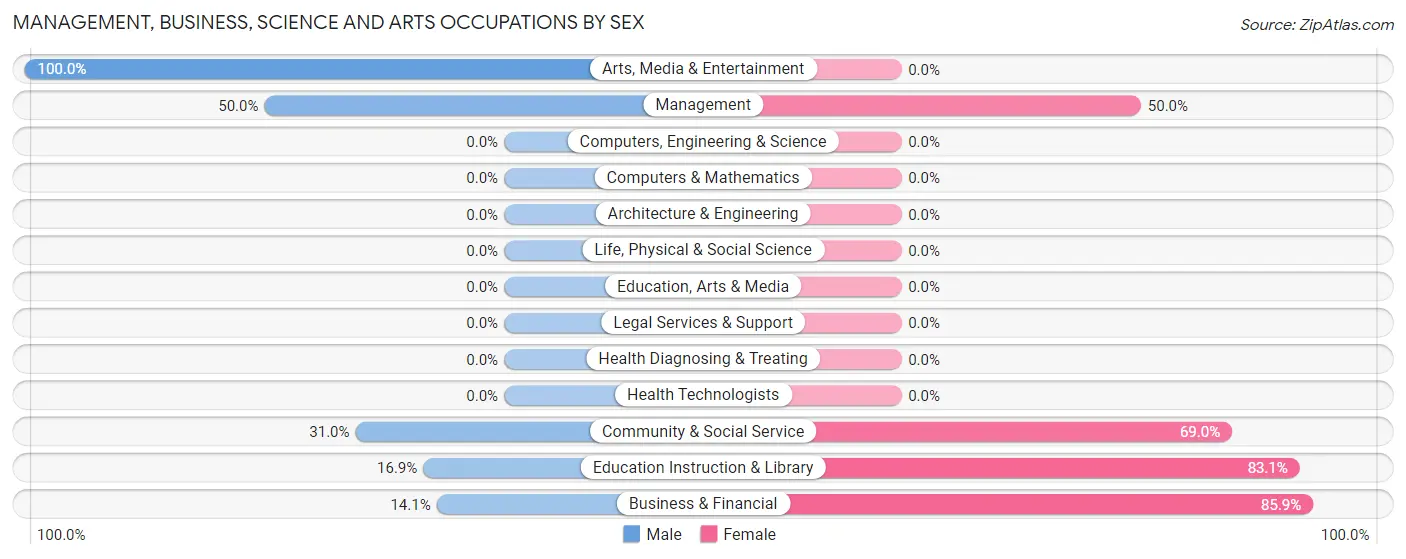
| Occupation | Male | Female |
| Management | 50 (50.0%) | 50 (50.0%) |
| Business & Financial | 10 (14.1%) | 61 (85.9%) |
| Computers, Engineering & Science | 0 (0.0%) | 0 (0.0%) |
| Computers & Mathematics | 0 (0.0%) | 0 (0.0%) |
| Architecture & Engineering | 0 (0.0%) | 0 (0.0%) |
| Life, Physical & Social Science | 0 (0.0%) | 0 (0.0%) |
| Community & Social Service | 31 (31.0%) | 69 (69.0%) |
| Education, Arts & Media | 0 (0.0%) | 0 (0.0%) |
| Legal Services & Support | 0 (0.0%) | 0 (0.0%) |
| Education Instruction & Library | 14 (16.9%) | 69 (83.1%) |
| Arts, Media & Entertainment | 17 (100.0%) | 0 (0.0%) |
| Health Diagnosing & Treating | 0 (0.0%) | 0 (0.0%) |
| Health Technologists | 0 (0.0%) | 0 (0.0%) |
| Total (Category) | 91 (33.6%) | 180 (66.4%) |
| Total (Overall) | 191 (38.1%) | 311 (62.0%) |
Services Occupations
The most common Services occupations in Lakeville are , and Healthcare Support (12 | 2.4%).
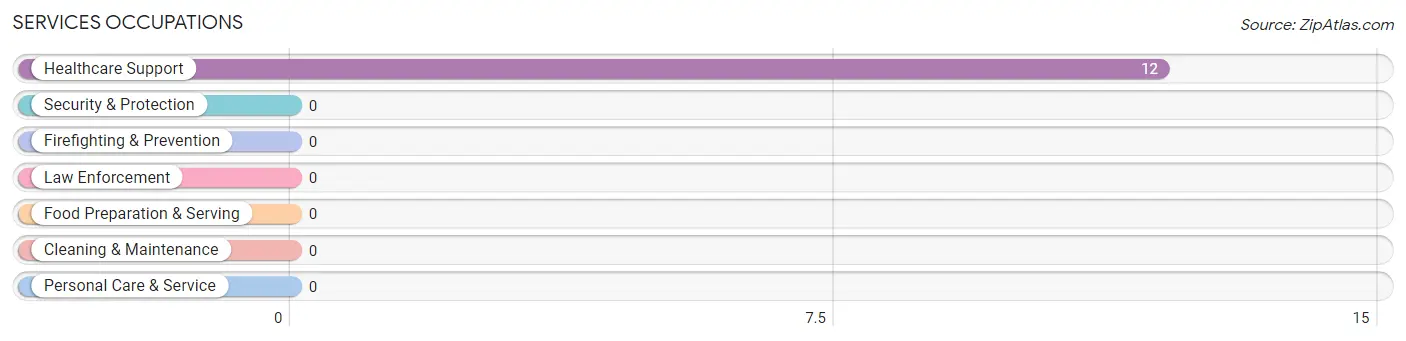
Services Occupations by Sex
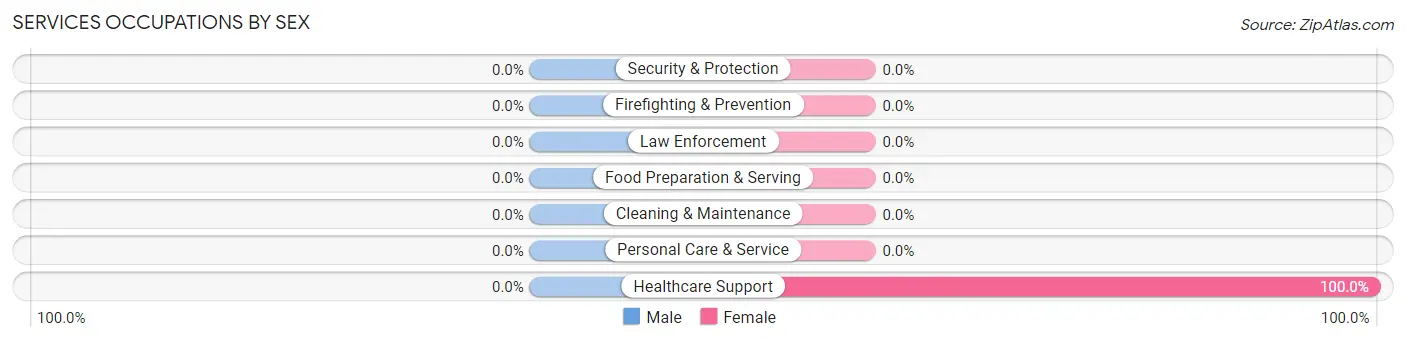
| Occupation | Male | Female |
| Healthcare Support | 0 (0.0%) | 12 (100.0%) |
| Security & Protection | 0 (0.0%) | 0 (0.0%) |
| Firefighting & Prevention | 0 (0.0%) | 0 (0.0%) |
| Law Enforcement | 0 (0.0%) | 0 (0.0%) |
| Food Preparation & Serving | 0 (0.0%) | 0 (0.0%) |
| Cleaning & Maintenance | 0 (0.0%) | 0 (0.0%) |
| Personal Care & Service | 0 (0.0%) | 0 (0.0%) |
| Total (Category) | 0 (0.0%) | 12 (100.0%) |
| Total (Overall) | 191 (38.1%) | 311 (62.0%) |
Sales and Office Occupations
The most common Sales and Office occupations in Lakeville are Office & Administration (95 | 18.9%), and Sales & Related (39 | 7.8%).

Sales and Office Occupations by Sex

| Occupation | Male | Female |
| Sales & Related | 0 (0.0%) | 39 (100.0%) |
| Office & Administration | 43 (45.3%) | 52 (54.7%) |
| Total (Category) | 43 (32.1%) | 91 (67.9%) |
| Total (Overall) | 191 (38.1%) | 311 (62.0%) |
Natural Resources, Construction and Maintenance Occupations
The most common Natural Resources, Construction and Maintenance occupations in Lakeville are , and Construction & Extraction (26 | 5.2%).

Natural Resources, Construction and Maintenance Occupations by Sex

| Occupation | Male | Female |
| Farming, Fishing & Forestry | 0 (0.0%) | 0 (0.0%) |
| Construction & Extraction | 26 (100.0%) | 0 (0.0%) |
| Installation, Maintenance & Repair | 0 (0.0%) | 0 (0.0%) |
| Total (Category) | 26 (100.0%) | 0 (0.0%) |
| Total (Overall) | 191 (38.1%) | 311 (62.0%) |
Production, Transportation and Moving Occupations
The most common Production, Transportation and Moving occupations in Lakeville are Production (43 | 8.6%), and Transportation (16 | 3.2%).
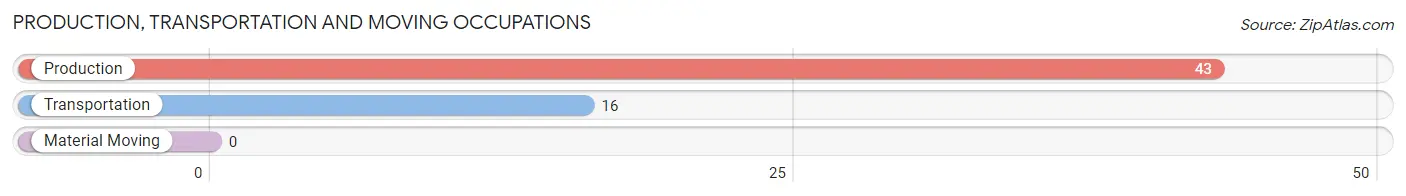
Production, Transportation and Moving Occupations by Sex
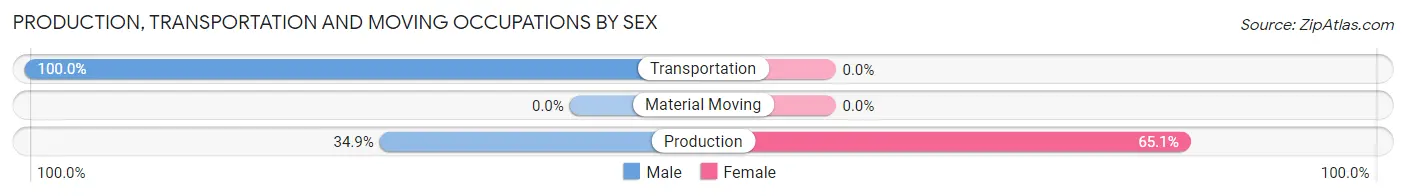
| Occupation | Male | Female |
| Production | 15 (34.9%) | 28 (65.1%) |
| Transportation | 16 (100.0%) | 0 (0.0%) |
| Material Moving | 0 (0.0%) | 0 (0.0%) |
| Total (Category) | 31 (52.5%) | 28 (47.5%) |
| Total (Overall) | 191 (38.1%) | 311 (62.0%) |
Employment Industries by Sex in Lakeville
Employment Industries in Lakeville
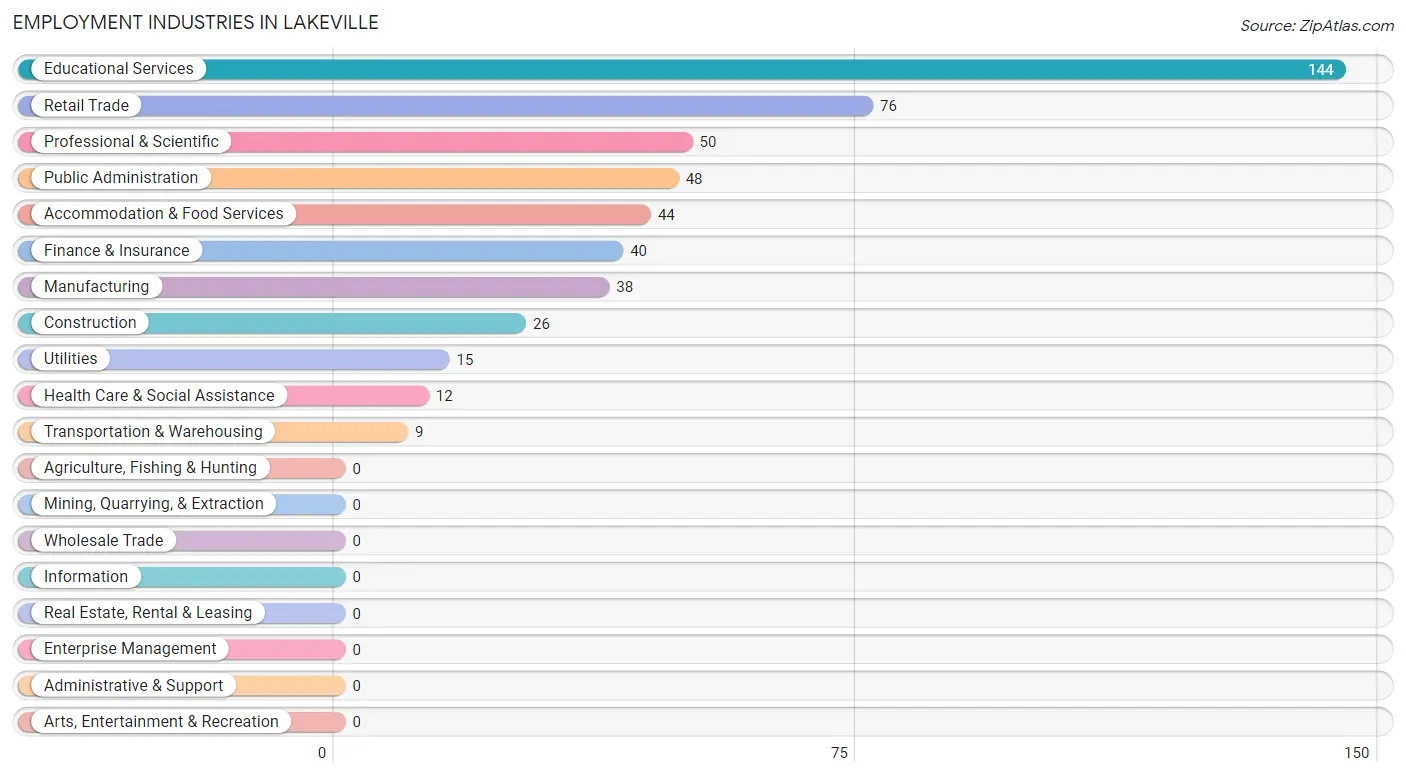
The major employment industries in Lakeville include Educational Services (144 | 28.7%), Retail Trade (76 | 15.1%), Professional & Scientific (50 | 10.0%), Public Administration (48 | 9.6%), and Accommodation & Food Services (44 | 8.8%).
Employment Industries by Sex in Lakeville
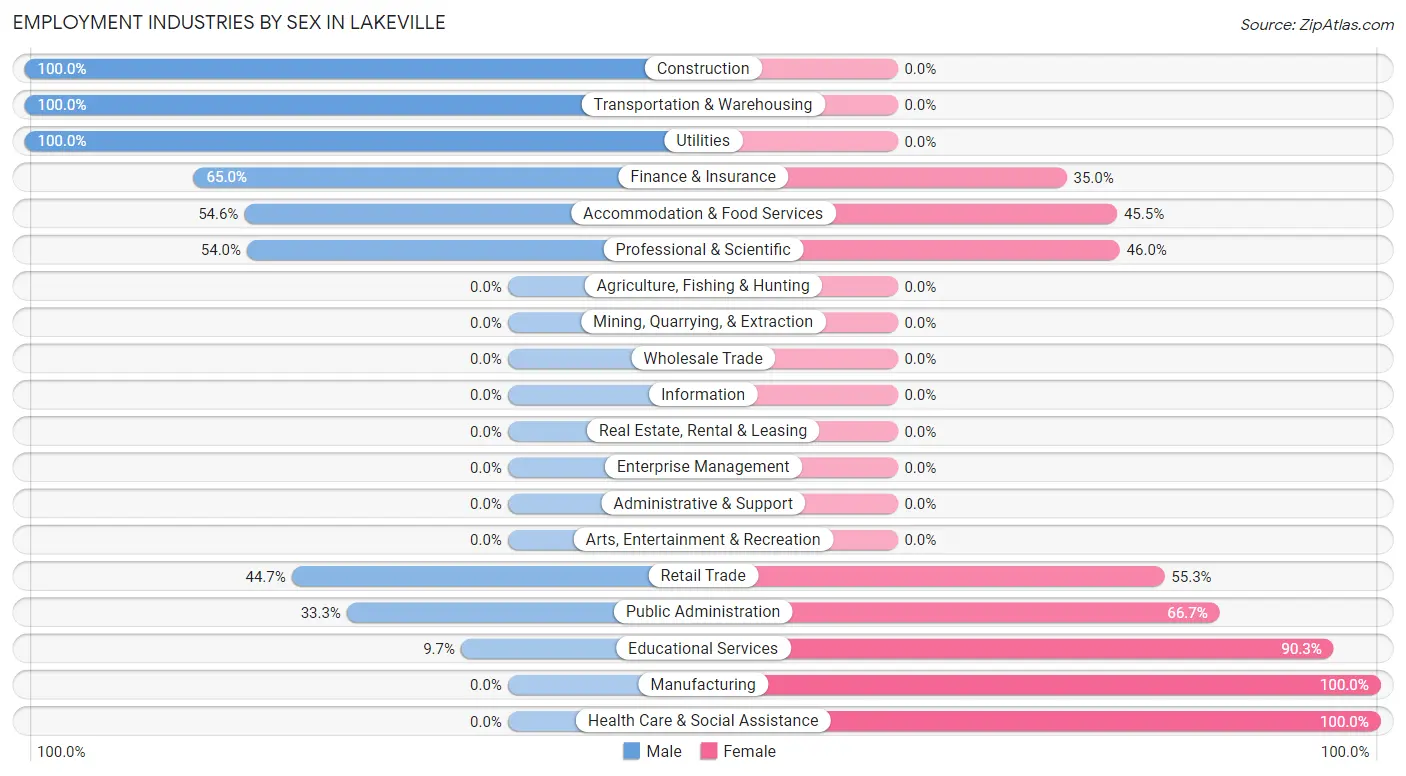
The Lakeville industries that see more men than women are Construction (100.0%), Transportation & Warehousing (100.0%), and Utilities (100.0%), whereas the industries that tend to have a higher number of women are Manufacturing (100.0%), Health Care & Social Assistance (100.0%), and Educational Services (90.3%).
| Industry | Male | Female |
| Agriculture, Fishing & Hunting | 0 (0.0%) | 0 (0.0%) |
| Mining, Quarrying, & Extraction | 0 (0.0%) | 0 (0.0%) |
| Construction | 26 (100.0%) | 0 (0.0%) |
| Manufacturing | 0 (0.0%) | 38 (100.0%) |
| Wholesale Trade | 0 (0.0%) | 0 (0.0%) |
| Retail Trade | 34 (44.7%) | 42 (55.3%) |
| Transportation & Warehousing | 9 (100.0%) | 0 (0.0%) |
| Utilities | 15 (100.0%) | 0 (0.0%) |
| Information | 0 (0.0%) | 0 (0.0%) |
| Finance & Insurance | 26 (65.0%) | 14 (35.0%) |
| Real Estate, Rental & Leasing | 0 (0.0%) | 0 (0.0%) |
| Professional & Scientific | 27 (54.0%) | 23 (46.0%) |
| Enterprise Management | 0 (0.0%) | 0 (0.0%) |
| Administrative & Support | 0 (0.0%) | 0 (0.0%) |
| Educational Services | 14 (9.7%) | 130 (90.3%) |
| Health Care & Social Assistance | 0 (0.0%) | 12 (100.0%) |
| Arts, Entertainment & Recreation | 0 (0.0%) | 0 (0.0%) |
| Accommodation & Food Services | 24 (54.5%) | 20 (45.5%) |
| Public Administration | 16 (33.3%) | 32 (66.7%) |
| Total | 191 (38.1%) | 311 (62.0%) |
Education in Lakeville
School Enrollment in Lakeville
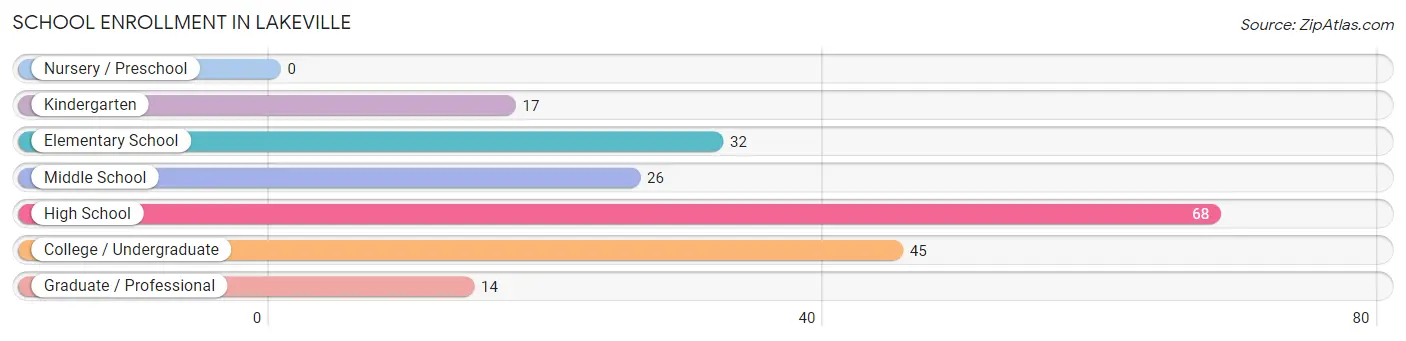
The most common levels of schooling among the 202 students in Lakeville are high school (68 | 33.7%), college / undergraduate (45 | 22.3%), and elementary school (32 | 15.8%).
| School Level | # Students | % Students |
| Nursery / Preschool | 0 | 0.0% |
| Kindergarten | 17 | 8.4% |
| Elementary School | 32 | 15.8% |
| Middle School | 26 | 12.9% |
| High School | 68 | 33.7% |
| College / Undergraduate | 45 | 22.3% |
| Graduate / Professional | 14 | 6.9% |
| Total | 202 | 100.0% |
School Enrollment by Age by Funding Source in Lakeville
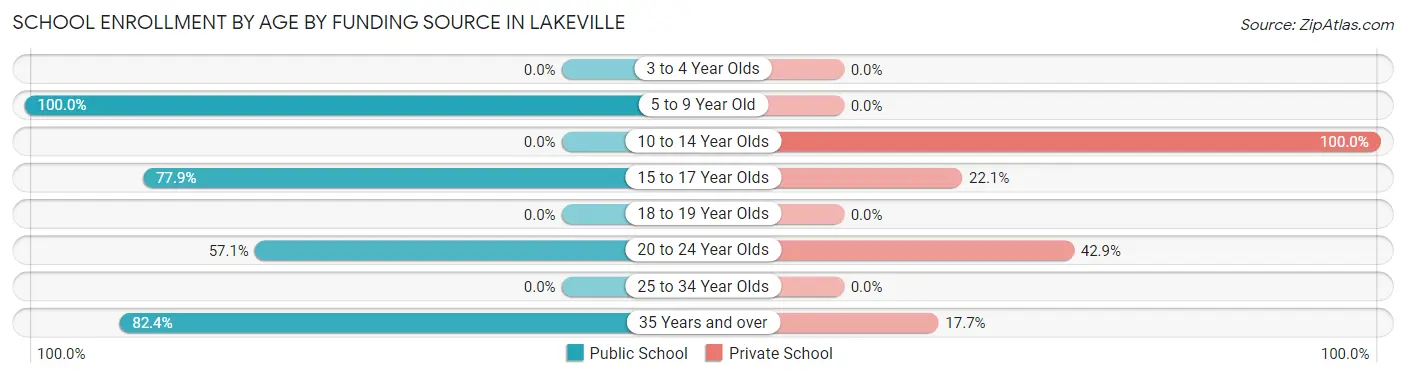
Out of a total of 202 students who are enrolled in schools in Lakeville, 62 (30.7%) attend a private institution, while the remaining 140 (69.3%) are enrolled in public schools. The age group of 10 to 14 year olds has the highest likelihood of being enrolled in private schools, with 26 (100.0% in the age bracket) enrolled. Conversely, the age group of 5 to 9 year old has the lowest likelihood of being enrolled in a private school, with 49 (100.0% in the age bracket) attending a public institution.
| Age Bracket | Public School | Private School |
| 3 to 4 Year Olds | 0 (0.0%) | 0 (0.0%) |
| 5 to 9 Year Old | 49 (100.0%) | 0 (0.0%) |
| 10 to 14 Year Olds | 0 (0.0%) | 26 (100.0%) |
| 15 to 17 Year Olds | 53 (77.9%) | 15 (22.1%) |
| 18 to 19 Year Olds | 0 (0.0%) | 0 (0.0%) |
| 20 to 24 Year Olds | 24 (57.1%) | 18 (42.9%) |
| 25 to 34 Year Olds | 0 (0.0%) | 0 (0.0%) |
| 35 Years and over | 14 (82.4%) | 3 (17.6%) |
| Total | 140 (69.3%) | 62 (30.7%) |
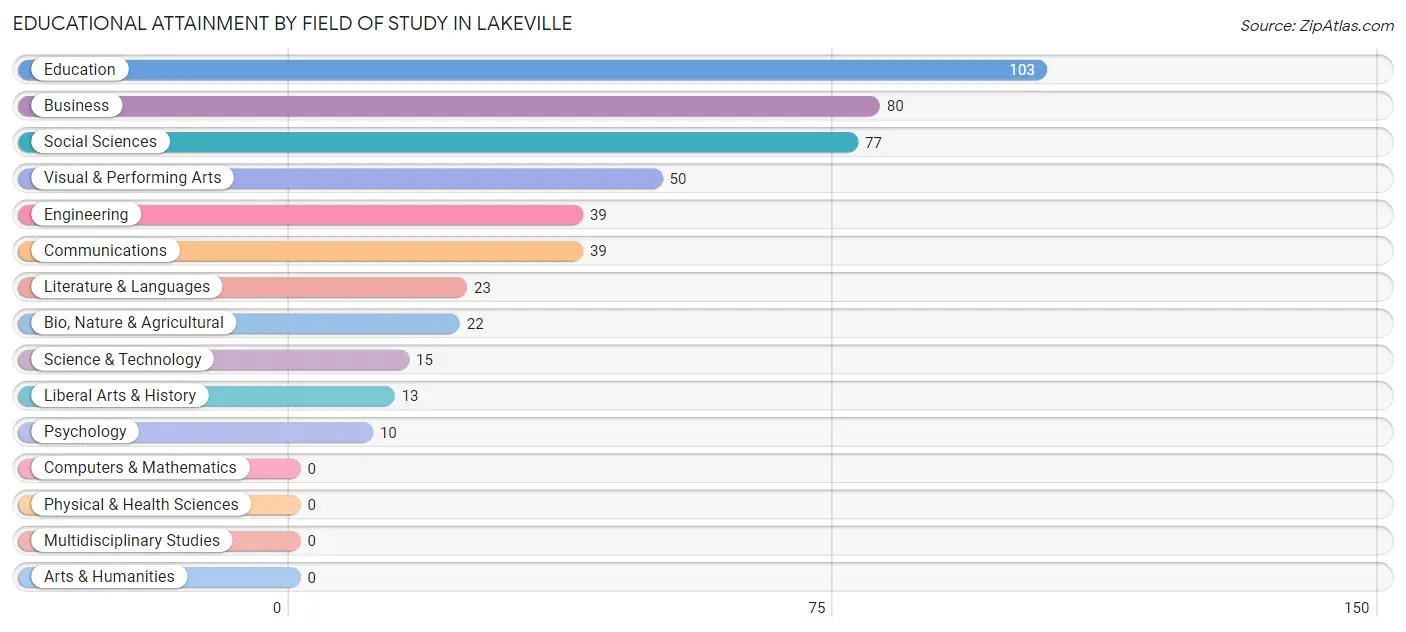
Educational Attainment by Field of Study in Lakeville
Education (103 | 21.9%), business (80 | 17.0%), social sciences (77 | 16.4%), visual & performing arts (50 | 10.6%), and engineering (39 | 8.3%) are the most common fields of study among 471 individuals in Lakeville who have obtained a bachelor's degree or higher.
| Field of Study | # Graduates | % Graduates |
| Computers & Mathematics | 0 | 0.0% |
| Bio, Nature & Agricultural | 22 | 4.7% |
| Physical & Health Sciences | 0 | 0.0% |
| Psychology | 10 | 2.1% |
| Social Sciences | 77 | 16.4% |
| Engineering | 39 | 8.3% |
| Multidisciplinary Studies | 0 | 0.0% |
| Science & Technology | 15 | 3.2% |
| Business | 80 | 17.0% |
| Education | 103 | 21.9% |
| Literature & Languages | 23 | 4.9% |
| Liberal Arts & History | 13 | 2.8% |
| Visual & Performing Arts | 50 | 10.6% |
| Communications | 39 | 8.3% |
| Arts & Humanities | 0 | 0.0% |
| Total | 471 | 100.0% |
Transportation & Commute in Lakeville
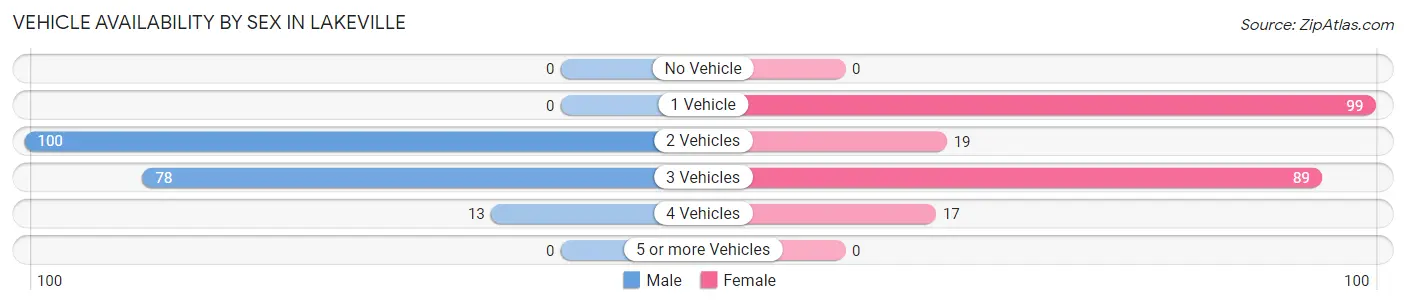
Vehicle Availability by Sex in Lakeville
The most prevalent vehicle ownership categories in Lakeville are males with 2 vehicles (100, accounting for 52.4%) and females with 2 vehicles (19, making up 44.6%).
| Vehicles Available | Male | Female |
| No Vehicle | 0 (0.0%) | 0 (0.0%) |
| 1 Vehicle | 0 (0.0%) | 99 (44.2%) |
| 2 Vehicles | 100 (52.4%) | 19 (8.5%) |
| 3 Vehicles | 78 (40.8%) | 89 (39.7%) |
| 4 Vehicles | 13 (6.8%) | 17 (7.6%) |
| 5 or more Vehicles | 0 (0.0%) | 0 (0.0%) |
| Total | 191 (100.0%) | 224 (100.0%) |
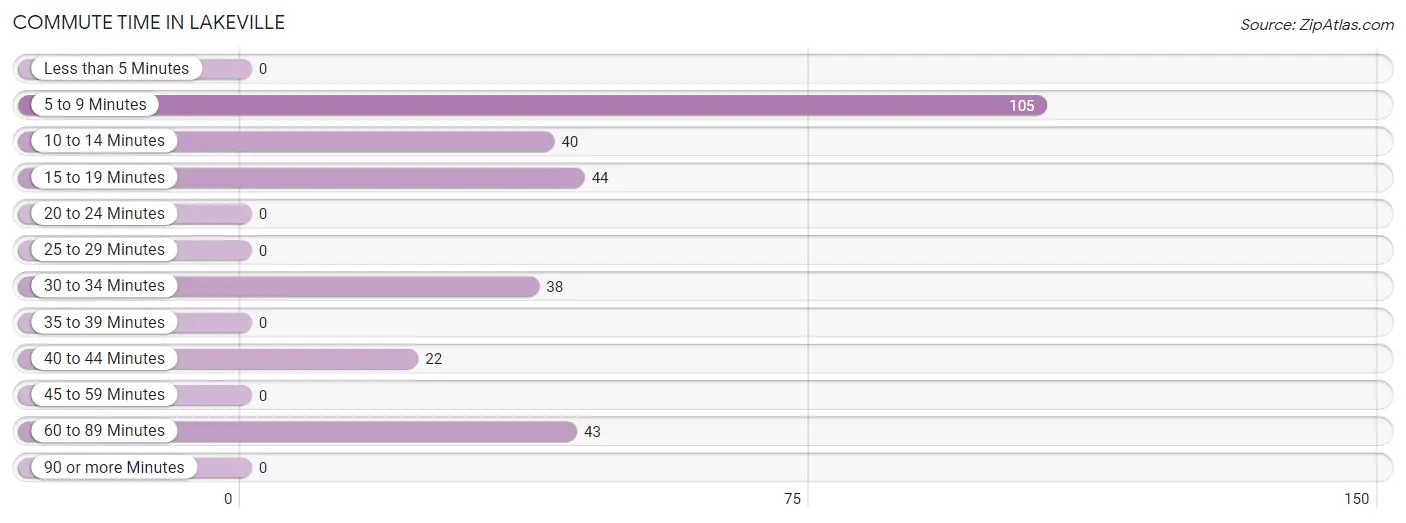
Commute Time in Lakeville
The most frequently occuring commute durations in Lakeville are 5 to 9 minutes (105 commuters, 36.0%), 15 to 19 minutes (44 commuters, 15.1%), and 60 to 89 minutes (43 commuters, 14.7%).
| Commute Time | # Commuters | % Commuters |
| Less than 5 Minutes | 0 | 0.0% |
| 5 to 9 Minutes | 105 | 36.0% |
| 10 to 14 Minutes | 40 | 13.7% |
| 15 to 19 Minutes | 44 | 15.1% |
| 20 to 24 Minutes | 0 | 0.0% |
| 25 to 29 Minutes | 0 | 0.0% |
| 30 to 34 Minutes | 38 | 13.0% |
| 35 to 39 Minutes | 0 | 0.0% |
| 40 to 44 Minutes | 22 | 7.5% |
| 45 to 59 Minutes | 0 | 0.0% |
| 60 to 89 Minutes | 43 | 14.7% |
| 90 or more Minutes | 0 | 0.0% |
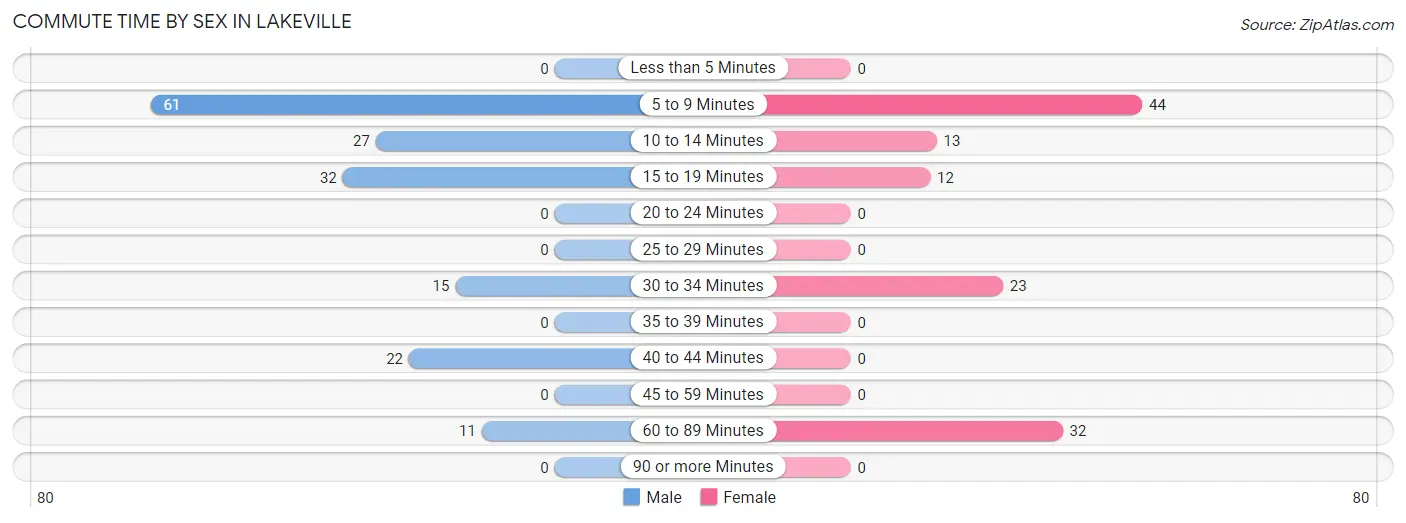
Commute Time by Sex in Lakeville
The most common commute times in Lakeville are 5 to 9 minutes (61 commuters, 36.3%) for males and 5 to 9 minutes (44 commuters, 35.5%) for females.
| Commute Time | Male | Female |
| Less than 5 Minutes | 0 (0.0%) | 0 (0.0%) |
| 5 to 9 Minutes | 61 (36.3%) | 44 (35.5%) |
| 10 to 14 Minutes | 27 (16.1%) | 13 (10.5%) |
| 15 to 19 Minutes | 32 (19.1%) | 12 (9.7%) |
| 20 to 24 Minutes | 0 (0.0%) | 0 (0.0%) |
| 25 to 29 Minutes | 0 (0.0%) | 0 (0.0%) |
| 30 to 34 Minutes | 15 (8.9%) | 23 (18.5%) |
| 35 to 39 Minutes | 0 (0.0%) | 0 (0.0%) |
| 40 to 44 Minutes | 22 (13.1%) | 0 (0.0%) |
| 45 to 59 Minutes | 0 (0.0%) | 0 (0.0%) |
| 60 to 89 Minutes | 11 (6.6%) | 32 (25.8%) |
| 90 or more Minutes | 0 (0.0%) | 0 (0.0%) |
Time of Departure to Work by Sex in Lakeville
The most frequent times of departure to work in Lakeville are 7:30 AM to 7:59 AM (49, 29.2%) for males and 9:00 AM to 9:59 AM (48, 38.7%) for females.
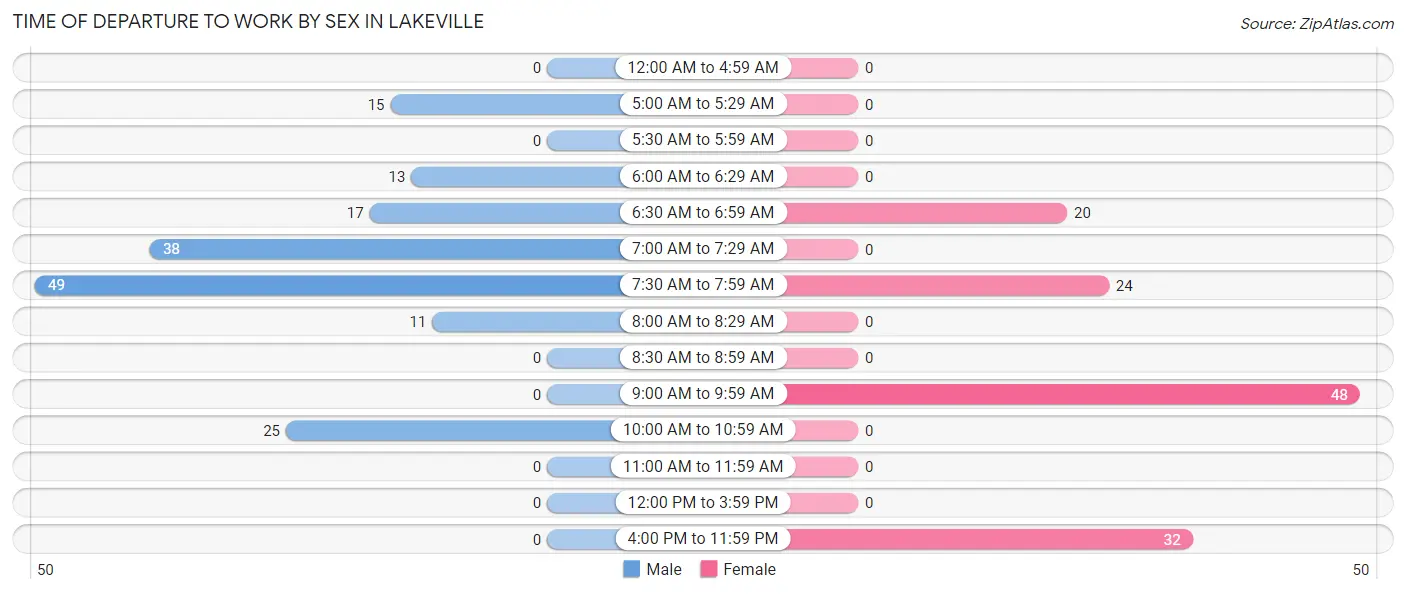
| Time of Departure | Male | Female |
| 12:00 AM to 4:59 AM | 0 (0.0%) | 0 (0.0%) |
| 5:00 AM to 5:29 AM | 15 (8.9%) | 0 (0.0%) |
| 5:30 AM to 5:59 AM | 0 (0.0%) | 0 (0.0%) |
| 6:00 AM to 6:29 AM | 13 (7.7%) | 0 (0.0%) |
| 6:30 AM to 6:59 AM | 17 (10.1%) | 20 (16.1%) |
| 7:00 AM to 7:29 AM | 38 (22.6%) | 0 (0.0%) |
| 7:30 AM to 7:59 AM | 49 (29.2%) | 24 (19.4%) |
| 8:00 AM to 8:29 AM | 11 (6.6%) | 0 (0.0%) |
| 8:30 AM to 8:59 AM | 0 (0.0%) | 0 (0.0%) |
| 9:00 AM to 9:59 AM | 0 (0.0%) | 48 (38.7%) |
| 10:00 AM to 10:59 AM | 25 (14.9%) | 0 (0.0%) |
| 11:00 AM to 11:59 AM | 0 (0.0%) | 0 (0.0%) |
| 12:00 PM to 3:59 PM | 0 (0.0%) | 0 (0.0%) |
| 4:00 PM to 11:59 PM | 0 (0.0%) | 32 (25.8%) |
| Total | 168 (100.0%) | 124 (100.0%) |
Housing Occupancy in Lakeville
Occupancy by Ownership in Lakeville
Of the total 339 dwellings in Lakeville, owner-occupied units account for 230 (67.8%), while renter-occupied units make up 109 (32.2%).
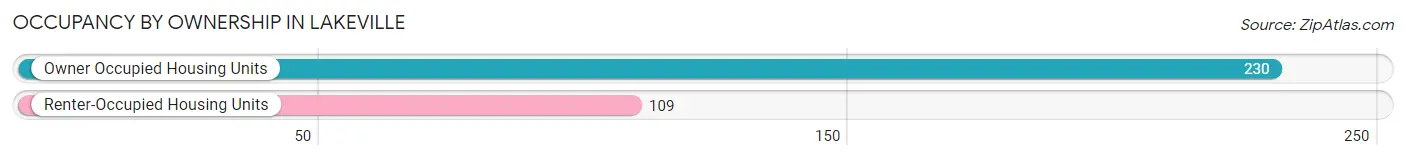
| Occupancy | # Housing Units | % Housing Units |
| Owner Occupied Housing Units | 230 | 67.8% |
| Renter-Occupied Housing Units | 109 | 32.2% |
| Total Occupied Housing Units | 339 | 100.0% |
Occupancy by Household Size in Lakeville
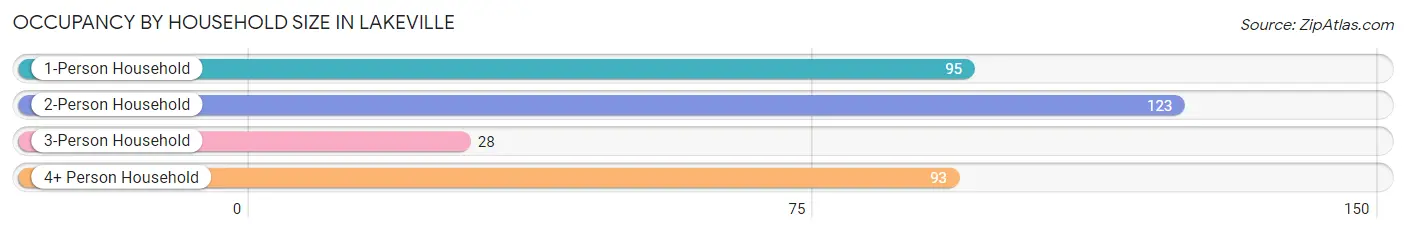
| Household Size | # Housing Units | % Housing Units |
| 1-Person Household | 95 | 28.0% |
| 2-Person Household | 123 | 36.3% |
| 3-Person Household | 28 | 8.3% |
| 4+ Person Household | 93 | 27.4% |
| Total Housing Units | 339 | 100.0% |
Occupancy by Ownership by Household Size in Lakeville
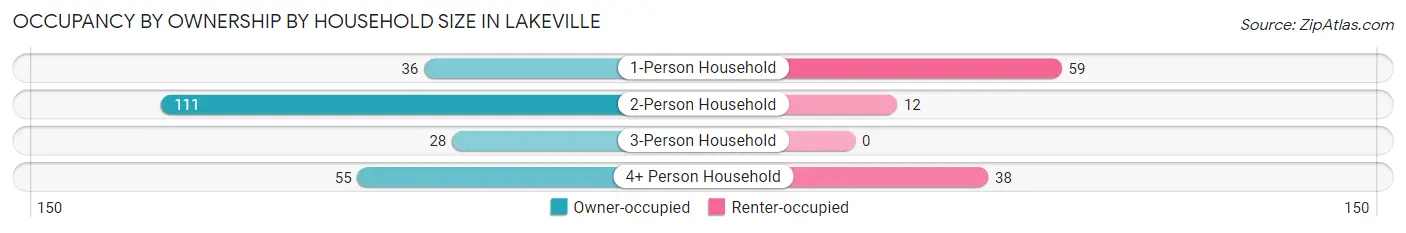
| Household Size | Owner-occupied | Renter-occupied |
| 1-Person Household | 36 (37.9%) | 59 (62.1%) |
| 2-Person Household | 111 (90.2%) | 12 (9.8%) |
| 3-Person Household | 28 (100.0%) | 0 (0.0%) |
| 4+ Person Household | 55 (59.1%) | 38 (40.9%) |
| Total Housing Units | 230 (67.8%) | 109 (32.2%) |
Occupancy by Educational Attainment in Lakeville
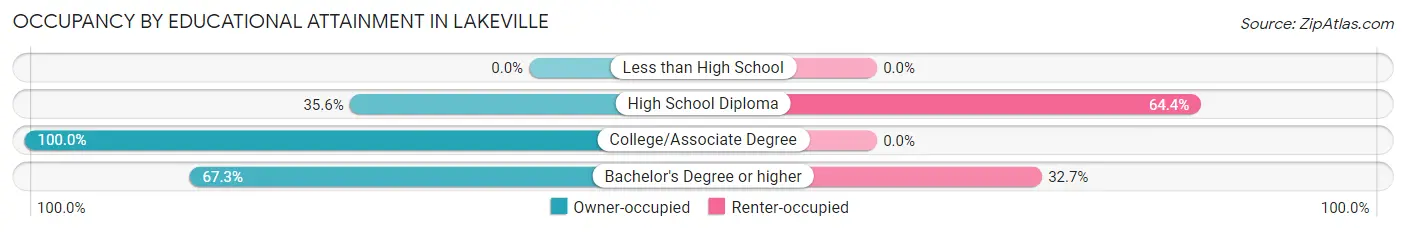
| Household Size | Owner-occupied | Renter-occupied |
| Less than High School | 0 (0.0%) | 0 (0.0%) |
| High School Diploma | 21 (35.6%) | 38 (64.4%) |
| College/Associate Degree | 63 (100.0%) | 0 (0.0%) |
| Bachelor's Degree or higher | 146 (67.3%) | 71 (32.7%) |
Occupancy by Age of Householder in Lakeville
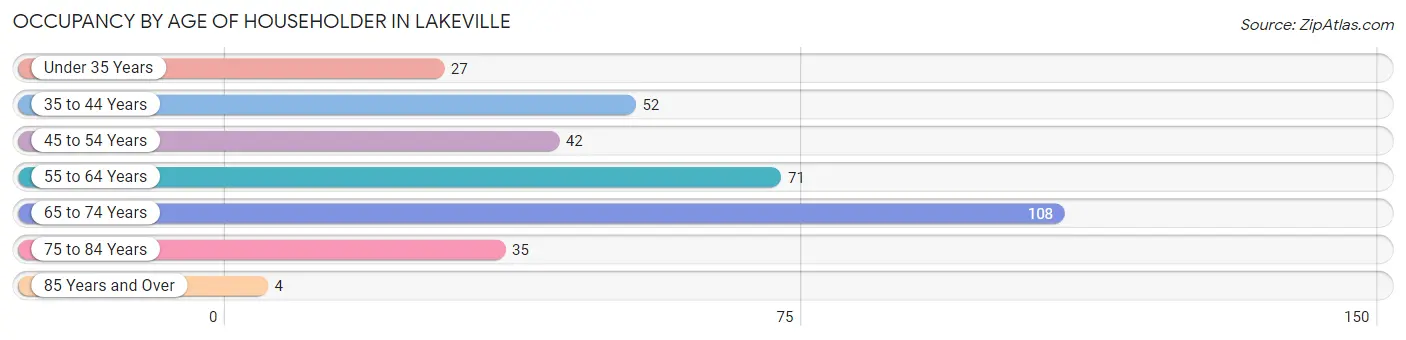
| Age Bracket | # Households | % Households |
| Under 35 Years | 27 | 8.0% |
| 35 to 44 Years | 52 | 15.3% |
| 45 to 54 Years | 42 | 12.4% |
| 55 to 64 Years | 71 | 20.9% |
| 65 to 74 Years | 108 | 31.9% |
| 75 to 84 Years | 35 | 10.3% |
| 85 Years and Over | 4 | 1.2% |
| Total | 339 | 100.0% |
Housing Finances in Lakeville
Median Income by Occupancy in Lakeville
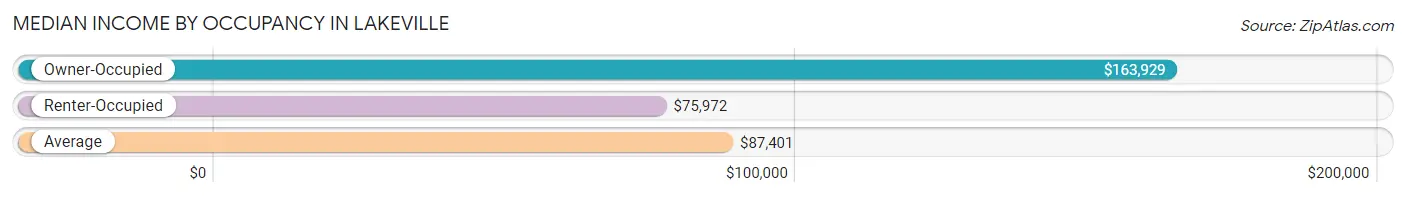
| Occupancy Type | # Households | Median Income |
| Owner-Occupied | 230 (67.8%) | $163,929 |
| Renter-Occupied | 109 (32.2%) | $75,972 |
| Average | 339 (100.0%) | $87,401 |
Occupancy by Householder Income Bracket in Lakeville
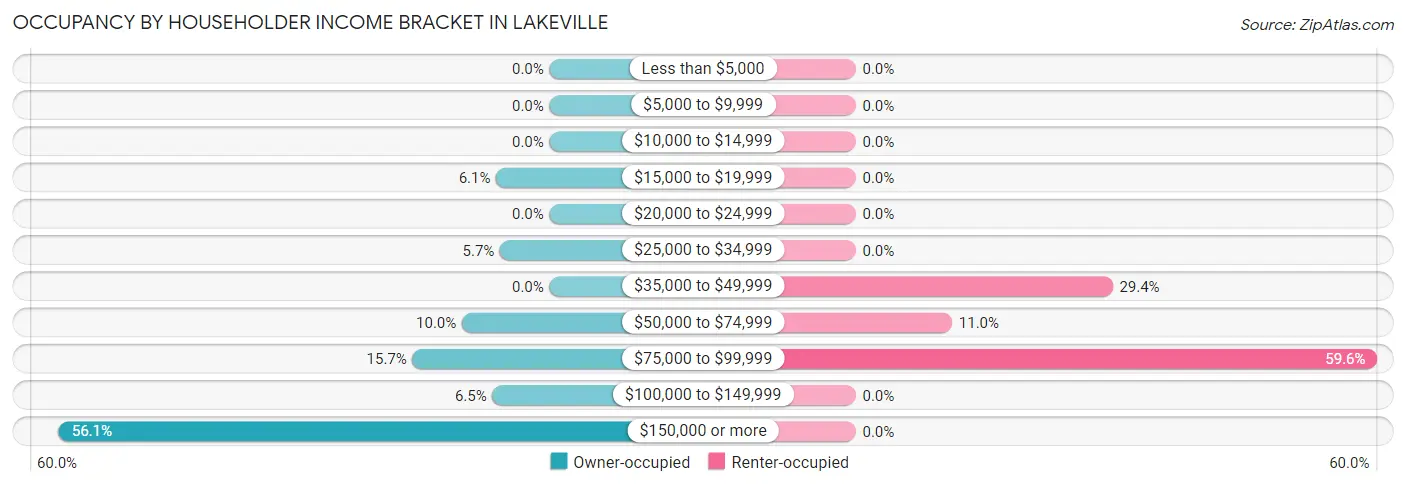
| Income Bracket | Owner-occupied | Renter-occupied |
| Less than $5,000 | 0 (0.0%) | 0 (0.0%) |
| $5,000 to $9,999 | 0 (0.0%) | 0 (0.0%) |
| $10,000 to $14,999 | 0 (0.0%) | 0 (0.0%) |
| $15,000 to $19,999 | 14 (6.1%) | 0 (0.0%) |
| $20,000 to $24,999 | 0 (0.0%) | 0 (0.0%) |
| $25,000 to $34,999 | 13 (5.7%) | 0 (0.0%) |
| $35,000 to $49,999 | 0 (0.0%) | 32 (29.4%) |
| $50,000 to $74,999 | 23 (10.0%) | 12 (11.0%) |
| $75,000 to $99,999 | 36 (15.7%) | 65 (59.6%) |
| $100,000 to $149,999 | 15 (6.5%) | 0 (0.0%) |
| $150,000 or more | 129 (56.1%) | 0 (0.0%) |
| Total | 230 (100.0%) | 109 (100.0%) |
Monthly Housing Cost Tiers in Lakeville
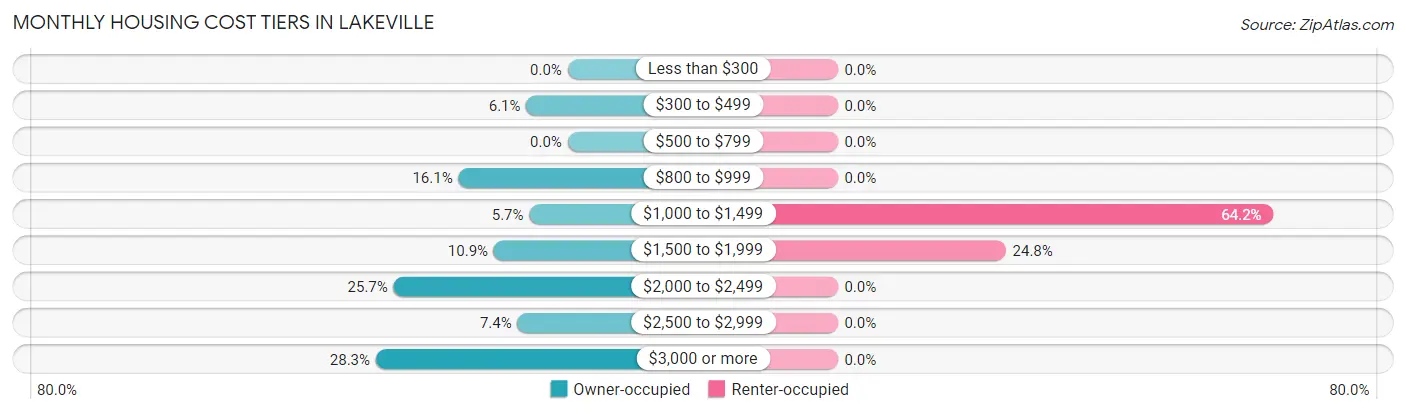
| Monthly Cost | Owner-occupied | Renter-occupied |
| Less than $300 | 0 (0.0%) | 0 (0.0%) |
| $300 to $499 | 14 (6.1%) | 0 (0.0%) |
| $500 to $799 | 0 (0.0%) | 0 (0.0%) |
| $800 to $999 | 37 (16.1%) | 0 (0.0%) |
| $1,000 to $1,499 | 13 (5.7%) | 70 (64.2%) |
| $1,500 to $1,999 | 25 (10.9%) | 27 (24.8%) |
| $2,000 to $2,499 | 59 (25.7%) | 0 (0.0%) |
| $2,500 to $2,999 | 17 (7.4%) | 0 (0.0%) |
| $3,000 or more | 65 (28.3%) | 0 (0.0%) |
| Total | 230 (100.0%) | 109 (100.0%) |
Physical Housing Characteristics in Lakeville
Housing Structures in Lakeville
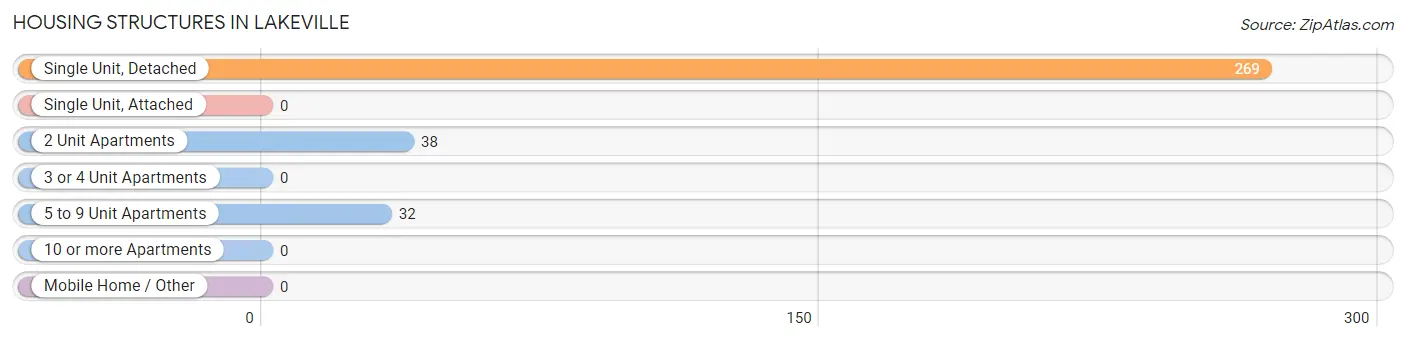
| Structure Type | # Housing Units | % Housing Units |
| Single Unit, Detached | 269 | 79.3% |
| Single Unit, Attached | 0 | 0.0% |
| 2 Unit Apartments | 38 | 11.2% |
| 3 or 4 Unit Apartments | 0 | 0.0% |
| 5 to 9 Unit Apartments | 32 | 9.4% |
| 10 or more Apartments | 0 | 0.0% |
| Mobile Home / Other | 0 | 0.0% |
| Total | 339 | 100.0% |
Housing Structures by Occupancy in Lakeville
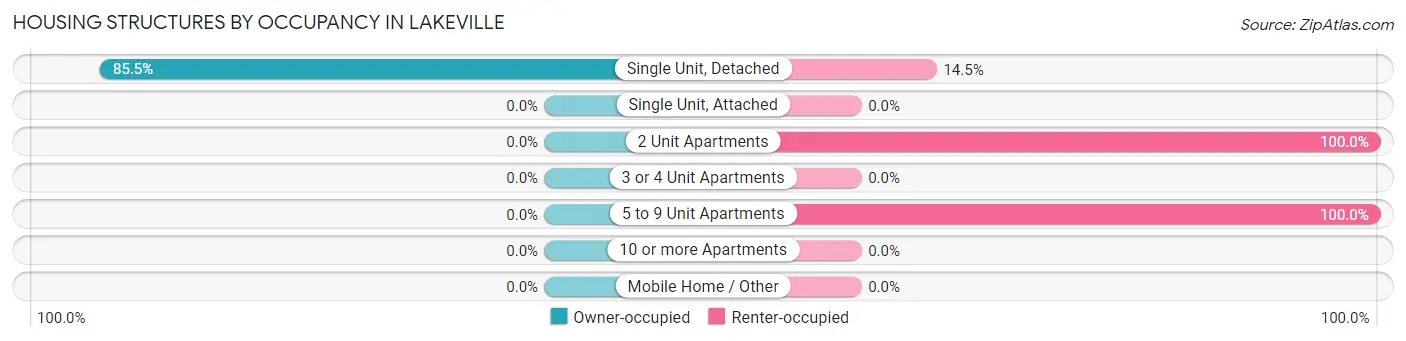
| Structure Type | Owner-occupied | Renter-occupied |
| Single Unit, Detached | 230 (85.5%) | 39 (14.5%) |
| Single Unit, Attached | 0 (0.0%) | 0 (0.0%) |
| 2 Unit Apartments | 0 (0.0%) | 38 (100.0%) |
| 3 or 4 Unit Apartments | 0 (0.0%) | 0 (0.0%) |
| 5 to 9 Unit Apartments | 0 (0.0%) | 32 (100.0%) |
| 10 or more Apartments | 0 (0.0%) | 0 (0.0%) |
| Mobile Home / Other | 0 (0.0%) | 0 (0.0%) |
| Total | 230 (67.8%) | 109 (32.2%) |
Housing Structures by Number of Rooms in Lakeville
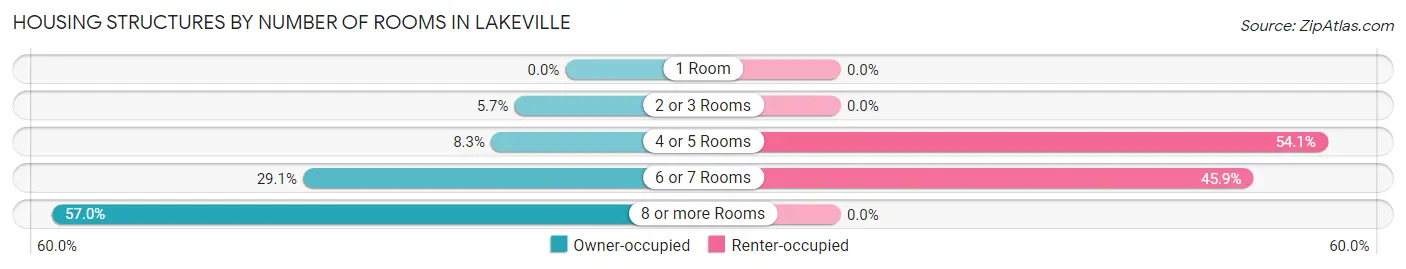
| Number of Rooms | Owner-occupied | Renter-occupied |
| 1 Room | 0 (0.0%) | 0 (0.0%) |
| 2 or 3 Rooms | 13 (5.7%) | 0 (0.0%) |
| 4 or 5 Rooms | 19 (8.3%) | 59 (54.1%) |
| 6 or 7 Rooms | 67 (29.1%) | 50 (45.9%) |
| 8 or more Rooms | 131 (57.0%) | 0 (0.0%) |
| Total | 230 (100.0%) | 109 (100.0%) |
Housing Structure by Heating Type in Lakeville
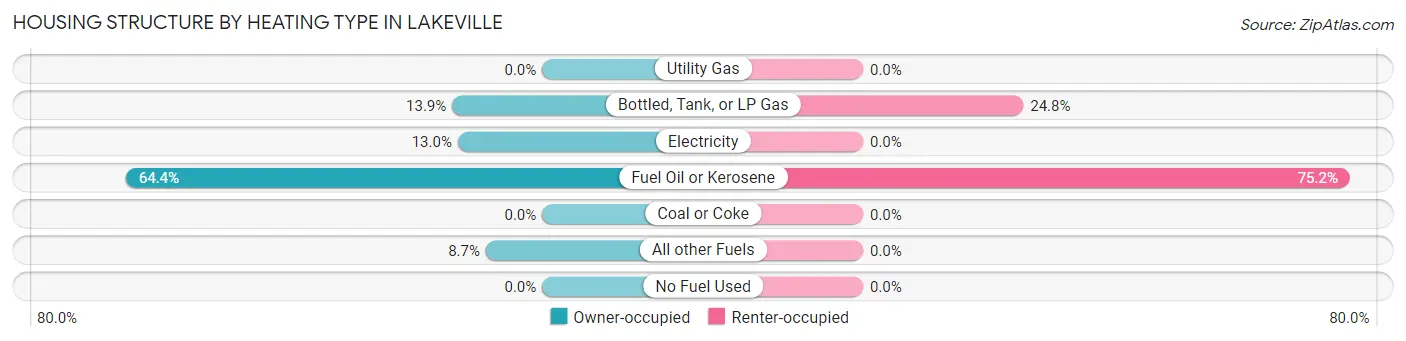
| Heating Type | Owner-occupied | Renter-occupied |
| Utility Gas | 0 (0.0%) | 0 (0.0%) |
| Bottled, Tank, or LP Gas | 32 (13.9%) | 27 (24.8%) |
| Electricity | 30 (13.0%) | 0 (0.0%) |
| Fuel Oil or Kerosene | 148 (64.3%) | 82 (75.2%) |
| Coal or Coke | 0 (0.0%) | 0 (0.0%) |
| All other Fuels | 20 (8.7%) | 0 (0.0%) |
| No Fuel Used | 0 (0.0%) | 0 (0.0%) |
| Total | 230 (100.0%) | 109 (100.0%) |
Household Vehicle Usage in Lakeville
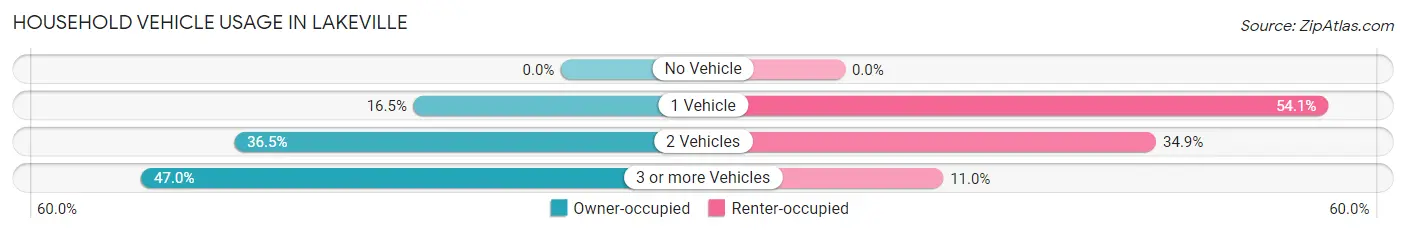
| Vehicles per Household | Owner-occupied | Renter-occupied |
| No Vehicle | 0 (0.0%) | 0 (0.0%) |
| 1 Vehicle | 38 (16.5%) | 59 (54.1%) |
| 2 Vehicles | 84 (36.5%) | 38 (34.9%) |
| 3 or more Vehicles | 108 (47.0%) | 12 (11.0%) |
| Total | 230 (100.0%) | 109 (100.0%) |
Real Estate & Mortgages in Lakeville
Real Estate and Mortgage Overview in Lakeville
| Characteristic | Without Mortgage | With Mortgage |
| Housing Units | 65 | 165 |
| Median Property Value | - | - |
| Median Household Income | - | - |
| Monthly Housing Costs | $850 | $61 |
| Real Estate Taxes | $3,804 | $0 |
Property Value by Mortgage Status in Lakeville
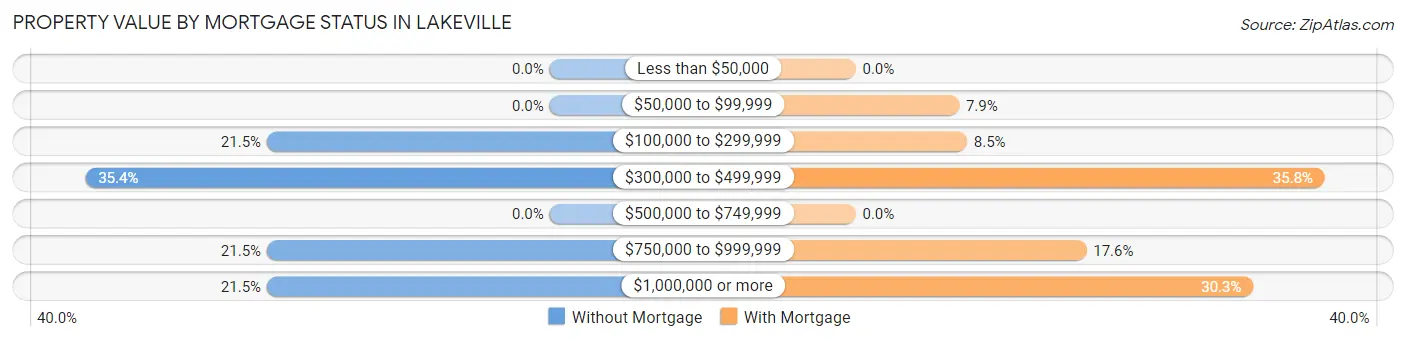
| Property Value | Without Mortgage | With Mortgage |
| Less than $50,000 | 0 (0.0%) | 0 (0.0%) |
| $50,000 to $99,999 | 0 (0.0%) | 13 (7.9%) |
| $100,000 to $299,999 | 14 (21.5%) | 14 (8.5%) |
| $300,000 to $499,999 | 23 (35.4%) | 59 (35.8%) |
| $500,000 to $749,999 | 0 (0.0%) | 0 (0.0%) |
| $750,000 to $999,999 | 14 (21.5%) | 29 (17.6%) |
| $1,000,000 or more | 14 (21.5%) | 50 (30.3%) |
| Total | 65 (100.0%) | 165 (100.0%) |
Household Income by Mortgage Status in Lakeville
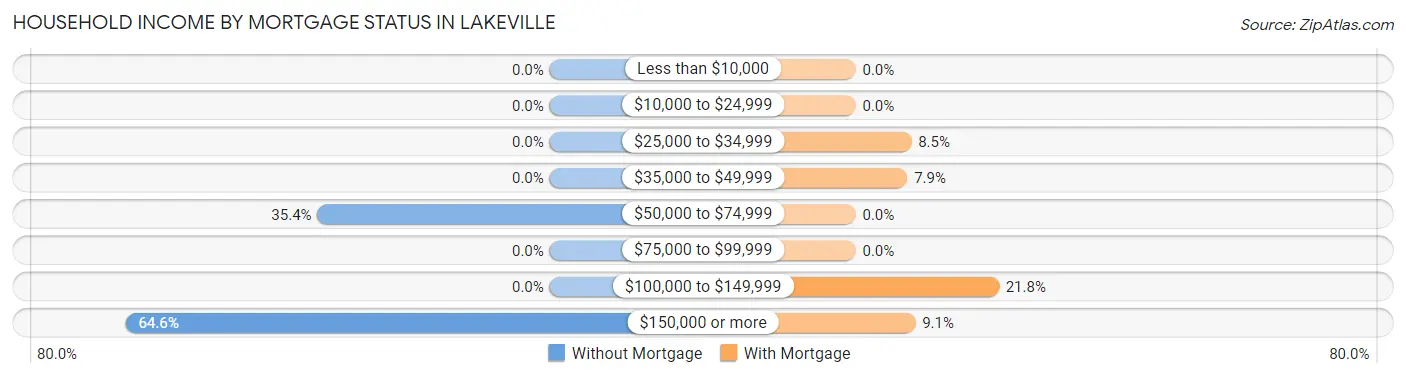
| Household Income | Without Mortgage | With Mortgage |
| Less than $10,000 | 0 (0.0%) | 0 (0.0%) |
| $10,000 to $24,999 | 0 (0.0%) | 0 (0.0%) |
| $25,000 to $34,999 | 0 (0.0%) | 14 (8.5%) |
| $35,000 to $49,999 | 0 (0.0%) | 13 (7.9%) |
| $50,000 to $74,999 | 23 (35.4%) | 0 (0.0%) |
| $75,000 to $99,999 | 0 (0.0%) | 0 (0.0%) |
| $100,000 to $149,999 | 0 (0.0%) | 36 (21.8%) |
| $150,000 or more | 42 (64.6%) | 15 (9.1%) |
| Total | 65 (100.0%) | 165 (100.0%) |
Property Value to Household Income Ratio in Lakeville
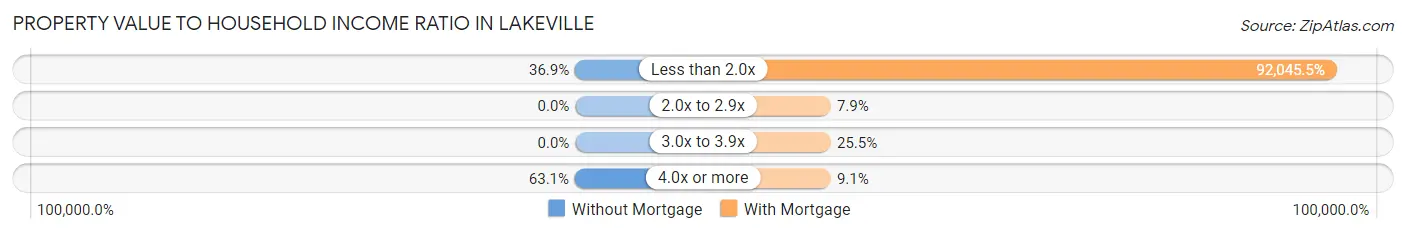
| Value-to-Income Ratio | Without Mortgage | With Mortgage |
| Less than 2.0x | 24 (36.9%) | 151,875 (92,045.5%) |
| 2.0x to 2.9x | 0 (0.0%) | 13 (7.9%) |
| 3.0x to 3.9x | 0 (0.0%) | 42 (25.5%) |
| 4.0x or more | 41 (63.1%) | 15 (9.1%) |
| Total | 65 (100.0%) | 165 (100.0%) |
Real Estate Taxes by Mortgage Status in Lakeville

| Property Taxes | Without Mortgage | With Mortgage |
| Less than $800 | 0 (0.0%) | 0 (0.0%) |
| $800 to $1,499 | 0 (0.0%) | 0 (0.0%) |
| $800 to $1,499 | 65 (100.0%) | 15 (9.1%) |
| Total | 65 (100.0%) | 165 (100.0%) |
Health & Disability in Lakeville
Health Insurance Coverage by Age in Lakeville
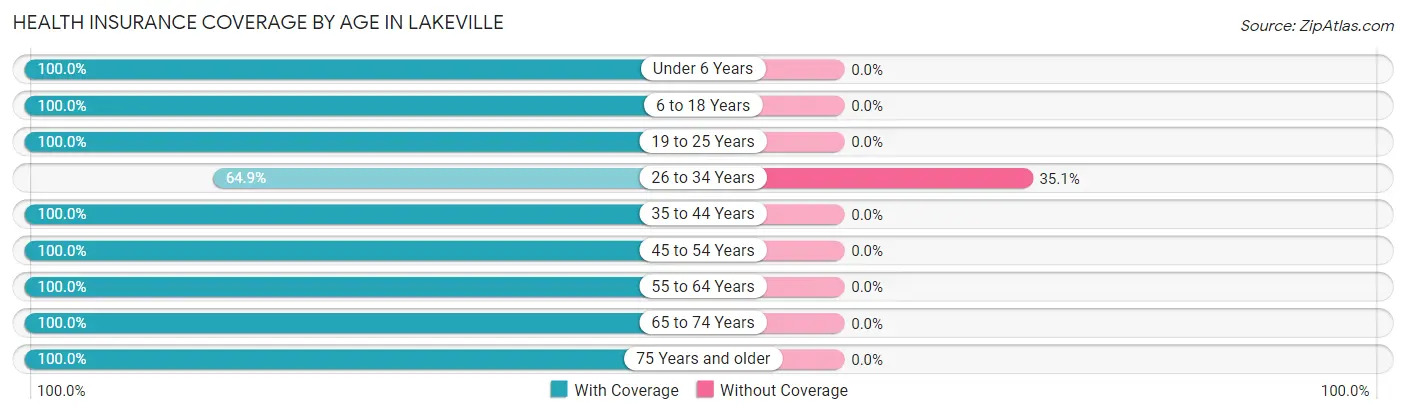
| Age Bracket | With Coverage | Without Coverage |
| Under 6 Years | 69 (100.0%) | 0 (0.0%) |
| 6 to 18 Years | 126 (100.0%) | 0 (0.0%) |
| 19 to 25 Years | 42 (100.0%) | 0 (0.0%) |
| 26 to 34 Years | 37 (64.9%) | 20 (35.1%) |
| 35 to 44 Years | 114 (100.0%) | 0 (0.0%) |
| 45 to 54 Years | 114 (100.0%) | 0 (0.0%) |
| 55 to 64 Years | 172 (100.0%) | 0 (0.0%) |
| 65 to 74 Years | 122 (100.0%) | 0 (0.0%) |
| 75 Years and older | 70 (100.0%) | 0 (0.0%) |
| Total | 866 (97.7%) | 20 (2.3%) |
Health Insurance Coverage by Citizenship Status in Lakeville

| Citizenship Status | With Coverage | Without Coverage |
| Native Born | 69 (100.0%) | 0 (0.0%) |
| Foreign Born, Citizen | 126 (100.0%) | 0 (0.0%) |
| Foreign Born, not a Citizen | 42 (100.0%) | 0 (0.0%) |
Health Insurance Coverage by Household Income in Lakeville
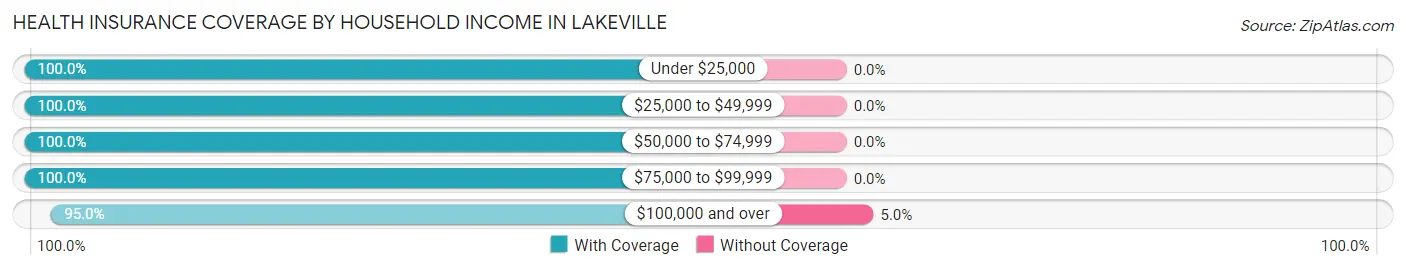
| Household Income | With Coverage | Without Coverage |
| Under $25,000 | 53 (100.0%) | 0 (0.0%) |
| $25,000 to $49,999 | 78 (100.0%) | 0 (0.0%) |
| $50,000 to $74,999 | 46 (100.0%) | 0 (0.0%) |
| $75,000 to $99,999 | 241 (100.0%) | 0 (0.0%) |
| $100,000 and over | 379 (95.0%) | 20 (5.0%) |
Public vs Private Health Insurance Coverage by Age in Lakeville
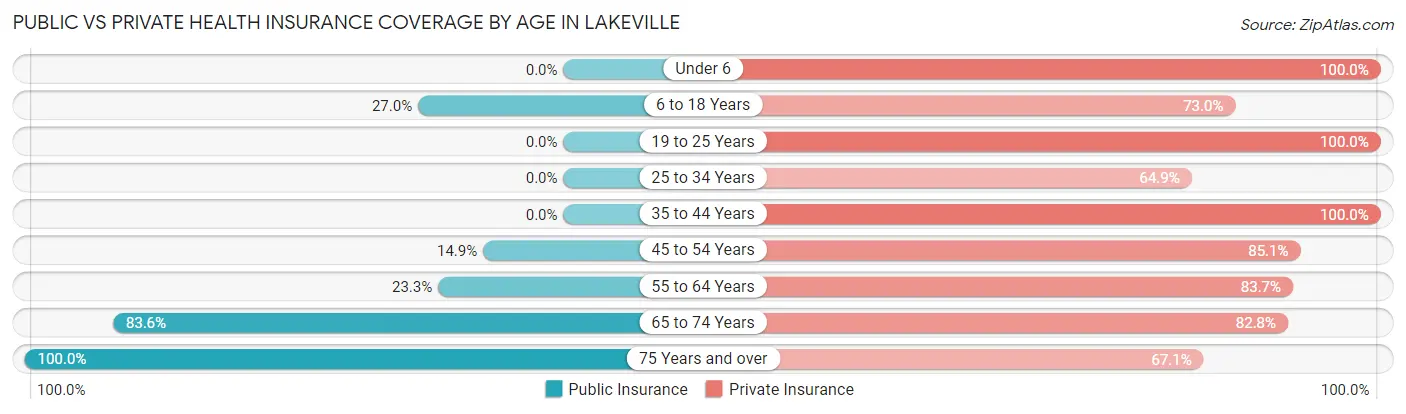
| Age Bracket | Public Insurance | Private Insurance |
| Under 6 | 0 (0.0%) | 69 (100.0%) |
| 6 to 18 Years | 34 (27.0%) | 92 (73.0%) |
| 19 to 25 Years | 0 (0.0%) | 42 (100.0%) |
| 25 to 34 Years | 0 (0.0%) | 37 (64.9%) |
| 35 to 44 Years | 0 (0.0%) | 114 (100.0%) |
| 45 to 54 Years | 17 (14.9%) | 97 (85.1%) |
| 55 to 64 Years | 40 (23.3%) | 144 (83.7%) |
| 65 to 74 Years | 102 (83.6%) | 101 (82.8%) |
| 75 Years and over | 70 (100.0%) | 47 (67.1%) |
| Total | 263 (29.7%) | 743 (83.9%) |
Disability Status by Sex by Age in Lakeville
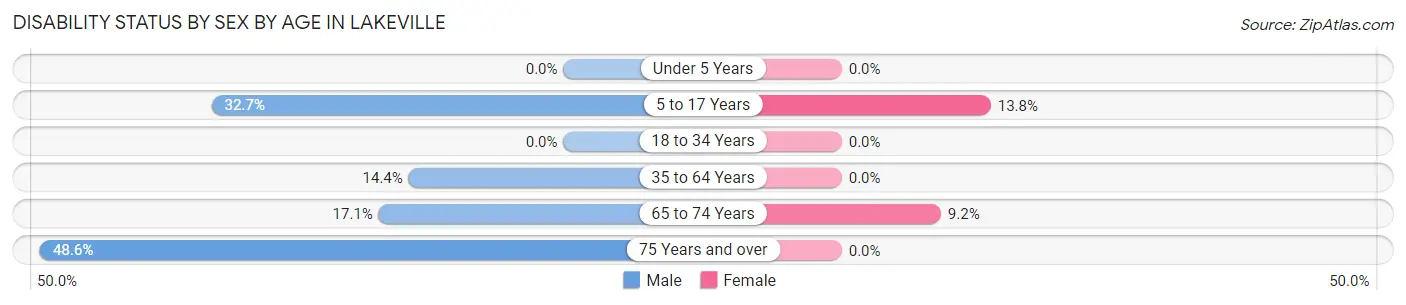
| Age Bracket | Male | Female |
| Under 5 Years | 0 (0.0%) | 0 (0.0%) |
| 5 to 17 Years | 16 (32.7%) | 13 (13.8%) |
| 18 to 34 Years | 0 (0.0%) | 0 (0.0%) |
| 35 to 64 Years | 28 (14.4%) | 0 (0.0%) |
| 65 to 74 Years | 6 (17.1%) | 8 (9.2%) |
| 75 Years and over | 17 (48.6%) | 0 (0.0%) |
Disability Class by Sex by Age in Lakeville
Disability Class: Hearing Difficulty
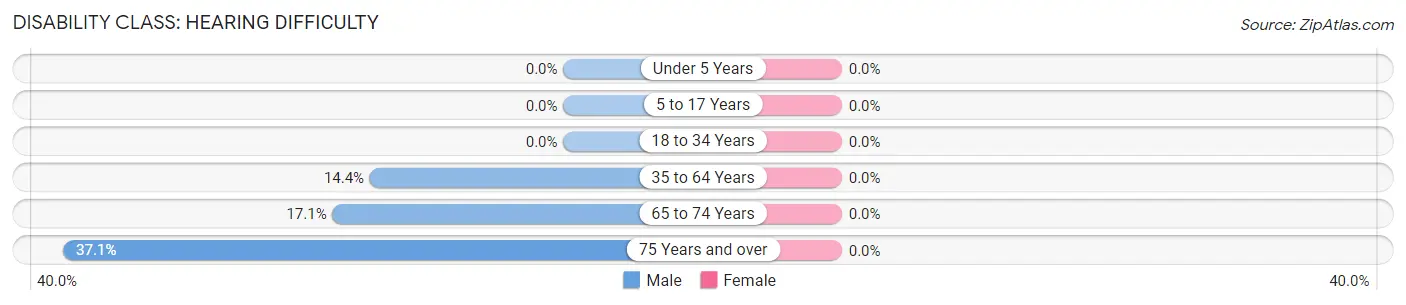
| Age Bracket | Male | Female |
| Under 5 Years | 0 (0.0%) | 0 (0.0%) |
| 5 to 17 Years | 0 (0.0%) | 0 (0.0%) |
| 18 to 34 Years | 0 (0.0%) | 0 (0.0%) |
| 35 to 64 Years | 28 (14.4%) | 0 (0.0%) |
| 65 to 74 Years | 6 (17.1%) | 0 (0.0%) |
| 75 Years and over | 13 (37.1%) | 0 (0.0%) |
Disability Class: Vision Difficulty
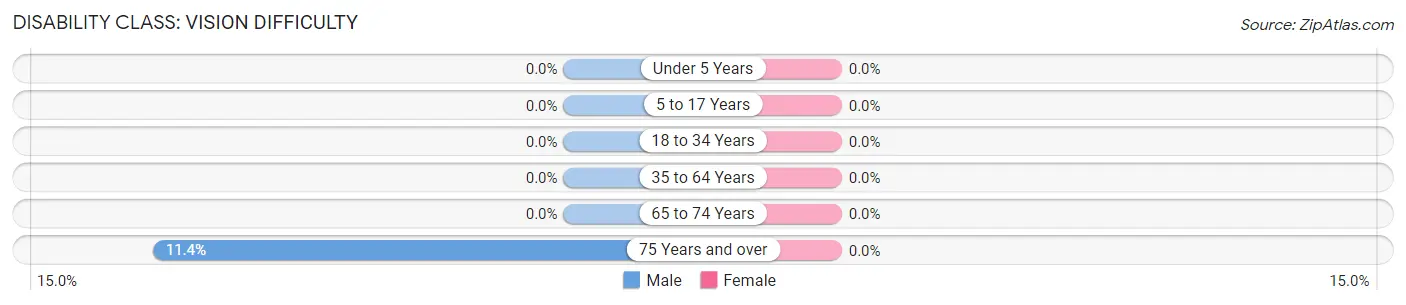
| Age Bracket | Male | Female |
| Under 5 Years | 0 (0.0%) | 0 (0.0%) |
| 5 to 17 Years | 0 (0.0%) | 0 (0.0%) |
| 18 to 34 Years | 0 (0.0%) | 0 (0.0%) |
| 35 to 64 Years | 0 (0.0%) | 0 (0.0%) |
| 65 to 74 Years | 0 (0.0%) | 0 (0.0%) |
| 75 Years and over | 4 (11.4%) | 0 (0.0%) |
Disability Class: Cognitive Difficulty
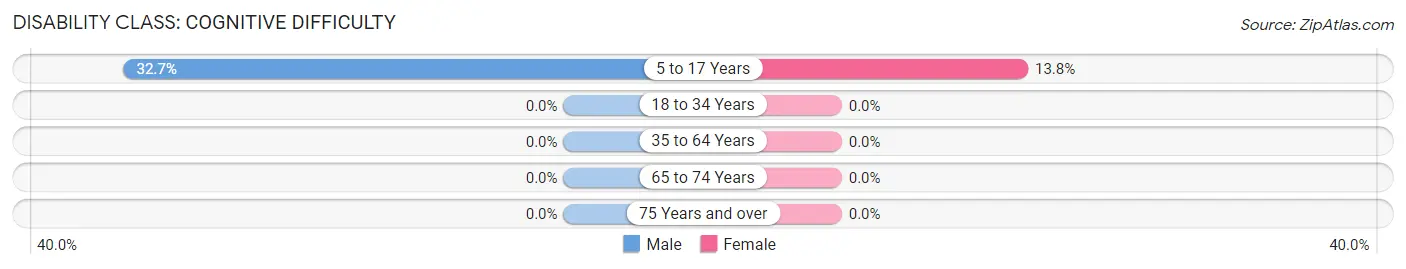
| Age Bracket | Male | Female |
| 5 to 17 Years | 16 (32.7%) | 13 (13.8%) |
| 18 to 34 Years | 0 (0.0%) | 0 (0.0%) |
| 35 to 64 Years | 0 (0.0%) | 0 (0.0%) |
| 65 to 74 Years | 0 (0.0%) | 0 (0.0%) |
| 75 Years and over | 0 (0.0%) | 0 (0.0%) |
Disability Class: Ambulatory Difficulty
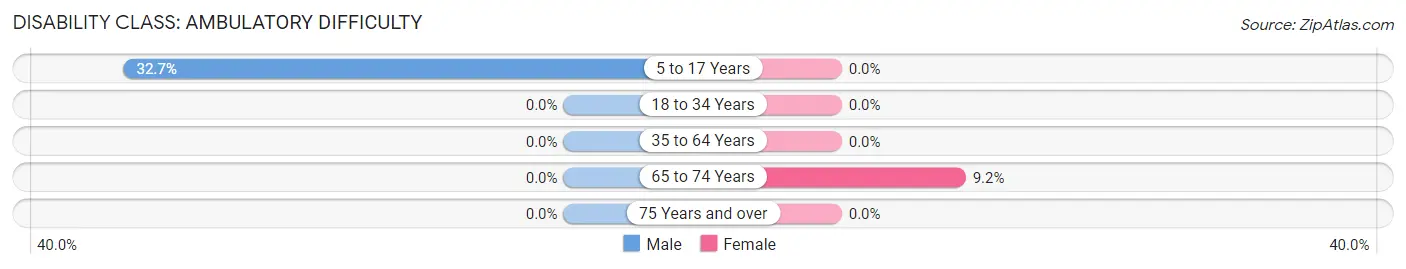
| Age Bracket | Male | Female |
| 5 to 17 Years | 16 (32.7%) | 0 (0.0%) |
| 18 to 34 Years | 0 (0.0%) | 0 (0.0%) |
| 35 to 64 Years | 0 (0.0%) | 0 (0.0%) |
| 65 to 74 Years | 0 (0.0%) | 8 (9.2%) |
| 75 Years and over | 0 (0.0%) | 0 (0.0%) |
Disability Class: Self-Care Difficulty
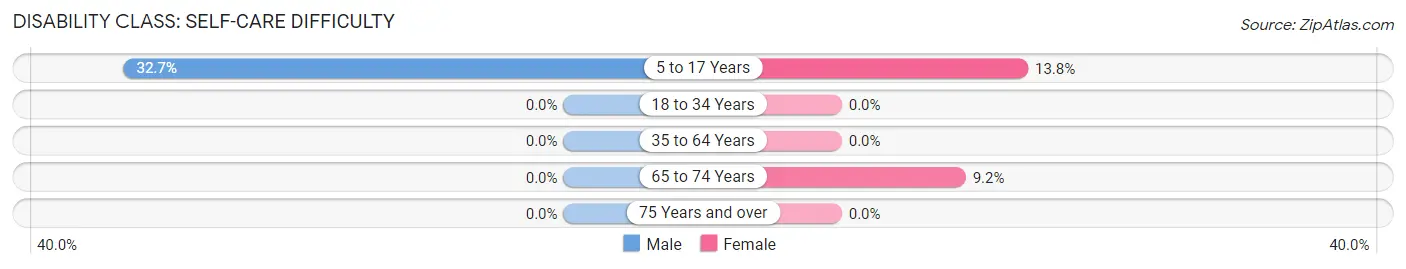
| Age Bracket | Male | Female |
| 5 to 17 Years | 16 (32.7%) | 13 (13.8%) |
| 18 to 34 Years | 0 (0.0%) | 0 (0.0%) |
| 35 to 64 Years | 0 (0.0%) | 0 (0.0%) |
| 65 to 74 Years | 0 (0.0%) | 8 (9.2%) |
| 75 Years and over | 0 (0.0%) | 0 (0.0%) |
Technology Access in Lakeville
Computing Device Access in Lakeville
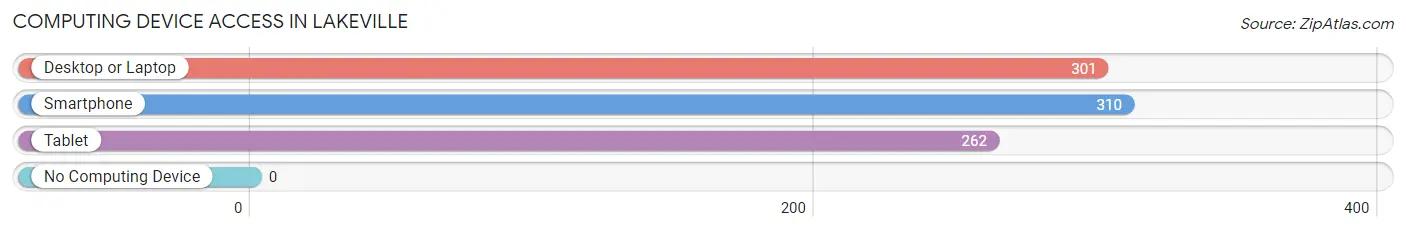
| Device Type | # Households | % Households |
| Desktop or Laptop | 301 | 88.8% |
| Smartphone | 310 | 91.4% |
| Tablet | 262 | 77.3% |
| No Computing Device | 0 | 0.0% |
| Total | 339 | 100.0% |
Internet Access in Lakeville
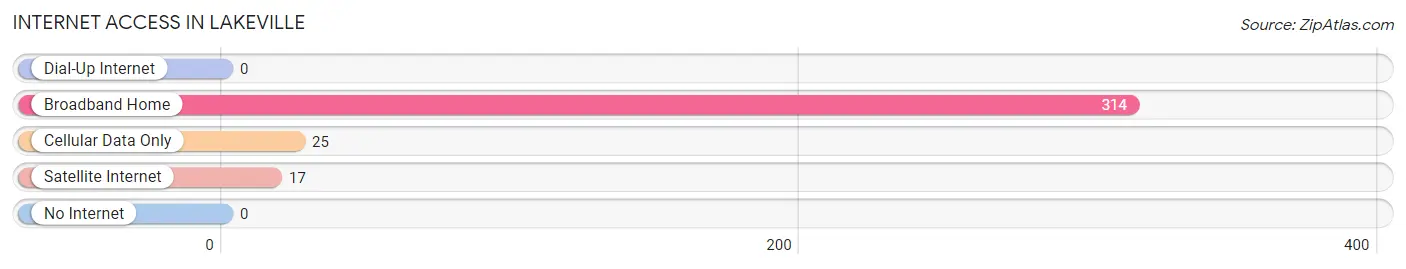
| Internet Type | # Households | % Households |
| Dial-Up Internet | 0 | 0.0% |
| Broadband Home | 314 | 92.6% |
| Cellular Data Only | 25 | 7.4% |
| Satellite Internet | 17 | 5.0% |
| No Internet | 0 | 0.0% |
| Total | 339 | 100.0% |
Lakeville Summary
History
The town of Lakeville, Connecticut is located in the northwest corner of the state, in Litchfield County. It is bordered by the towns of Salisbury, Sharon, and Canaan. The town was originally part of Salisbury, and was known as “Furnace Village” due to the iron ore found in the area. In 1846, the town was incorporated as Lakeville, named after the lake that lies within its borders.
The town was originally a farming community, with a few small industries. In the late 19th century, the town began to develop as a summer resort area, with many wealthy families building large estates in the area. The town was also home to several large hotels, which attracted visitors from all over the country.
In the early 20th century, the town began to develop as a residential community, with many of the summer estates being converted into year-round homes. The town also became a popular destination for artists and writers, who were drawn to the area’s natural beauty and peaceful atmosphere.
Geography
Lakeville is located in the northwest corner of Connecticut, in Litchfield County. It is bordered by the towns of Salisbury, Sharon, and Canaan. The town is situated in the foothills of the Berkshire Mountains, and is home to several lakes, including Lake Wononscopomuc, Lake Wononpakook, and Lake Wononskopomuc.
The town has a total area of 24.2 square miles, of which 22.7 square miles is land and 1.5 square miles is water. The terrain is mostly hilly, with some flat areas in the valleys. The highest point in the town is the summit of Mount Riga, which has an elevation of 1,845 feet.
Economy
The economy of Lakeville is largely based on tourism and recreation. The town is home to several resorts and hotels, which attract visitors from all over the country. The town is also home to several small businesses, including restaurants, retail stores, and art galleries.
The town is also home to several large employers, including the Salisbury School, the Hotchkiss School, and the Sharon Hospital. The town is also home to several small manufacturing companies, which produce a variety of products, including furniture, clothing, and electronics.
Demographics
As of the 2010 census, the town of Lakeville had a population of 2,944. The racial makeup of the town was 95.3% White, 0.7% African American, 0.3% Native American, 0.9% Asian, 0.1% Pacific Islander, 0.7% from other races, and 1.9% from two or more races. Hispanic or Latino of any race were 2.3% of the population.
The median income for a household in the town was $68,750, and the median income for a family was $77,917. The per capita income for the town was $35,945. About 4.3% of families and 5.7% of the population were below the poverty line, including 6.2% of those under age 18 and 4.2% of those age 65 or over.
Common Questions
What is Per Capita Income in Lakeville?
Per Capita income in Lakeville is $62,257.
What is the Median Family Income in Lakeville?
Median Family Income in Lakeville is $147,500.
What is the Median Household income in Lakeville?
Median Household Income in Lakeville is $87,401.
What is Income or Wage Gap in Lakeville?
Income or Wage Gap in Lakeville is 31.8%.
Women in Lakeville earn 68.2 cents for every dollar earned by a man.
What is Inequality or Gini Index in Lakeville?
Inequality or Gini Index in Lakeville is 0.46.
What is the Total Population of Lakeville?
Total Population of Lakeville is 886.
What is the Total Male Population of Lakeville?
Total Male Population of Lakeville is 395.
What is the Total Female Population of Lakeville?
Total Female Population of Lakeville is 491.
What is the Ratio of Males per 100 Females in Lakeville?
There are 80.45 Males per 100 Females in Lakeville.
What is the Ratio of Females per 100 Males in Lakeville?
There are 124.30 Females per 100 Males in Lakeville.
What is the Median Population Age in Lakeville?
Median Population Age in Lakeville is 49.1 Years.
What is the Average Family Size in Lakeville
Average Family Size in Lakeville is 2.9 People.
What is the Average Household Size in Lakeville
Average Household Size in Lakeville is 2.4 People.
How Large is the Labor Force in Lakeville?
There are 502 People in the Labor Forcein in Lakeville.
What is the Percentage of People in the Labor Force in Lakeville?
69.3% of People are in the Labor Force in Lakeville.