Zip Codes with the Highest Percentage of Population Employed in Accommodation & Food Services in Hartford, CT
RELATED REPORTS & OPTIONS
Accommodation & Food Services
Hartford
Compare Zip Codes
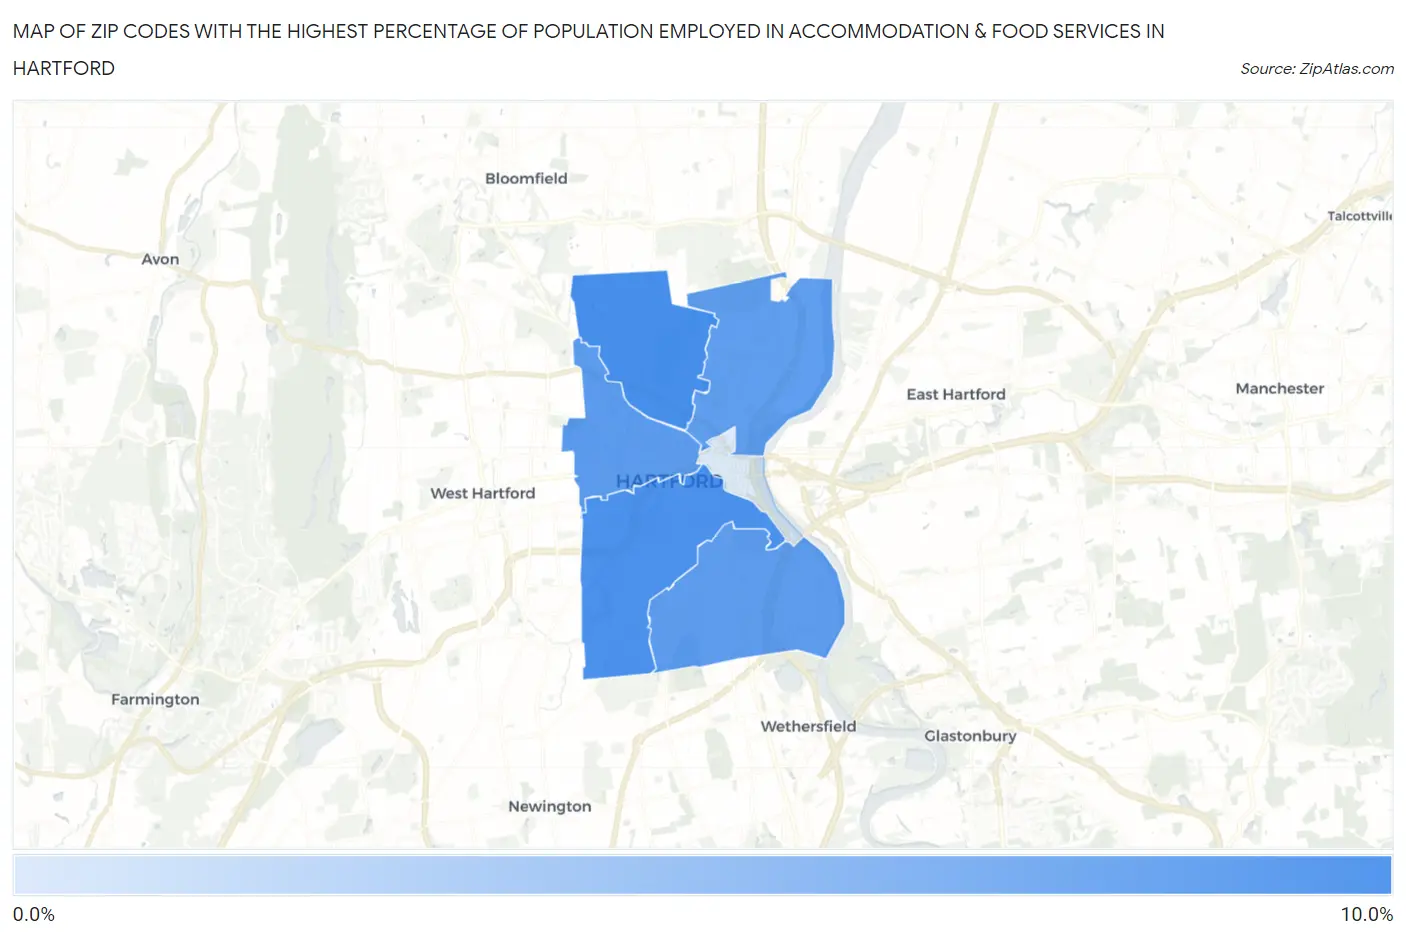
Map of Zip Codes with the Highest Percentage of Population Employed in Accommodation & Food Services in Hartford
1.1%
9.5%
Zip Codes with the Highest Percentage of Population Employed in Accommodation & Food Services in Hartford, CT
| Zip Code | % Employed | vs State | vs National | |
| 1. | 06112 | 9.5% | 5.6%(+3.84)#22 | 6.9%(+2.60)#5,242 |
| 2. | 06106 | 9.2% | 5.6%(+3.57)#26 | 6.9%(+2.32)#5,655 |
| 3. | 06105 | 8.3% | 5.6%(+2.67)#36 | 6.9%(+1.42)#7,214 |
| 4. | 06114 | 8.2% | 5.6%(+2.56)#40 | 6.9%(+1.31)#7,430 |
| 5. | 06120 | 8.1% | 5.6%(+2.43)#42 | 6.9%(+1.18)#7,693 |
| 6. | 06103 | 1.1% | 5.6%(-4.56)#259 | 6.9%(-5.81)#27,190 |
1
Common Questions
What are the Top 5 Zip Codes with the Highest Percentage of Population Employed in Accommodation & Food Services in Hartford, CT?
Top 5 Zip Codes with the Highest Percentage of Population Employed in Accommodation & Food Services in Hartford, CT are:
What zip code has the Highest Percentage of Population Employed in Accommodation & Food Services in Hartford, CT?
06112 has the Highest Percentage of Population Employed in Accommodation & Food Services in Hartford, CT with 9.5%.
What is the Percentage of Population Employed in Accommodation & Food Services in Hartford, CT?
Percentage of Population Employed in Accommodation & Food Services in Hartford is 8.5%.
What is the Percentage of Population Employed in Accommodation & Food Services in Connecticut?
Percentage of Population Employed in Accommodation & Food Services in Connecticut is 5.6%.
What is the Percentage of Population Employed in Accommodation & Food Services in the United States?
Percentage of Population Employed in Accommodation & Food Services in the United States is 6.9%.