Zip Codes with the Highest Percentage of Population Employed in Accommodation & Food Services in Norwalk, CT
RELATED REPORTS & OPTIONS
Accommodation & Food Services
Norwalk
Compare Zip Codes
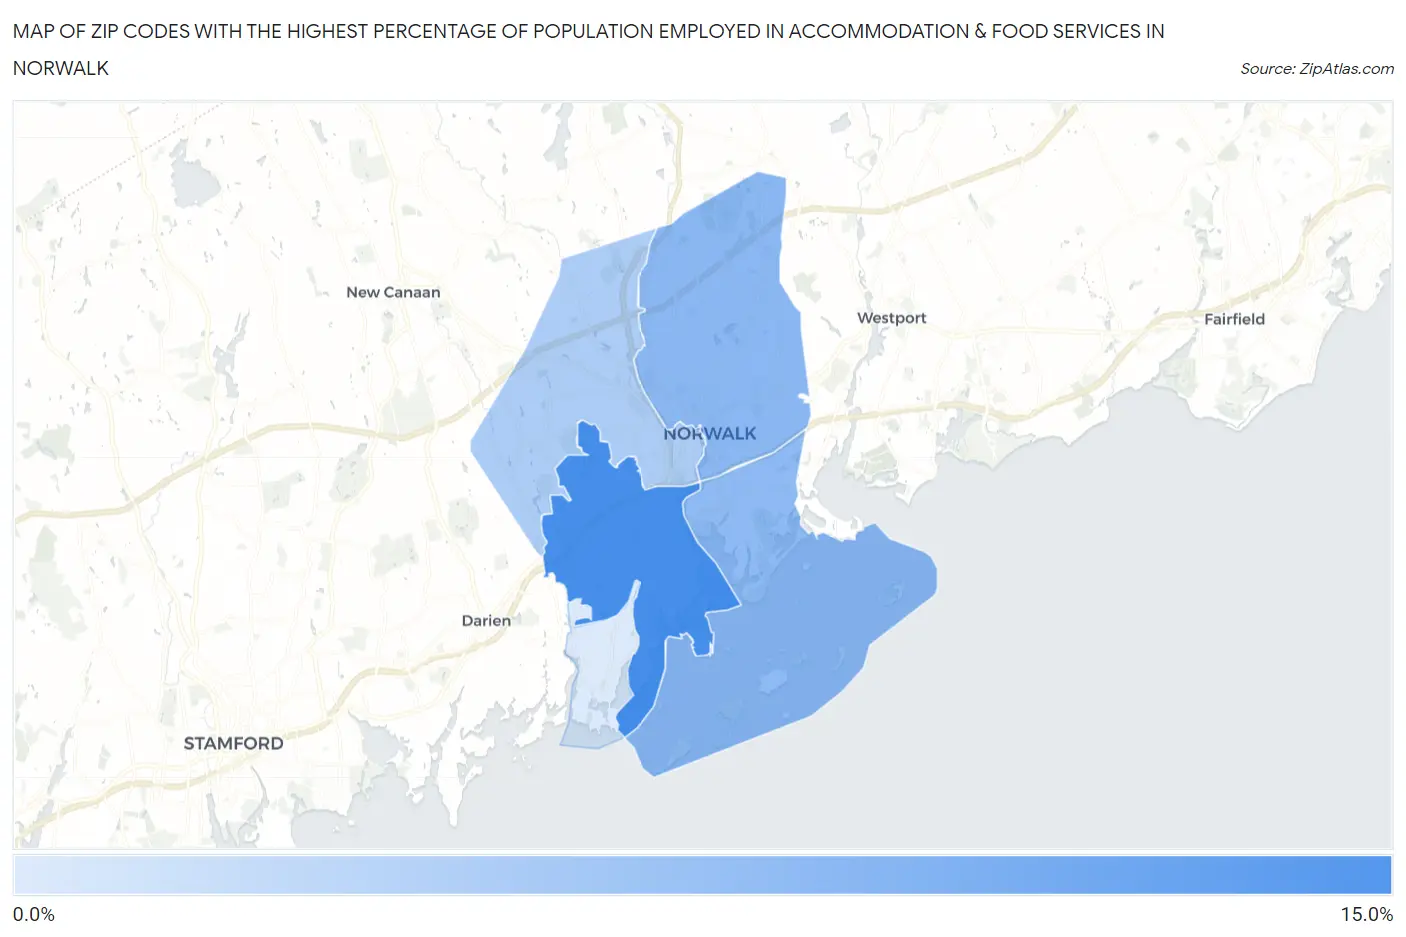
Map of Zip Codes with the Highest Percentage of Population Employed in Accommodation & Food Services in Norwalk
0.47%
11.2%
Zip Codes with the Highest Percentage of Population Employed in Accommodation & Food Services in Norwalk, CT
| Zip Code | % Employed | vs State | vs National | |
| 1. | 06854 | 11.2% | 5.6%(+5.58)#12 | 6.9%(+4.33)#3,384 |
| 2. | 06851 | 6.2% | 5.6%(+0.609)#83 | 6.9%(-0.638)#12,664 |
| 3. | 06855 | 5.9% | 5.6%(+0.310)#95 | 6.9%(-0.937)#13,626 |
| 4. | 06850 | 3.8% | 5.6%(-1.80)#173 | 6.9%(-3.04)#20,673 |
| 5. | 06853 | 0.47% | 5.6%(-5.16)#261 | 6.9%(-6.41)#27,887 |
1
Common Questions
What are the Top 3 Zip Codes with the Highest Percentage of Population Employed in Accommodation & Food Services in Norwalk, CT?
Top 3 Zip Codes with the Highest Percentage of Population Employed in Accommodation & Food Services in Norwalk, CT are:
What zip code has the Highest Percentage of Population Employed in Accommodation & Food Services in Norwalk, CT?
06854 has the Highest Percentage of Population Employed in Accommodation & Food Services in Norwalk, CT with 11.2%.
What is the Percentage of Population Employed in Accommodation & Food Services in Norwalk, CT?
Percentage of Population Employed in Accommodation & Food Services in Norwalk is 7.2%.
What is the Percentage of Population Employed in Accommodation & Food Services in Connecticut?
Percentage of Population Employed in Accommodation & Food Services in Connecticut is 5.6%.
What is the Percentage of Population Employed in Accommodation & Food Services in the United States?
Percentage of Population Employed in Accommodation & Food Services in the United States is 6.9%.