Strasburg, VA Map & Demographics
Strasburg Map
Strasburg Overview
$27,307
PER CAPITA INCOME
$59,363
AVG FAMILY INCOME
$56,244
AVG HOUSEHOLD INCOME
36.1%
WAGE / INCOME GAP [ % ]
63.9¢/ $1
WAGE / INCOME GAP [ $ ]
0.37
INEQUALITY / GINI INDEX
7,104
TOTAL POPULATION
3,481
MALE POPULATION
3,623
FEMALE POPULATION
96.08
MALES / 100 FEMALES
104.08
FEMALES / 100 MALES
36.8
MEDIAN AGE
3.0
AVG FAMILY SIZE
2.4
AVG HOUSEHOLD SIZE
3,443
LABOR FORCE [ PEOPLE ]
63.8%
PERCENT IN LABOR FORCE
3.9%
UNEMPLOYMENT RATE
Strasburg Area Codes
Income in Strasburg
Income Overview in Strasburg
Per Capita Income in Strasburg is $27,307, while median incomes of families and households are $59,363 and $56,244 respectively.
| Characteristic | Number | Measure |
| Per Capita Income | 7,104 | $27,307 |
| Median Family Income | 1,868 | $59,363 |
| Mean Family Income | 1,868 | $71,342 |
| Median Household Income | 2,965 | $56,244 |
| Mean Household Income | 2,965 | $65,663 |
| Income Deficit | 1,868 | $0 |
| Wage / Income Gap (%) | 7,104 | 36.12% |
| Wage / Income Gap ($) | 7,104 | 63.88¢ per $1 |
| Gini / Inequality Index | 7,104 | 0.37 |
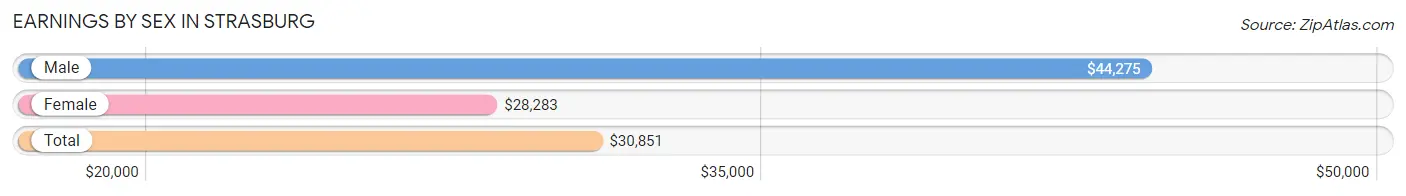
Earnings by Sex in Strasburg
Average Earnings in Strasburg are $30,851, $44,275 for men and $28,283 for women, a difference of 36.1%.
| Sex | Number | Average Earnings |
| Male | 1,851 (50.7%) | $44,275 |
| Female | 1,803 (49.3%) | $28,283 |
| Total | 3,654 (100.0%) | $30,851 |
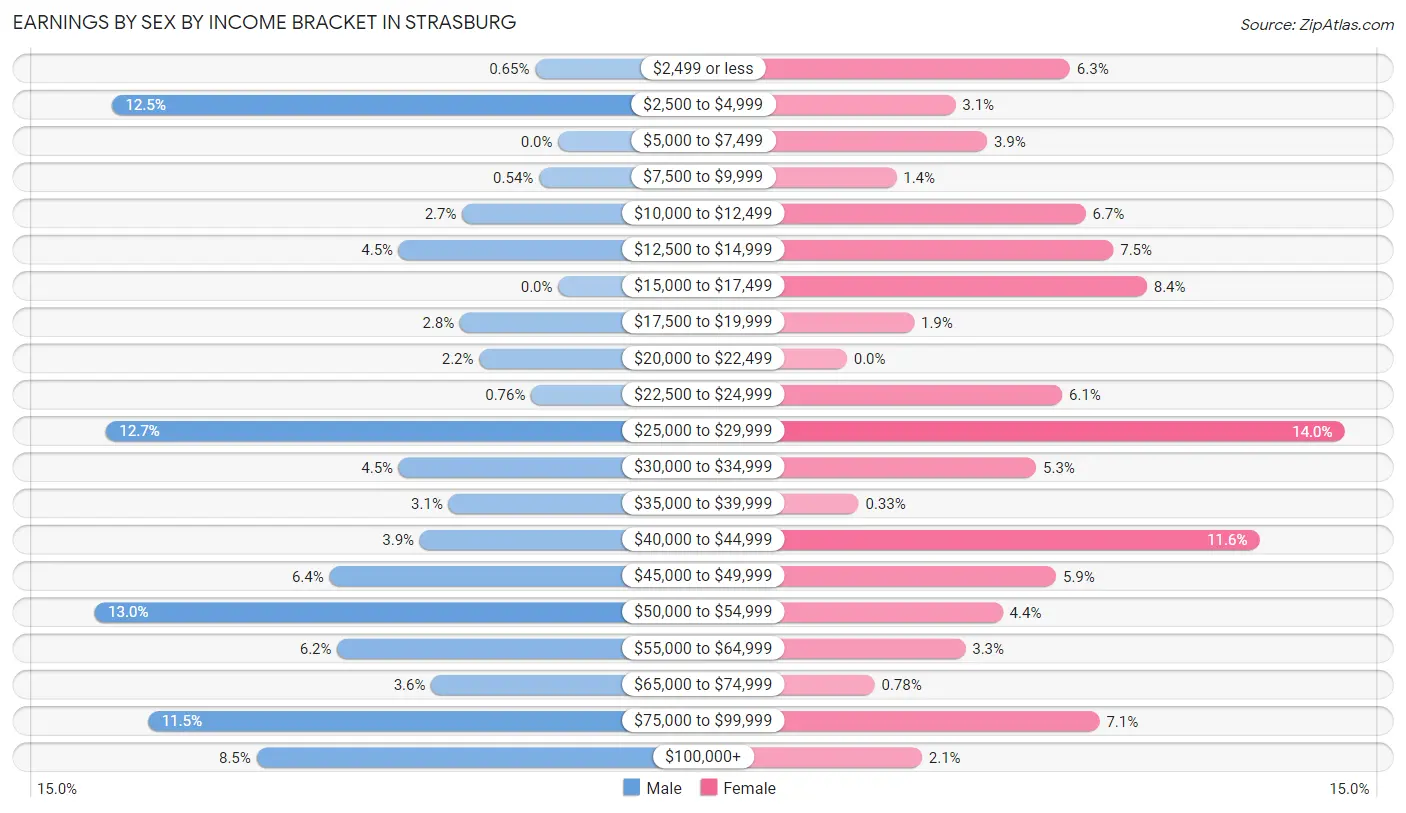
Earnings by Sex by Income Bracket in Strasburg
The most common earnings brackets in Strasburg are $50,000 to $54,999 for men (241 | 13.0%) and $25,000 to $29,999 for women (252 | 14.0%).
| Income | Male | Female |
| $2,499 or less | 12 (0.6%) | 113 (6.3%) |
| $2,500 to $4,999 | 232 (12.5%) | 55 (3.0%) |
| $5,000 to $7,499 | 0 (0.0%) | 71 (3.9%) |
| $7,500 to $9,999 | 10 (0.5%) | 25 (1.4%) |
| $10,000 to $12,499 | 50 (2.7%) | 121 (6.7%) |
| $12,500 to $14,999 | 83 (4.5%) | 135 (7.5%) |
| $15,000 to $17,499 | 0 (0.0%) | 152 (8.4%) |
| $17,500 to $19,999 | 51 (2.8%) | 34 (1.9%) |
| $20,000 to $22,499 | 41 (2.2%) | 0 (0.0%) |
| $22,500 to $24,999 | 14 (0.8%) | 109 (6.0%) |
| $25,000 to $29,999 | 235 (12.7%) | 252 (14.0%) |
| $30,000 to $34,999 | 83 (4.5%) | 96 (5.3%) |
| $35,000 to $39,999 | 57 (3.1%) | 6 (0.3%) |
| $40,000 to $44,999 | 72 (3.9%) | 209 (11.6%) |
| $45,000 to $49,999 | 119 (6.4%) | 106 (5.9%) |
| $50,000 to $54,999 | 241 (13.0%) | 79 (4.4%) |
| $55,000 to $64,999 | 115 (6.2%) | 60 (3.3%) |
| $65,000 to $74,999 | 66 (3.6%) | 14 (0.8%) |
| $75,000 to $99,999 | 213 (11.5%) | 128 (7.1%) |
| $100,000+ | 157 (8.5%) | 38 (2.1%) |
| Total | 1,851 (100.0%) | 1,803 (100.0%) |
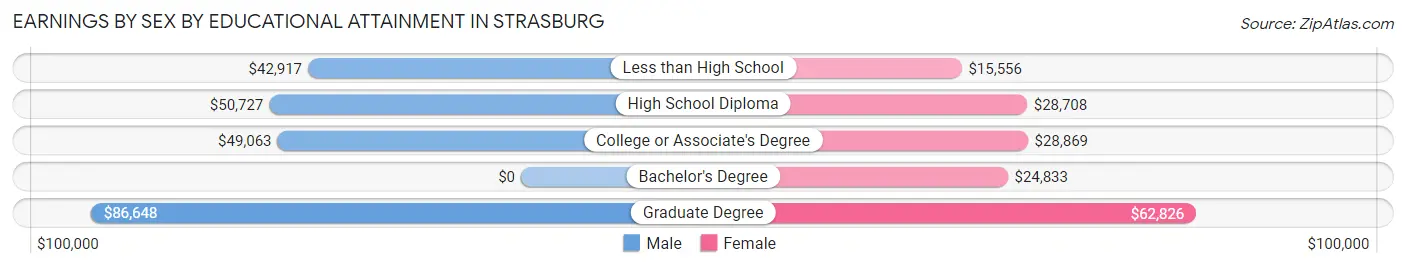
Earnings by Sex by Educational Attainment in Strasburg
Average earnings in Strasburg are $50,269 for men and $29,126 for women, a difference of 42.1%. Men with an educational attainment of graduate degree enjoy the highest average annual earnings of $86,648, while those with less than high school education earn the least with $42,917. Women with an educational attainment of graduate degree earn the most with the average annual earnings of $62,826, while those with less than high school education have the smallest earnings of $15,556.
| Educational Attainment | Male Income | Female Income |
| Less than High School | $42,917 | $15,556 |
| High School Diploma | $50,727 | $28,708 |
| College or Associate's Degree | $49,063 | $28,869 |
| Bachelor's Degree | - | - |
| Graduate Degree | $86,648 | $62,826 |
| Total | $50,269 | $29,126 |
Family Income in Strasburg
Family Income Brackets in Strasburg
According to the Strasburg family income data, there are 478 families falling into the $75,000 to $99,999 income range, which is the most common income bracket and makes up 25.6% of all families.
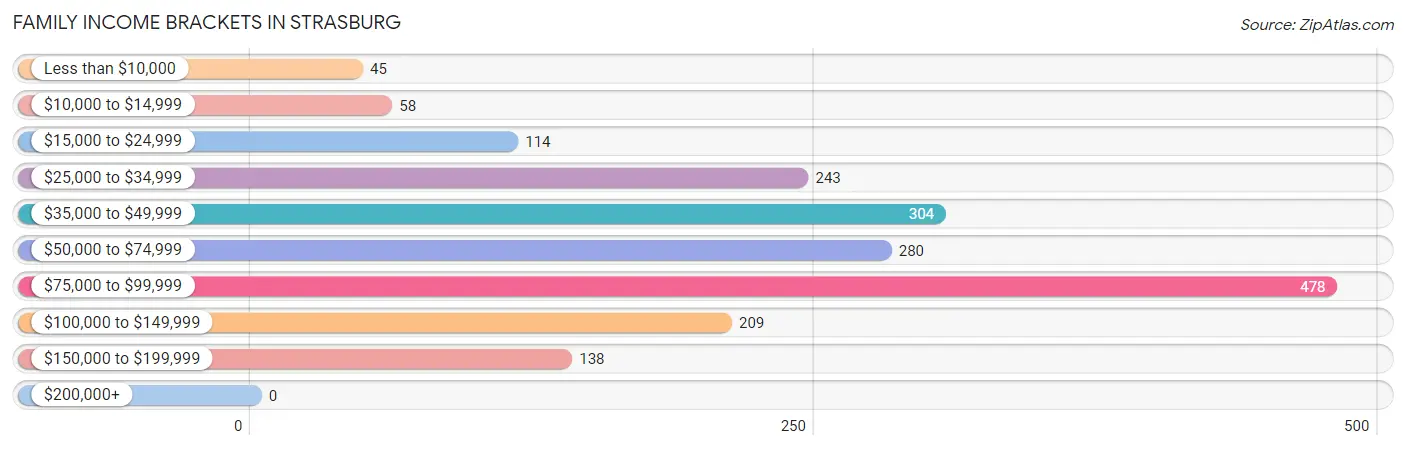
| Income Bracket | # Families | % Families |
| Less than $10,000 | 45 | 2.4% |
| $10,000 to $14,999 | 58 | 3.1% |
| $15,000 to $24,999 | 114 | 6.1% |
| $25,000 to $34,999 | 243 | 13.0% |
| $35,000 to $49,999 | 304 | 16.3% |
| $50,000 to $74,999 | 280 | 15.0% |
| $75,000 to $99,999 | 478 | 25.6% |
| $100,000 to $149,999 | 209 | 11.2% |
| $150,000 to $199,999 | 138 | 7.4% |
| $200,000+ | 0 | 0.0% |
Family Income by Famaliy Size in Strasburg
5-person families (169 | 9.0%) account for the highest median family income in Strasburg with $93,728 per family, while 3-person families (238 | 12.7%) have the highest median income of $26,408 per family member.
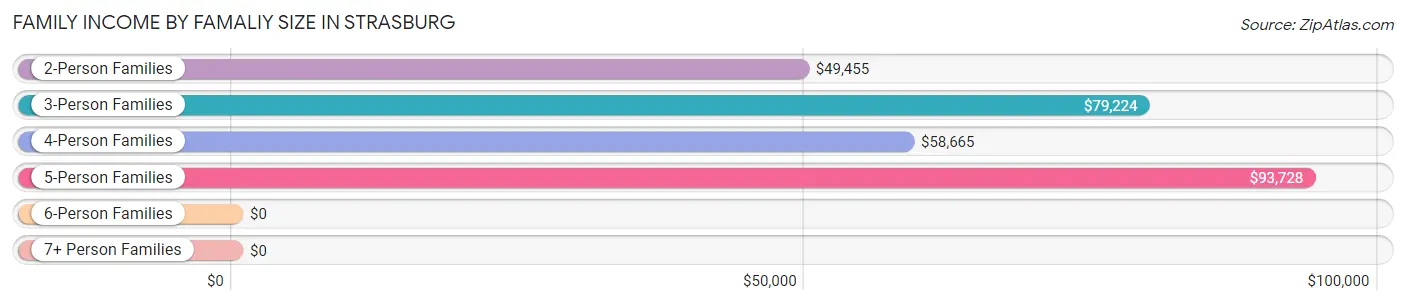
| Income Bracket | # Families | Median Income |
| 2-Person Families | 1,021 (54.7%) | $49,455 |
| 3-Person Families | 238 (12.7%) | $79,224 |
| 4-Person Families | 386 (20.7%) | $58,665 |
| 5-Person Families | 169 (9.0%) | $93,728 |
| 6-Person Families | 38 (2.0%) | $0 |
| 7+ Person Families | 16 (0.9%) | $0 |
| Total | 1,868 (100.0%) | $59,363 |
Family Income by Number of Earners in Strasburg
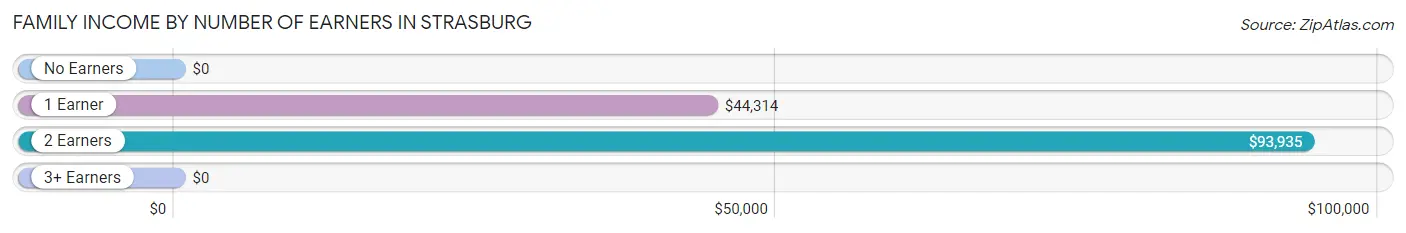
| Number of Earners | # Families | Median Income |
| No Earners | 249 (13.3%) | $0 |
| 1 Earner | 748 (40.0%) | $44,314 |
| 2 Earners | 660 (35.3%) | $93,935 |
| 3+ Earners | 211 (11.3%) | $0 |
| Total | 1,868 (100.0%) | $59,363 |
Household Income in Strasburg
Household Income Brackets in Strasburg
With 632 households falling in the category, the $50,000 to $74,999 income range is the most frequent in Strasburg, accounting for 21.3% of all households. In contrast, only 9 households (0.3%) fall into the $200,000+ income bracket, making it the least populous group.
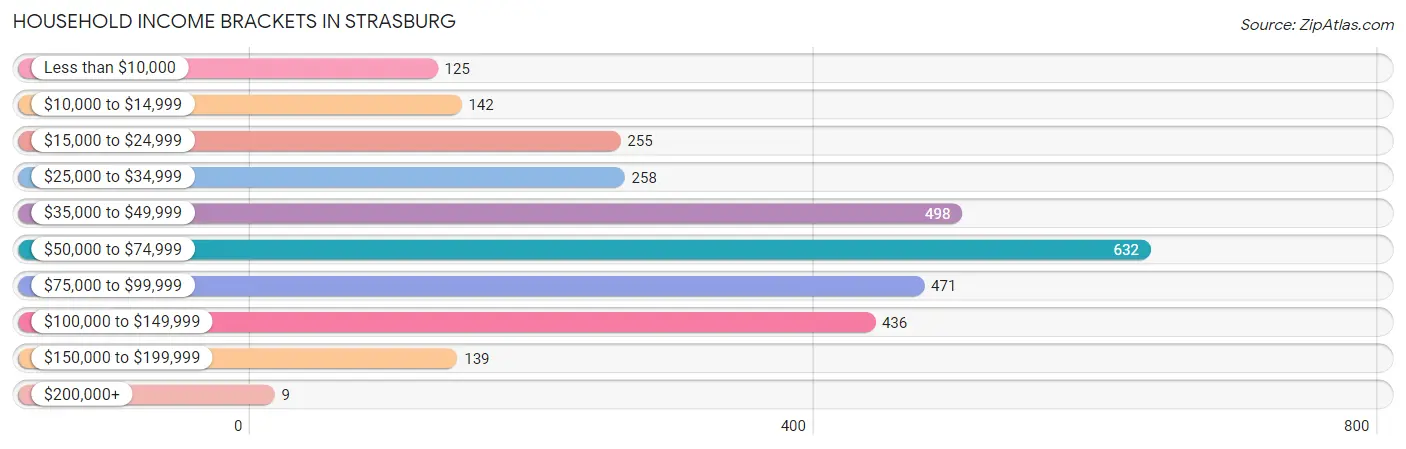
| Income Bracket | # Households | % Households |
| Less than $10,000 | 125 | 4.2% |
| $10,000 to $14,999 | 142 | 4.8% |
| $15,000 to $24,999 | 255 | 8.6% |
| $25,000 to $34,999 | 258 | 8.7% |
| $35,000 to $49,999 | 498 | 16.8% |
| $50,000 to $74,999 | 632 | 21.3% |
| $75,000 to $99,999 | 471 | 15.9% |
| $100,000 to $149,999 | 436 | 14.7% |
| $150,000 to $199,999 | 139 | 4.7% |
| $200,000+ | 9 | 0.3% |
Household Income by Householder Age in Strasburg
The median household income in Strasburg is $56,244, with the highest median household income of $59,105 found in the 45 to 64 years age bracket for the primary householder. A total of 931 households (31.4%) fall into this category. Meanwhile, the 15 to 24 years age bracket for the primary householder has the lowest median household income of $0, with 140 households (4.7%) in this group.
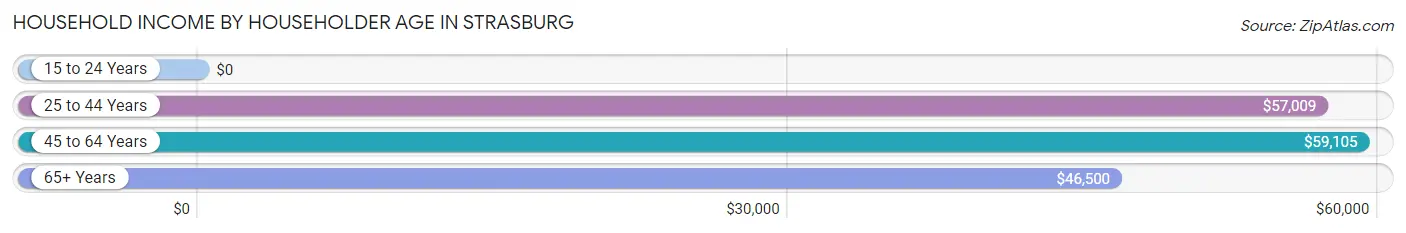
| Income Bracket | # Households | Median Income |
| 15 to 24 Years | 140 (4.7%) | $0 |
| 25 to 44 Years | 1,034 (34.9%) | $57,009 |
| 45 to 64 Years | 931 (31.4%) | $59,105 |
| 65+ Years | 860 (29.0%) | $46,500 |
| Total | 2,965 (100.0%) | $56,244 |
Poverty in Strasburg
Income Below Poverty by Sex and Age in Strasburg
With 6.2% poverty level for males and 13.5% for females among the residents of Strasburg, 5 year old males and 18 to 24 year old females are the most vulnerable to poverty, with 16 males (39.0%) and 99 females (46.7%) in their respective age groups living below the poverty level.
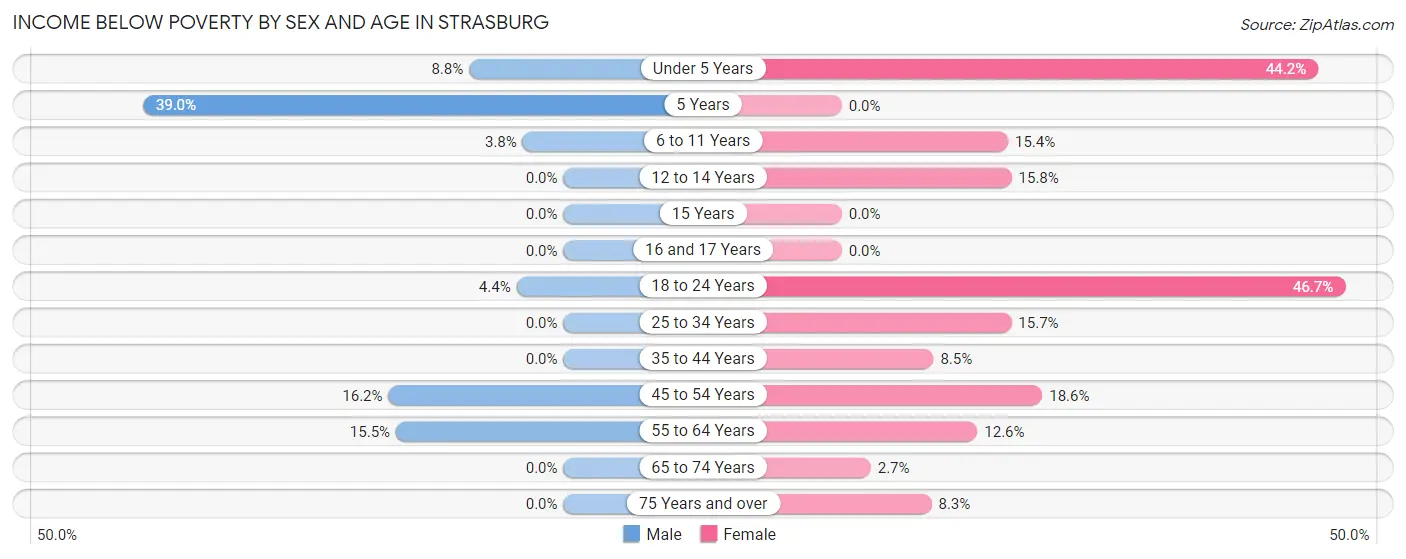
| Age Bracket | Male | Female |
| Under 5 Years | 44 (8.7%) | 57 (44.2%) |
| 5 Years | 16 (39.0%) | 0 (0.0%) |
| 6 to 11 Years | 13 (3.8%) | 29 (15.4%) |
| 12 to 14 Years | 0 (0.0%) | 29 (15.8%) |
| 15 Years | 0 (0.0%) | 0 (0.0%) |
| 16 and 17 Years | 0 (0.0%) | 0 (0.0%) |
| 18 to 24 Years | 16 (4.3%) | 99 (46.7%) |
| 25 to 34 Years | 0 (0.0%) | 65 (15.7%) |
| 35 to 44 Years | 0 (0.0%) | 65 (8.5%) |
| 45 to 54 Years | 64 (16.2%) | 67 (18.6%) |
| 55 to 64 Years | 62 (15.5%) | 41 (12.6%) |
| 65 to 74 Years | 0 (0.0%) | 11 (2.7%) |
| 75 Years and over | 0 (0.0%) | 25 (8.3%) |
| Total | 215 (6.2%) | 488 (13.5%) |
Income Above Poverty by Sex and Age in Strasburg
According to the poverty statistics in Strasburg, males aged 12 to 14 years and females aged 5 years are the age groups that are most secure financially, with 100.0% of males and 100.0% of females in these age groups living above the poverty line.
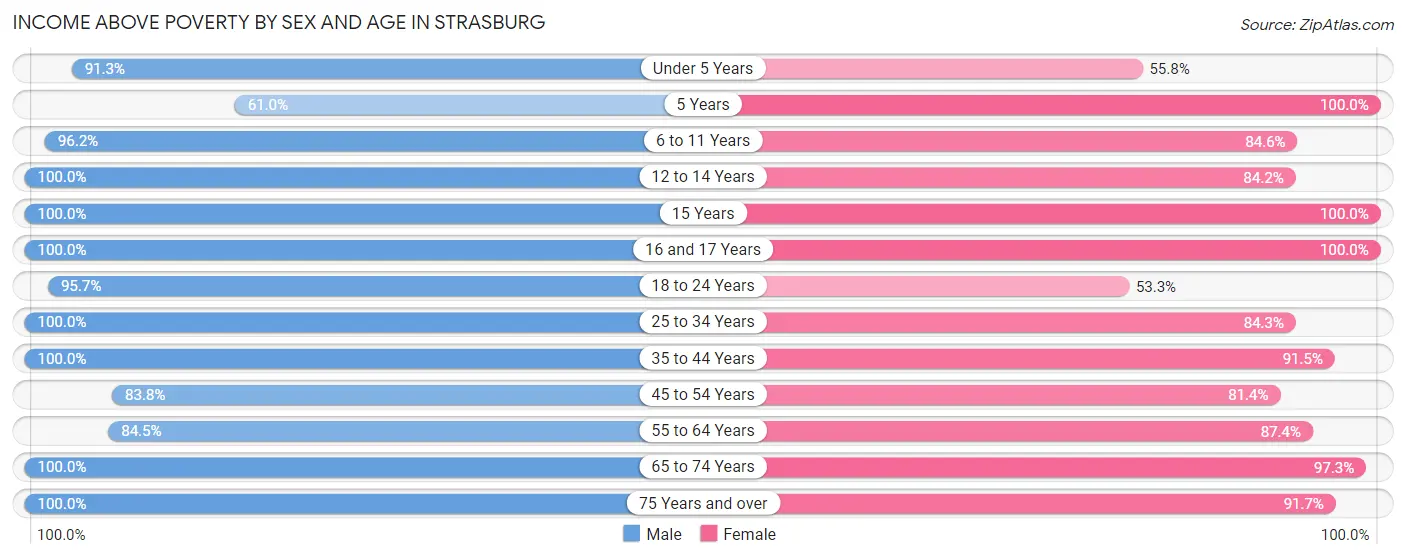
| Age Bracket | Male | Female |
| Under 5 Years | 459 (91.2%) | 72 (55.8%) |
| 5 Years | 25 (61.0%) | 79 (100.0%) |
| 6 to 11 Years | 331 (96.2%) | 159 (84.6%) |
| 12 to 14 Years | 100 (100.0%) | 155 (84.2%) |
| 15 Years | 27 (100.0%) | 113 (100.0%) |
| 16 and 17 Years | 70 (100.0%) | 146 (100.0%) |
| 18 to 24 Years | 352 (95.7%) | 113 (53.3%) |
| 25 to 34 Years | 247 (100.0%) | 348 (84.3%) |
| 35 to 44 Years | 453 (100.0%) | 699 (91.5%) |
| 45 to 54 Years | 330 (83.8%) | 293 (81.4%) |
| 55 to 64 Years | 337 (84.5%) | 285 (87.4%) |
| 65 to 74 Years | 362 (100.0%) | 398 (97.3%) |
| 75 Years and over | 173 (100.0%) | 275 (91.7%) |
| Total | 3,266 (93.8%) | 3,135 (86.5%) |
Income Below Poverty Among Married-Couple Families in Strasburg
The poverty statistics for married-couple families in Strasburg show that 3.7% or 41 of the total 1,119 families live below the poverty line. Families with no children have the highest poverty rate of 5.5%, comprising of 41 families. On the other hand, families with 1 or 2 children have the lowest poverty rate of 0.0%, which includes 0 families.
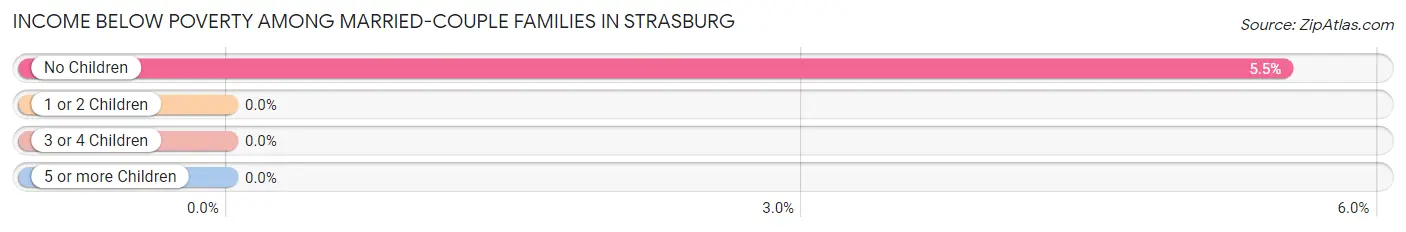
| Children | Above Poverty | Below Poverty |
| No Children | 703 (94.5%) | 41 (5.5%) |
| 1 or 2 Children | 277 (100.0%) | 0 (0.0%) |
| 3 or 4 Children | 82 (100.0%) | 0 (0.0%) |
| 5 or more Children | 16 (100.0%) | 0 (0.0%) |
| Total | 1,078 (96.3%) | 41 (3.7%) |
Income Below Poverty Among Single-Parent Households in Strasburg
According to the poverty data in Strasburg, 19.2% or 23 single-father households and 12.6% or 79 single-mother households are living below the poverty line. Among single-father households, those with no children have the highest poverty rate, with 23 households (32.4%) experiencing poverty. Likewise, among single-mother households, those with 3 or 4 children have the highest poverty rate, with 67 households (33.0%) falling below the poverty line.
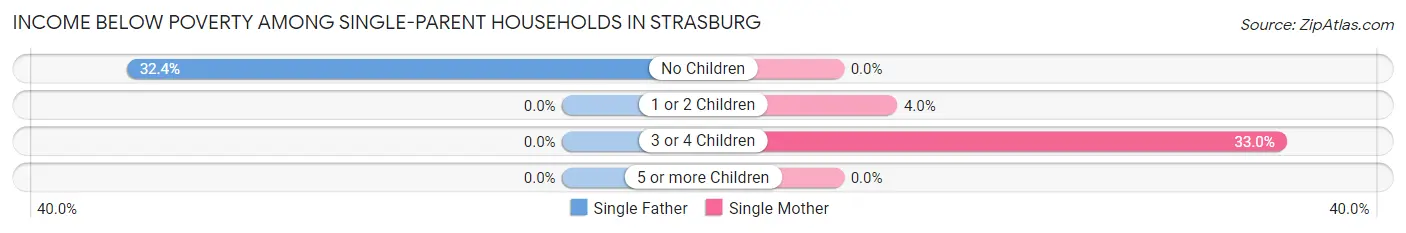
| Children | Single Father | Single Mother |
| No Children | 23 (32.4%) | 0 (0.0%) |
| 1 or 2 Children | 0 (0.0%) | 12 (4.0%) |
| 3 or 4 Children | 0 (0.0%) | 67 (33.0%) |
| 5 or more Children | 0 (0.0%) | 0 (0.0%) |
| Total | 23 (19.2%) | 79 (12.6%) |
Income Below Poverty Among Married-Couple vs Single-Parent Households in Strasburg
The poverty data for Strasburg shows that 41 of the married-couple family households (3.7%) and 102 of the single-parent households (13.6%) are living below the poverty level. Within the married-couple family households, those with no children have the highest poverty rate, with 41 households (5.5%) falling below the poverty line. Among the single-parent households, those with 3 or 4 children have the highest poverty rate, with 67 household (33.0%) living below poverty.
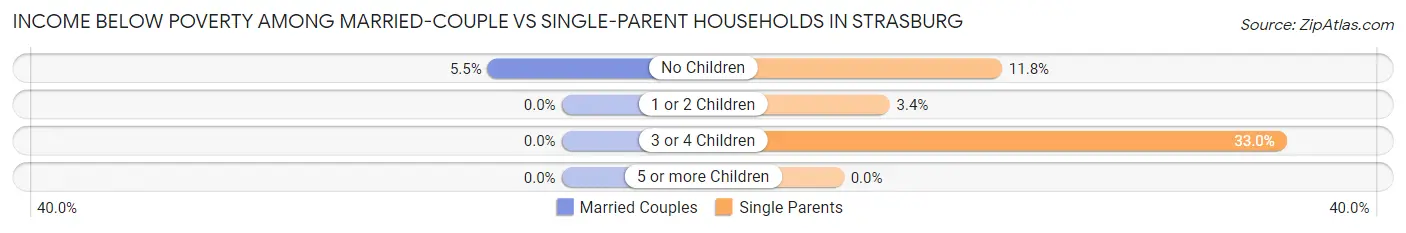
| Children | Married-Couple Families | Single-Parent Households |
| No Children | 41 (5.5%) | 23 (11.8%) |
| 1 or 2 Children | 0 (0.0%) | 12 (3.4%) |
| 3 or 4 Children | 0 (0.0%) | 67 (33.0%) |
| 5 or more Children | 0 (0.0%) | 0 (0.0%) |
| Total | 41 (3.7%) | 102 (13.6%) |
Race in Strasburg
The most populous races in Strasburg are White / Caucasian (6,000 | 84.5%), Two or more Races (530 | 7.5%), and Hispanic or Latino (437 | 6.1%).
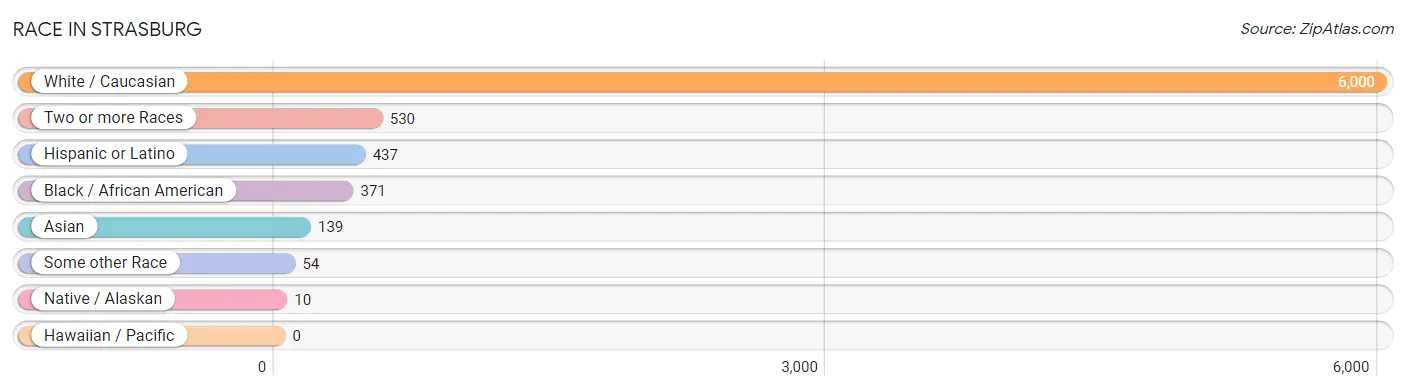
| Race | # Population | % Population |
| Asian | 139 | 2.0% |
| Black / African American | 371 | 5.2% |
| Hawaiian / Pacific | 0 | 0.0% |
| Hispanic or Latino | 437 | 6.1% |
| Native / Alaskan | 10 | 0.1% |
| White / Caucasian | 6,000 | 84.5% |
| Two or more Races | 530 | 7.5% |
| Some other Race | 54 | 0.8% |
| Total | 7,104 | 100.0% |
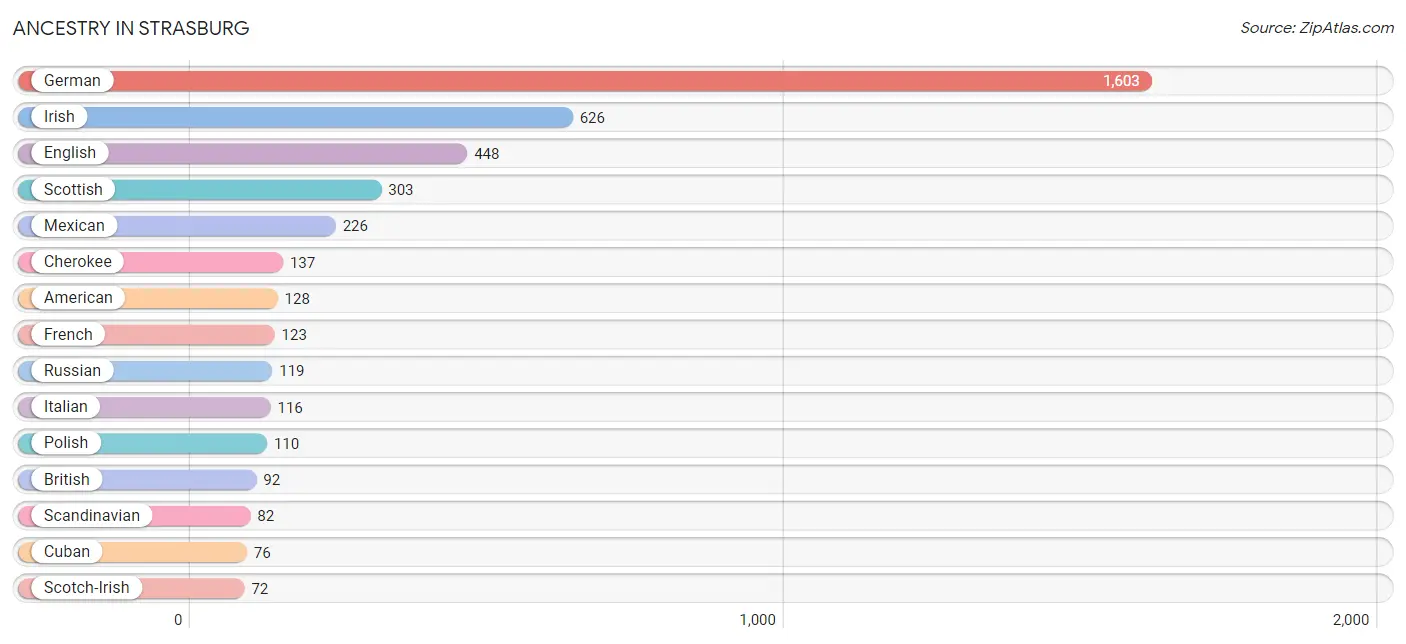
Ancestry in Strasburg
The most populous ancestries reported in Strasburg are German (1,603 | 22.6%), Irish (626 | 8.8%), English (448 | 6.3%), Scottish (303 | 4.3%), and Mexican (226 | 3.2%), together accounting for 45.1% of all Strasburg residents.
| Ancestry | # Population | % Population |
| African | 40 | 0.6% |
| American | 128 | 1.8% |
| Arab | 24 | 0.3% |
| British | 92 | 1.3% |
| Central American | 67 | 0.9% |
| Cherokee | 137 | 1.9% |
| Cuban | 76 | 1.1% |
| Dutch | 48 | 0.7% |
| Ecuadorian | 52 | 0.7% |
| English | 448 | 6.3% |
| European | 61 | 0.9% |
| French | 123 | 1.7% |
| French American Indian | 18 | 0.3% |
| French Canadian | 18 | 0.3% |
| German | 1,603 | 22.6% |
| Honduran | 25 | 0.4% |
| Hungarian | 3 | 0.0% |
| Irish | 626 | 8.8% |
| Italian | 116 | 1.6% |
| Jamaican | 18 | 0.3% |
| Lebanese | 24 | 0.3% |
| Malaysian | 34 | 0.5% |
| Mexican | 226 | 3.2% |
| Polish | 110 | 1.5% |
| Portuguese | 18 | 0.3% |
| Puerto Rican | 16 | 0.2% |
| Russian | 119 | 1.7% |
| Salvadoran | 42 | 0.6% |
| Scandinavian | 82 | 1.1% |
| Scotch-Irish | 72 | 1.0% |
| Scottish | 303 | 4.3% |
| Slovak | 60 | 0.8% |
| South American | 52 | 0.7% |
| Subsaharan African | 40 | 0.6% |
| Swiss | 29 | 0.4% |
| Welsh | 67 | 0.9% | View All 36 Rows |
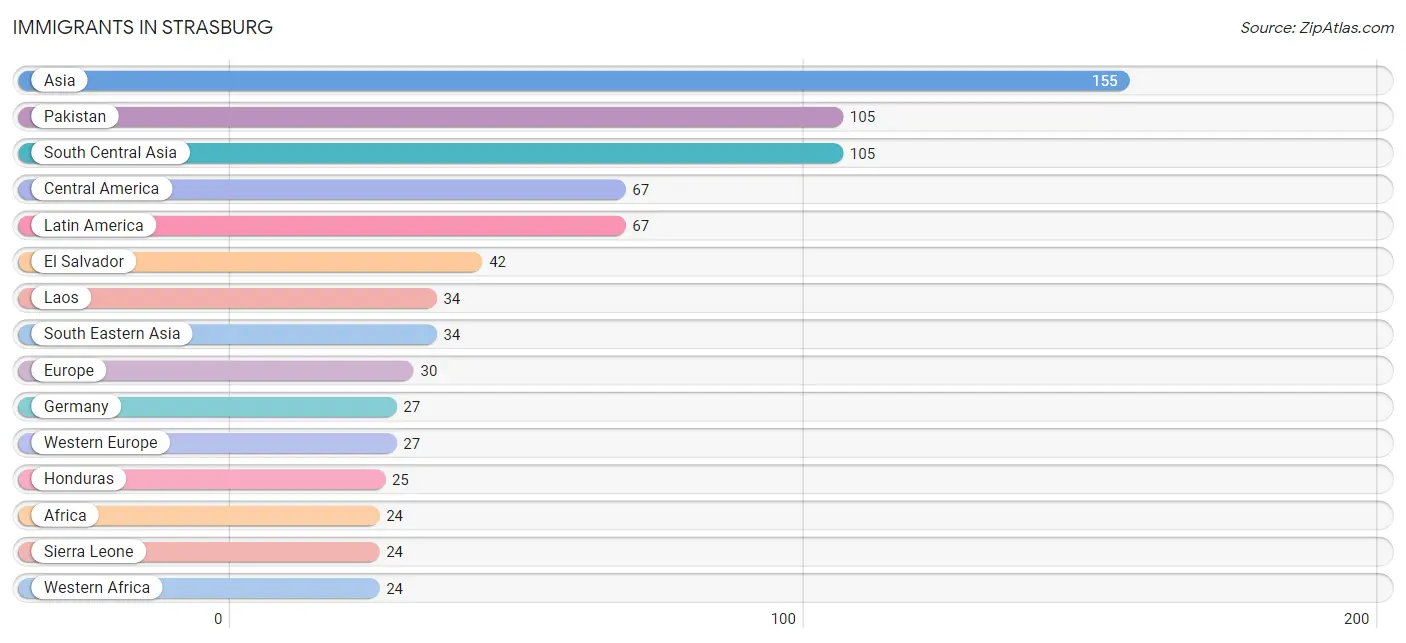
Immigrants in Strasburg
The most numerous immigrant groups reported in Strasburg came from Asia (155 | 2.2%), Pakistan (105 | 1.5%), South Central Asia (105 | 1.5%), Central America (67 | 0.9%), and Latin America (67 | 0.9%), together accounting for 7.0% of all Strasburg residents.
| Immigration Origin | # Population | % Population |
| Africa | 24 | 0.3% |
| Asia | 155 | 2.2% |
| Central America | 67 | 0.9% |
| Eastern Europe | 3 | 0.0% |
| El Salvador | 42 | 0.6% |
| Europe | 30 | 0.4% |
| Germany | 27 | 0.4% |
| Honduras | 25 | 0.4% |
| Hungary | 3 | 0.0% |
| Israel | 16 | 0.2% |
| Laos | 34 | 0.5% |
| Latin America | 67 | 0.9% |
| Pakistan | 105 | 1.5% |
| Sierra Leone | 24 | 0.3% |
| South Central Asia | 105 | 1.5% |
| South Eastern Asia | 34 | 0.5% |
| Western Africa | 24 | 0.3% |
| Western Asia | 16 | 0.2% |
| Western Europe | 27 | 0.4% | View All 19 Rows |
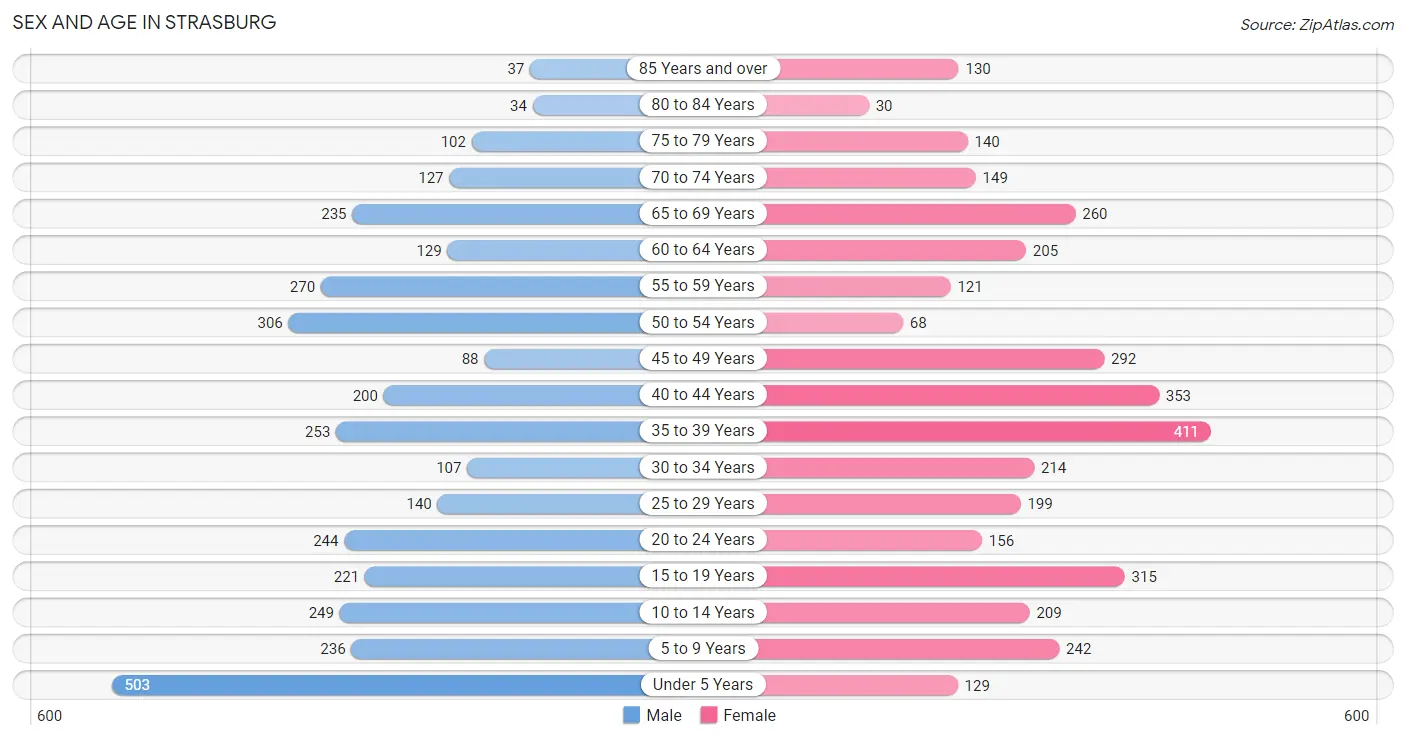
Sex and Age in Strasburg
Sex and Age in Strasburg
The most populous age groups in Strasburg are Under 5 Years (503 | 14.4%) for men and 35 to 39 Years (411 | 11.3%) for women.
| Age Bracket | Male | Female |
| Under 5 Years | 503 (14.4%) | 129 (3.6%) |
| 5 to 9 Years | 236 (6.8%) | 242 (6.7%) |
| 10 to 14 Years | 249 (7.1%) | 209 (5.8%) |
| 15 to 19 Years | 221 (6.4%) | 315 (8.7%) |
| 20 to 24 Years | 244 (7.0%) | 156 (4.3%) |
| 25 to 29 Years | 140 (4.0%) | 199 (5.5%) |
| 30 to 34 Years | 107 (3.1%) | 214 (5.9%) |
| 35 to 39 Years | 253 (7.3%) | 411 (11.3%) |
| 40 to 44 Years | 200 (5.8%) | 353 (9.7%) |
| 45 to 49 Years | 88 (2.5%) | 292 (8.1%) |
| 50 to 54 Years | 306 (8.8%) | 68 (1.9%) |
| 55 to 59 Years | 270 (7.8%) | 121 (3.3%) |
| 60 to 64 Years | 129 (3.7%) | 205 (5.7%) |
| 65 to 69 Years | 235 (6.8%) | 260 (7.2%) |
| 70 to 74 Years | 127 (3.6%) | 149 (4.1%) |
| 75 to 79 Years | 102 (2.9%) | 140 (3.9%) |
| 80 to 84 Years | 34 (1.0%) | 30 (0.8%) |
| 85 Years and over | 37 (1.1%) | 130 (3.6%) |
| Total | 3,481 (100.0%) | 3,623 (100.0%) |
Families and Households in Strasburg
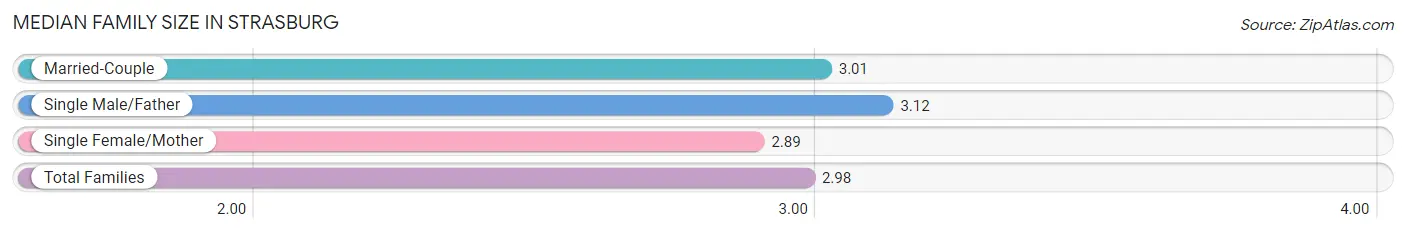
Median Family Size in Strasburg
The median family size in Strasburg is 2.98 persons per family, with single male/father families (120 | 6.4%) accounting for the largest median family size of 3.12 persons per family. On the other hand, single female/mother families (629 | 33.7%) represent the smallest median family size with 2.89 persons per family.
| Family Type | # Families | Family Size |
| Married-Couple | 1,119 (59.9%) | 3.01 |
| Single Male/Father | 120 (6.4%) | 3.12 |
| Single Female/Mother | 629 (33.7%) | 2.89 |
| Total Families | 1,868 (100.0%) | 2.98 |
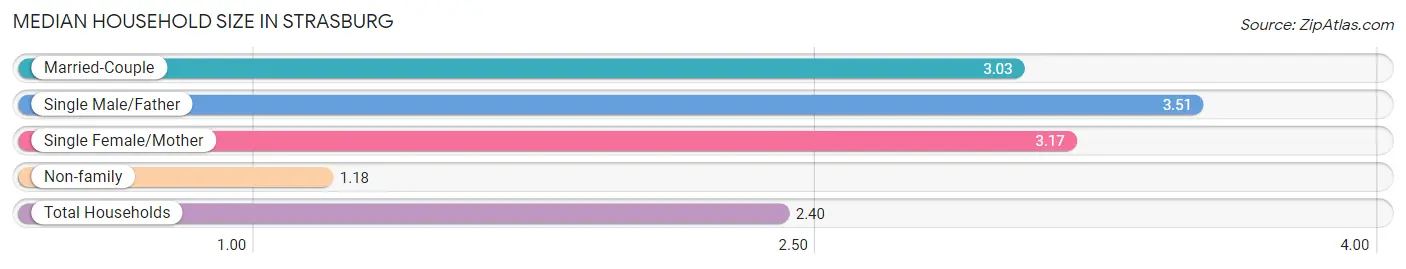
Median Household Size in Strasburg
The median household size in Strasburg is 2.40 persons per household, with single male/father households (120 | 4.1%) accounting for the largest median household size of 3.51 persons per household. non-family households (1,097 | 37.0%) represent the smallest median household size with 1.18 persons per household.
| Household Type | # Households | Household Size |
| Married-Couple | 1,119 (37.7%) | 3.03 |
| Single Male/Father | 120 (4.1%) | 3.51 |
| Single Female/Mother | 629 (21.2%) | 3.17 |
| Non-family | 1,097 (37.0%) | 1.18 |
| Total Households | 2,965 (100.0%) | 2.40 |
Household Size by Marriage Status in Strasburg
Out of a total of 2,965 households in Strasburg, 1,868 (63.0%) are family households, while 1,097 (37.0%) are nonfamily households. The most numerous type of family households are 2-person households, comprising 809, and the most common type of nonfamily households are 1-person households, comprising 959.
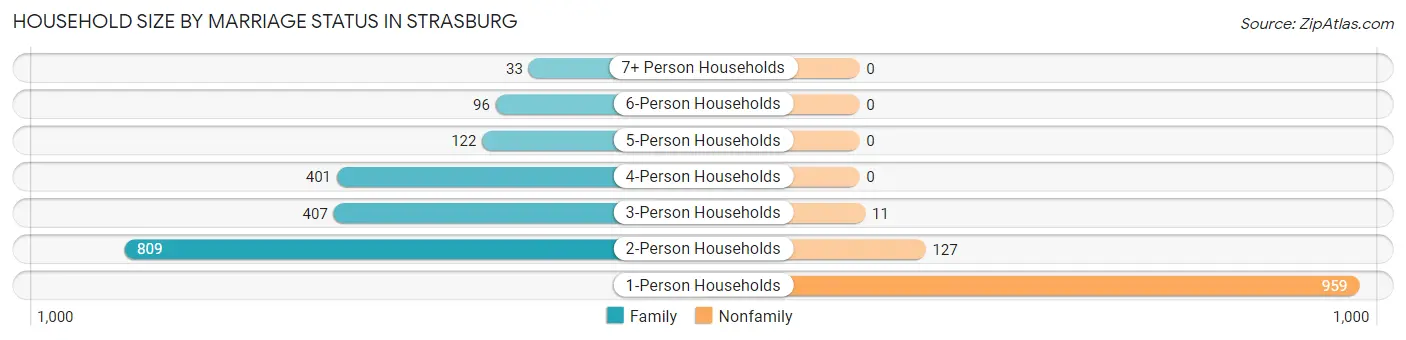
| Household Size | Family Households | Nonfamily Households |
| 1-Person Households | - | 959 (32.3%) |
| 2-Person Households | 809 (27.3%) | 127 (4.3%) |
| 3-Person Households | 407 (13.7%) | 11 (0.4%) |
| 4-Person Households | 401 (13.5%) | 0 (0.0%) |
| 5-Person Households | 122 (4.1%) | 0 (0.0%) |
| 6-Person Households | 96 (3.2%) | 0 (0.0%) |
| 7+ Person Households | 33 (1.1%) | 0 (0.0%) |
| Total | 1,868 (63.0%) | 1,097 (37.0%) |
Female Fertility in Strasburg
Fertility by Age in Strasburg
Average fertility rate in Strasburg is 58.0 births per 1,000 women. Women in the age bracket of 35 to 50 years have the highest fertility rate with 90.0 births per 1,000 women. Women in the age bracket of 35 to 50 years acount for 85.2% of all women with births.
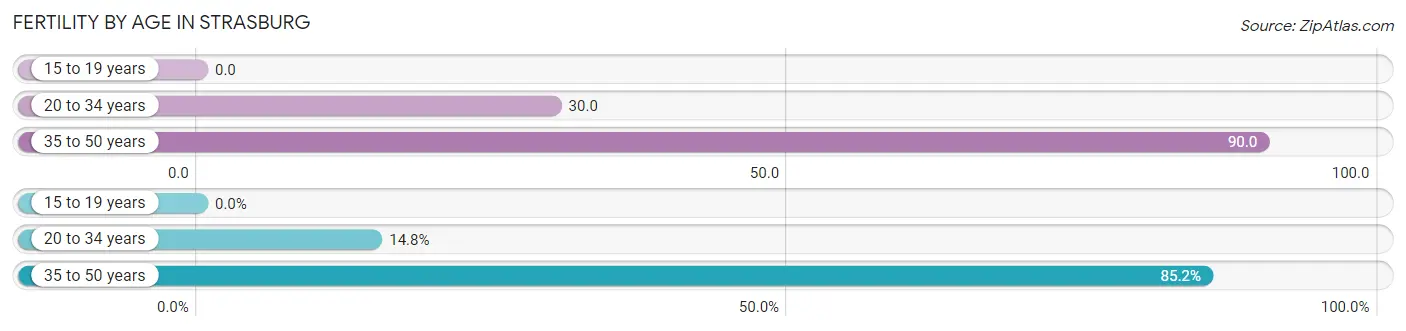
| Age Bracket | Women with Births | Births / 1,000 Women |
| 15 to 19 years | 0 (0.0%) | 0.0 |
| 20 to 34 years | 17 (14.8%) | 30.0 |
| 35 to 50 years | 98 (85.2%) | 90.0 |
| Total | 115 (100.0%) | 58.0 |
Fertility by Age by Marriage Status in Strasburg
34.8% of women with births (115) in Strasburg are married. The highest percentage of unmarried women with births falls into 20 to 34 years age bracket with 100.0% of them unmarried at the time of birth, while the lowest percentage of unmarried women with births belong to 35 to 50 years age bracket with 59.2% of them unmarried.
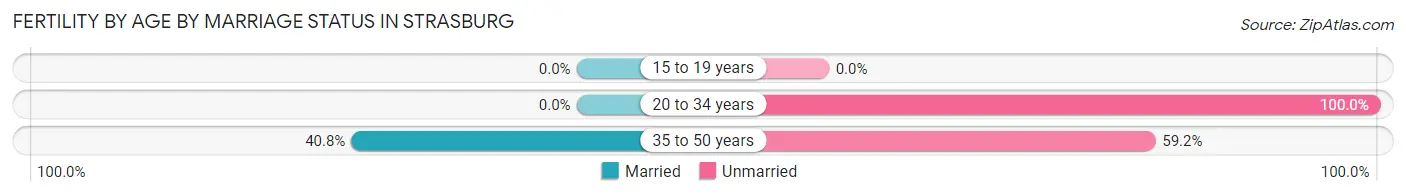
| Age Bracket | Married | Unmarried |
| 15 to 19 years | 0 (0.0%) | 0 (0.0%) |
| 20 to 34 years | 0 (0.0%) | 17 (100.0%) |
| 35 to 50 years | 40 (40.8%) | 58 (59.2%) |
| Total | 40 (34.8%) | 75 (65.2%) |
Fertility by Education in Strasburg
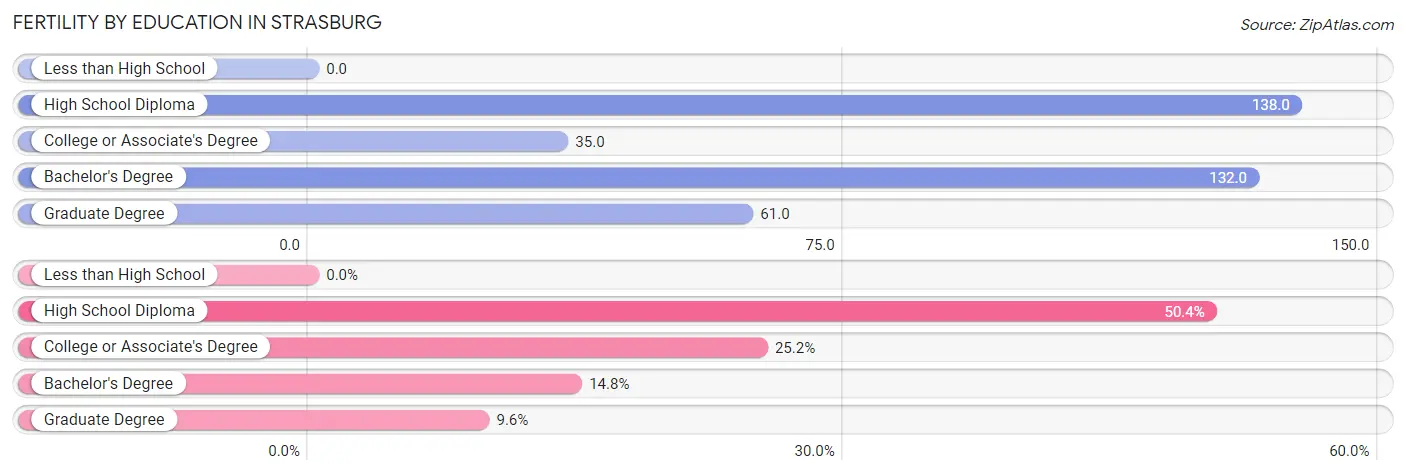
| Educational Attainment | Women with Births | Births / 1,000 Women |
| Less than High School | 0 (0.0%) | 0.0 |
| High School Diploma | 58 (50.4%) | 138.0 |
| College or Associate's Degree | 29 (25.2%) | 35.0 |
| Bachelor's Degree | 17 (14.8%) | 132.0 |
| Graduate Degree | 11 (9.6%) | 61.0 |
| Total | 115 (100.0%) | 58.0 |
Fertility by Education by Marriage Status in Strasburg
65.2% of women with births in Strasburg are unmarried. Women with the educational attainment of college or associate's degree are most likely to be married with 100.0% of them married at childbirth, while women with the educational attainment of high school diploma are least likely to be married with 100.0% of them unmarried at childbirth.
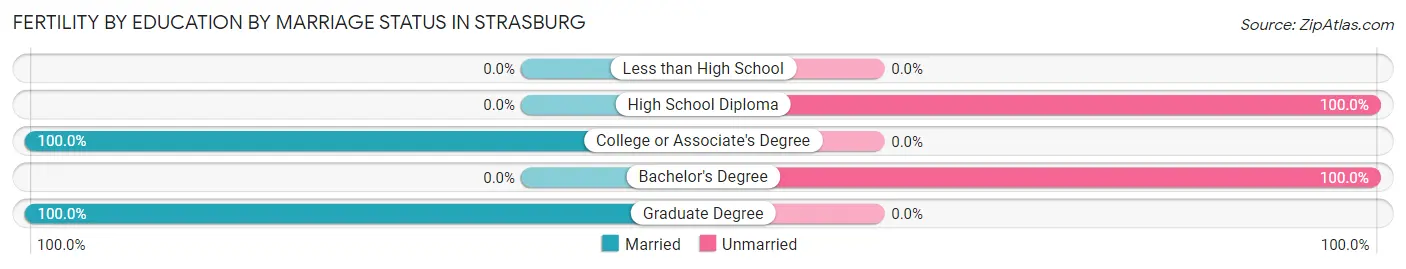
| Educational Attainment | Married | Unmarried |
| Less than High School | 0 (0.0%) | 0 (0.0%) |
| High School Diploma | 0 (0.0%) | 58 (100.0%) |
| College or Associate's Degree | 29 (100.0%) | 0 (0.0%) |
| Bachelor's Degree | 0 (0.0%) | 17 (100.0%) |
| Graduate Degree | 11 (100.0%) | 0 (0.0%) |
| Total | 40 (34.8%) | 75 (65.2%) |
Employment Characteristics in Strasburg
Employment by Class of Employer in Strasburg
Among the 3,280 employed individuals in Strasburg, private company employees (2,260 | 68.9%), not-for-profit organizations (283 | 8.6%), and state government employees (206 | 6.3%) make up the most common classes of employment.
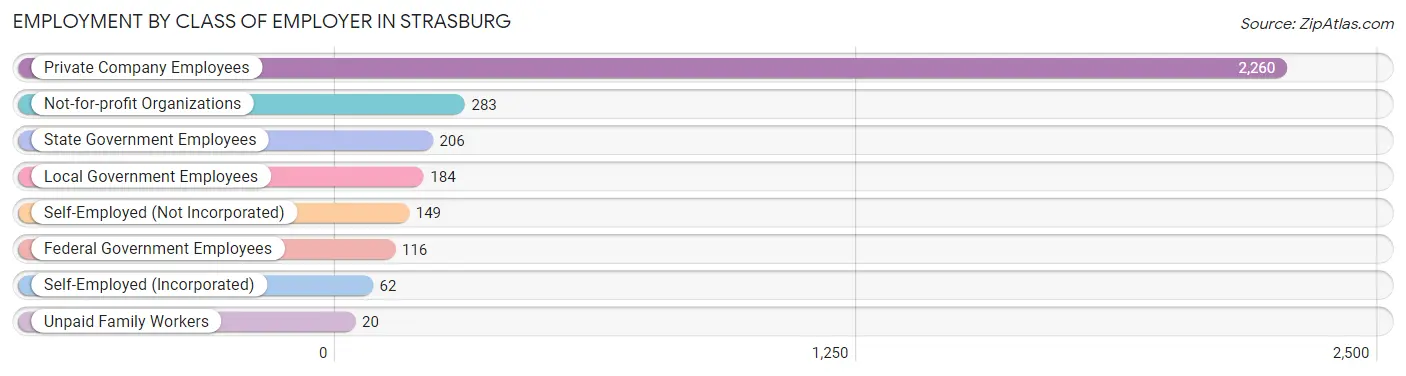
| Employer Class | # Employees | % Employees |
| Private Company Employees | 2,260 | 68.9% |
| Self-Employed (Incorporated) | 62 | 1.9% |
| Self-Employed (Not Incorporated) | 149 | 4.5% |
| Not-for-profit Organizations | 283 | 8.6% |
| Local Government Employees | 184 | 5.6% |
| State Government Employees | 206 | 6.3% |
| Federal Government Employees | 116 | 3.5% |
| Unpaid Family Workers | 20 | 0.6% |
| Total | 3,280 | 100.0% |
Employment Status by Age in Strasburg
According to the labor force statistics for Strasburg, out of the total population over 16 years of age (5,396), 63.8% or 3,443 individuals are in the labor force, with 3.9% or 134 of them unemployed. The age group with the highest labor force participation rate is 55 to 59 years, with 91.3% or 357 individuals in the labor force. Within the labor force, the 25 to 29 years age range has the highest percentage of unemployed individuals, with 23.1% or 71 of them being unemployed.
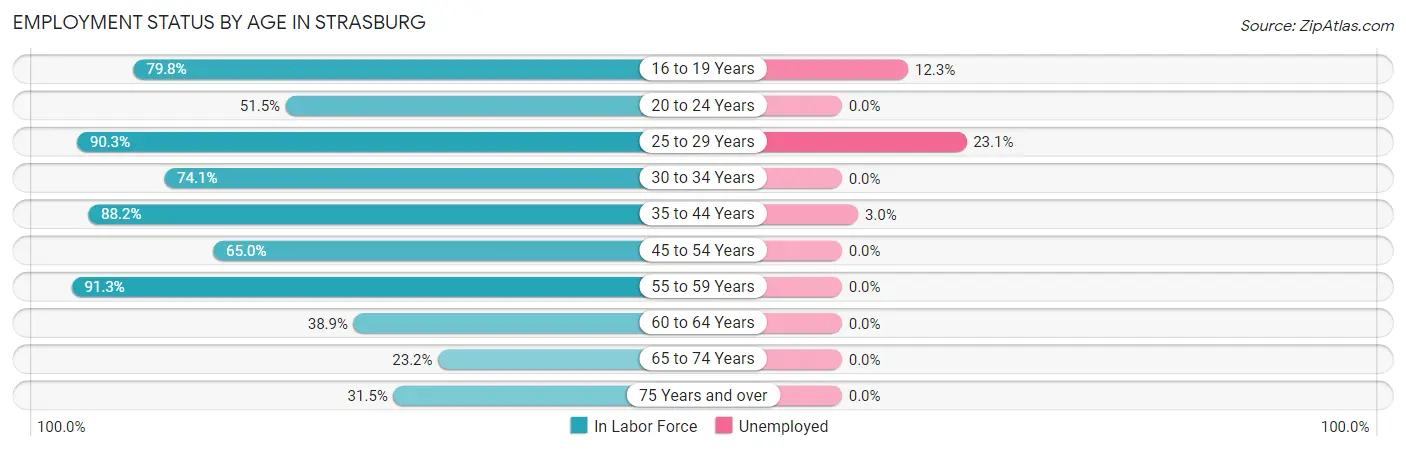
| Age Bracket | In Labor Force | Unemployed |
| 16 to 19 Years | 316 (79.8%) | 39 (12.3%) |
| 20 to 24 Years | 206 (51.5%) | 0 (0.0%) |
| 25 to 29 Years | 306 (90.3%) | 71 (23.1%) |
| 30 to 34 Years | 238 (74.1%) | 0 (0.0%) |
| 35 to 44 Years | 1,073 (88.2%) | 32 (3.0%) |
| 45 to 54 Years | 490 (65.0%) | 0 (0.0%) |
| 55 to 59 Years | 357 (91.3%) | 0 (0.0%) |
| 60 to 64 Years | 130 (38.9%) | 0 (0.0%) |
| 65 to 74 Years | 179 (23.2%) | 0 (0.0%) |
| 75 Years and over | 149 (31.5%) | 0 (0.0%) |
| Total | 3,443 (63.8%) | 134 (3.9%) |
Employment Status by Educational Attainment in Strasburg
According to labor force statistics for Strasburg, 77.3% of individuals (2,594) out of the total population between 25 and 64 years of age (3,356) are in the labor force, with 3.7% or 96 of them being unemployed. The group with the highest labor force participation rate are those with the educational attainment of bachelor's degree or higher, with 90.5% or 514 individuals in the labor force. Within the labor force, individuals with high school diploma education have the highest percentage of unemployment, with 7.9% or 79 of them being unemployed.
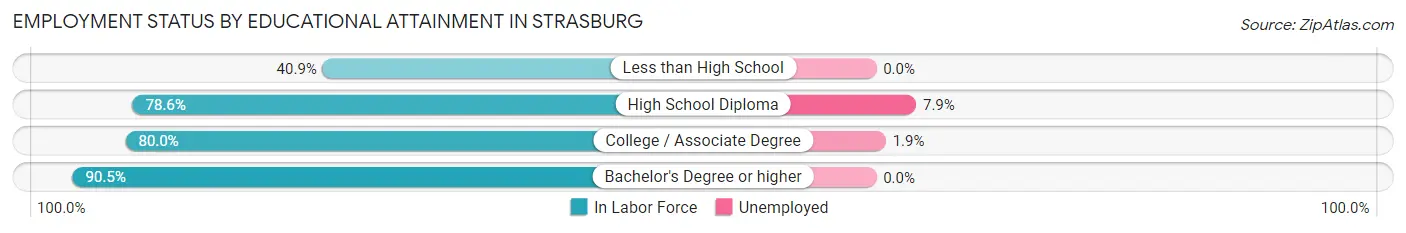
| Educational Attainment | In Labor Force | Unemployed |
| Less than High School | 139 (40.9%) | 0 (0.0%) |
| High School Diploma | 997 (78.6%) | 100 (7.9%) |
| College / Associate Degree | 944 (80.0%) | 22 (1.9%) |
| Bachelor's Degree or higher | 514 (90.5%) | 0 (0.0%) |
| Total | 2,594 (77.3%) | 124 (3.7%) |
Employment Occupations by Sex in Strasburg
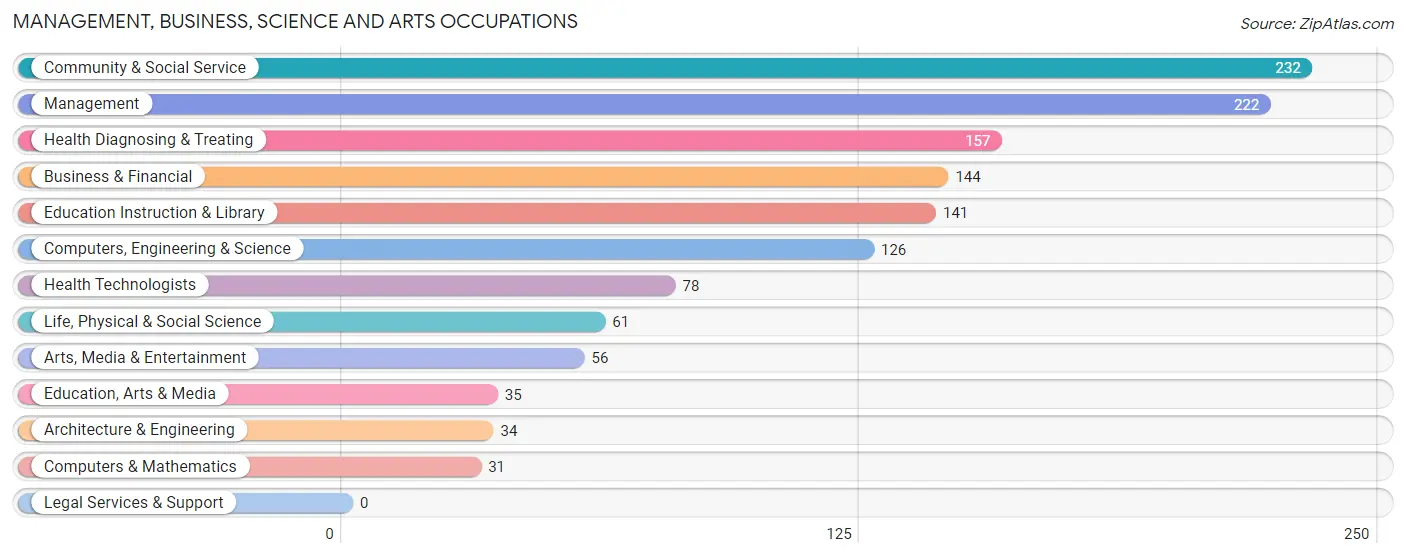
Management, Business, Science and Arts Occupations
The most common Management, Business, Science and Arts occupations in Strasburg are Community & Social Service (232 | 7.1%), Management (222 | 6.8%), Health Diagnosing & Treating (157 | 4.8%), Business & Financial (144 | 4.4%), and Education Instruction & Library (141 | 4.3%).
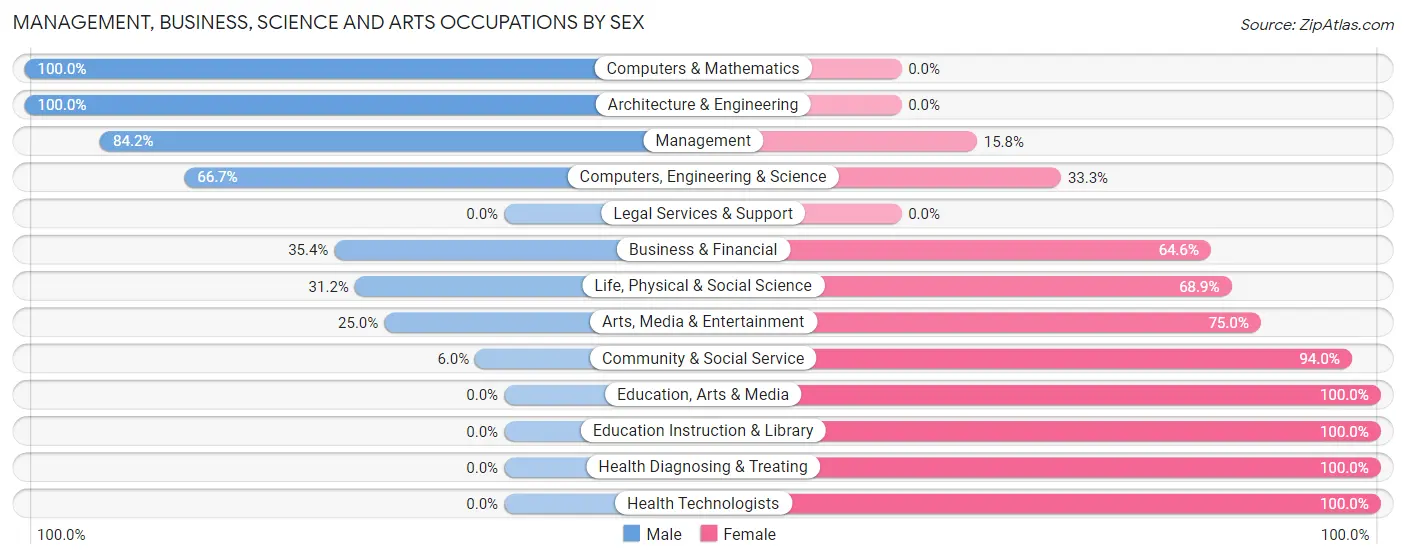
Management, Business, Science and Arts Occupations by Sex
Within the Management, Business, Science and Arts occupations in Strasburg, the most male-oriented occupations are Computers & Mathematics (100.0%), Architecture & Engineering (100.0%), and Management (84.2%), while the most female-oriented occupations are Education, Arts & Media (100.0%), Education Instruction & Library (100.0%), and Health Diagnosing & Treating (100.0%).
| Occupation | Male | Female |
| Management | 187 (84.2%) | 35 (15.8%) |
| Business & Financial | 51 (35.4%) | 93 (64.6%) |
| Computers, Engineering & Science | 84 (66.7%) | 42 (33.3%) |
| Computers & Mathematics | 31 (100.0%) | 0 (0.0%) |
| Architecture & Engineering | 34 (100.0%) | 0 (0.0%) |
| Life, Physical & Social Science | 19 (31.1%) | 42 (68.9%) |
| Community & Social Service | 14 (6.0%) | 218 (94.0%) |
| Education, Arts & Media | 0 (0.0%) | 35 (100.0%) |
| Legal Services & Support | 0 (0.0%) | 0 (0.0%) |
| Education Instruction & Library | 0 (0.0%) | 141 (100.0%) |
| Arts, Media & Entertainment | 14 (25.0%) | 42 (75.0%) |
| Health Diagnosing & Treating | 0 (0.0%) | 157 (100.0%) |
| Health Technologists | 0 (0.0%) | 78 (100.0%) |
| Total (Category) | 336 (38.1%) | 545 (61.9%) |
| Total (Overall) | 1,638 (50.0%) | 1,635 (49.9%) |
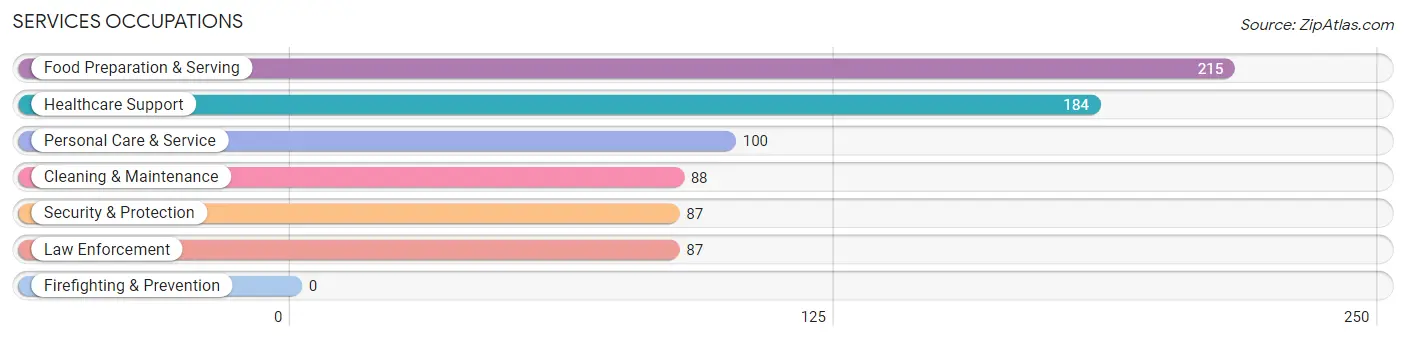
Services Occupations
The most common Services occupations in Strasburg are Food Preparation & Serving (215 | 6.6%), Healthcare Support (184 | 5.6%), Personal Care & Service (100 | 3.1%), Cleaning & Maintenance (88 | 2.7%), and Security & Protection (87 | 2.7%).
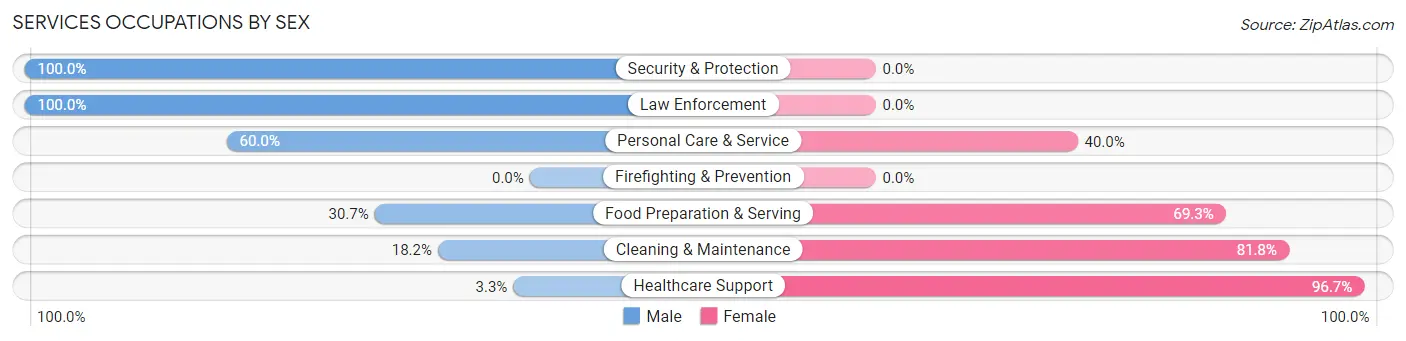
Services Occupations by Sex
Within the Services occupations in Strasburg, the most male-oriented occupations are Security & Protection (100.0%), Law Enforcement (100.0%), and Personal Care & Service (60.0%), while the most female-oriented occupations are Healthcare Support (96.7%), Cleaning & Maintenance (81.8%), and Food Preparation & Serving (69.3%).
| Occupation | Male | Female |
| Healthcare Support | 6 (3.3%) | 178 (96.7%) |
| Security & Protection | 87 (100.0%) | 0 (0.0%) |
| Firefighting & Prevention | 0 (0.0%) | 0 (0.0%) |
| Law Enforcement | 87 (100.0%) | 0 (0.0%) |
| Food Preparation & Serving | 66 (30.7%) | 149 (69.3%) |
| Cleaning & Maintenance | 16 (18.2%) | 72 (81.8%) |
| Personal Care & Service | 60 (60.0%) | 40 (40.0%) |
| Total (Category) | 235 (34.9%) | 439 (65.1%) |
| Total (Overall) | 1,638 (50.0%) | 1,635 (49.9%) |
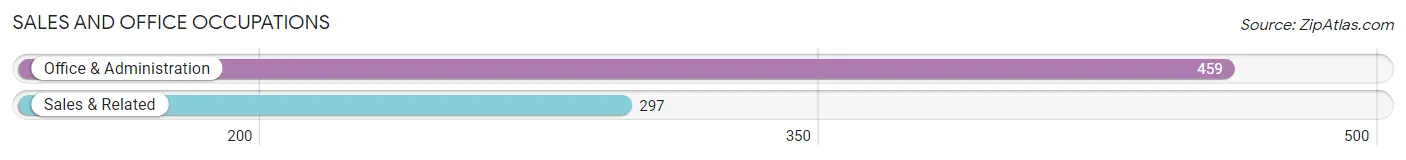
Sales and Office Occupations
The most common Sales and Office occupations in Strasburg are Office & Administration (459 | 14.0%), and Sales & Related (297 | 9.1%).
Sales and Office Occupations by Sex
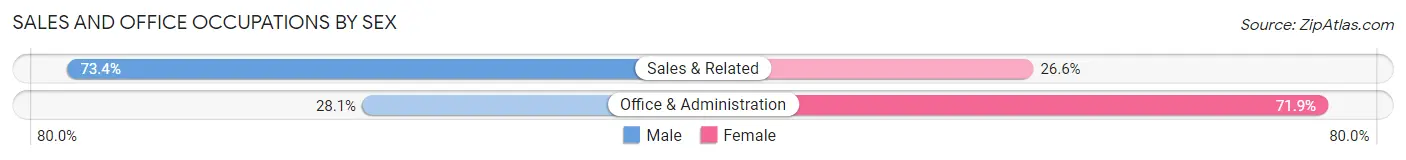
| Occupation | Male | Female |
| Sales & Related | 218 (73.4%) | 79 (26.6%) |
| Office & Administration | 129 (28.1%) | 330 (71.9%) |
| Total (Category) | 347 (45.9%) | 409 (54.1%) |
| Total (Overall) | 1,638 (50.0%) | 1,635 (49.9%) |
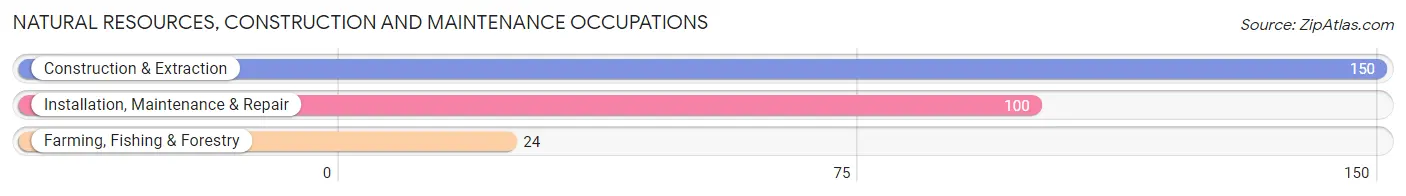
Natural Resources, Construction and Maintenance Occupations
The most common Natural Resources, Construction and Maintenance occupations in Strasburg are Construction & Extraction (150 | 4.6%), Installation, Maintenance & Repair (100 | 3.1%), and Farming, Fishing & Forestry (24 | 0.7%).
Natural Resources, Construction and Maintenance Occupations by Sex
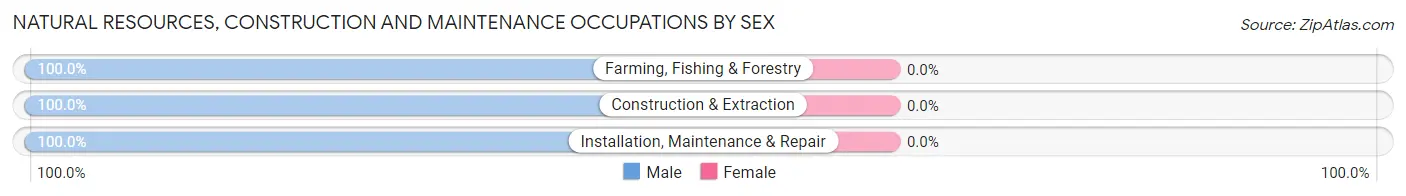
| Occupation | Male | Female |
| Farming, Fishing & Forestry | 24 (100.0%) | 0 (0.0%) |
| Construction & Extraction | 150 (100.0%) | 0 (0.0%) |
| Installation, Maintenance & Repair | 100 (100.0%) | 0 (0.0%) |
| Total (Category) | 274 (100.0%) | 0 (0.0%) |
| Total (Overall) | 1,638 (50.0%) | 1,635 (49.9%) |
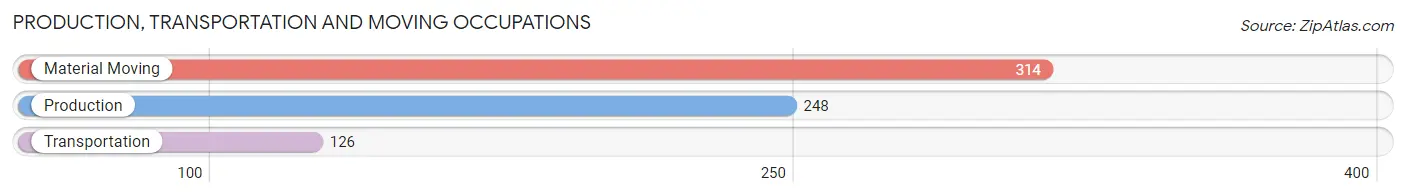
Production, Transportation and Moving Occupations
The most common Production, Transportation and Moving occupations in Strasburg are Material Moving (314 | 9.6%), Production (248 | 7.6%), and Transportation (126 | 3.8%).
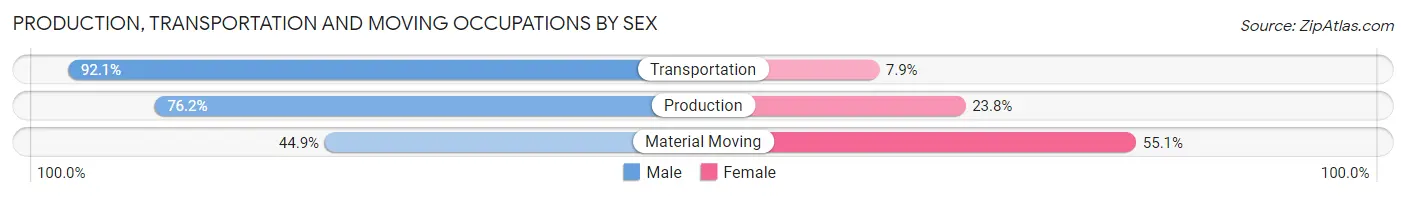
Production, Transportation and Moving Occupations by Sex
| Occupation | Male | Female |
| Production | 189 (76.2%) | 59 (23.8%) |
| Transportation | 116 (92.1%) | 10 (7.9%) |
| Material Moving | 141 (44.9%) | 173 (55.1%) |
| Total (Category) | 446 (64.8%) | 242 (35.2%) |
| Total (Overall) | 1,638 (50.0%) | 1,635 (49.9%) |
Employment Industries by Sex in Strasburg
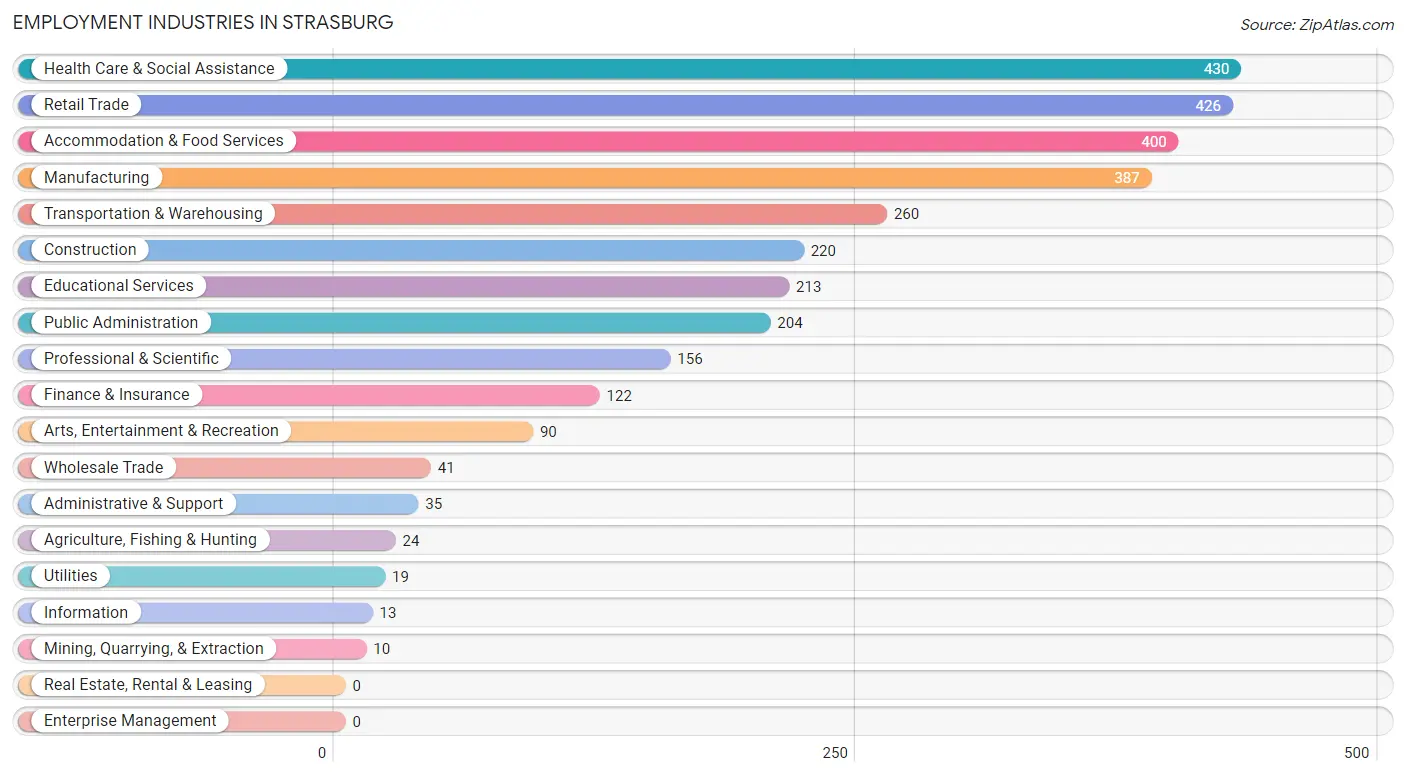
Employment Industries in Strasburg
The major employment industries in Strasburg include Health Care & Social Assistance (430 | 13.1%), Retail Trade (426 | 13.0%), Accommodation & Food Services (400 | 12.2%), Manufacturing (387 | 11.8%), and Transportation & Warehousing (260 | 7.9%).
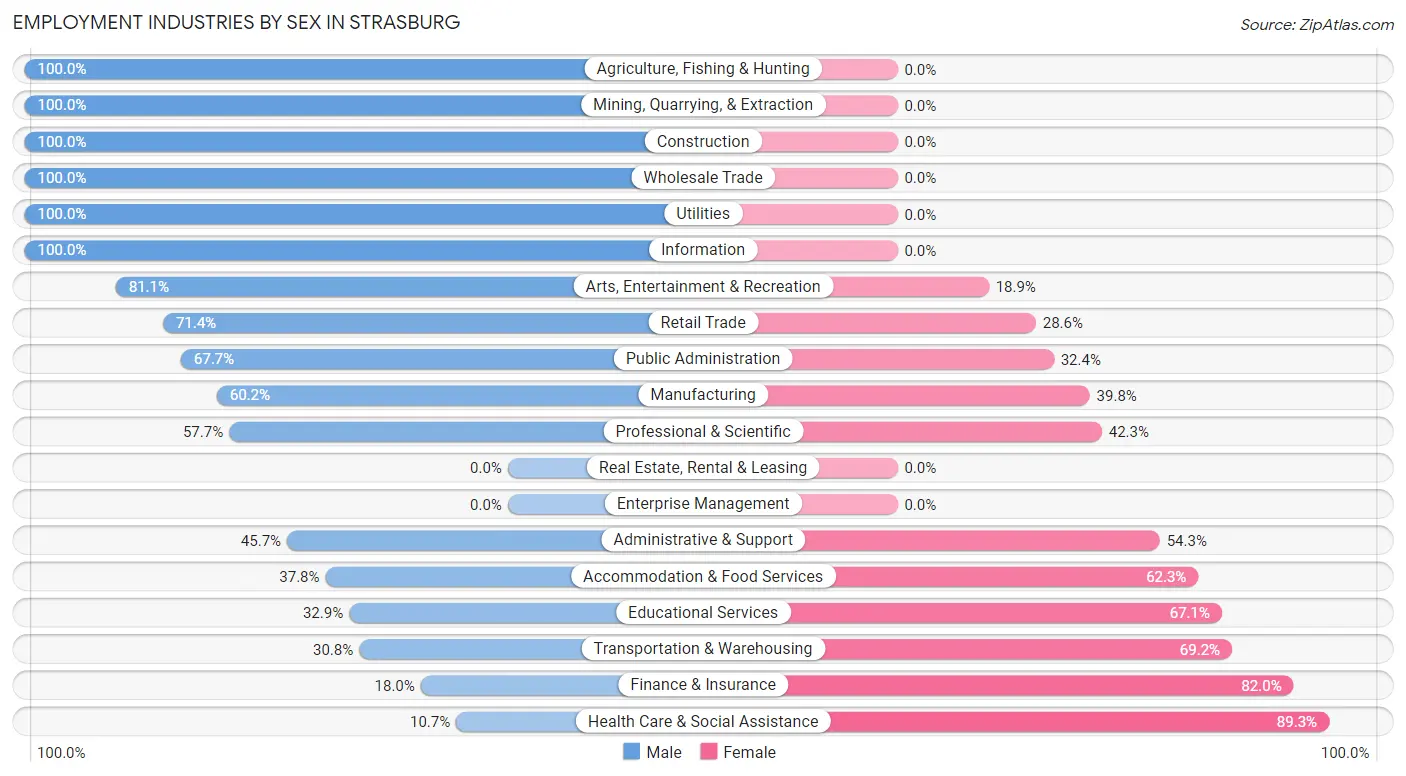
Employment Industries by Sex in Strasburg
The Strasburg industries that see more men than women are Agriculture, Fishing & Hunting (100.0%), Mining, Quarrying, & Extraction (100.0%), and Construction (100.0%), whereas the industries that tend to have a higher number of women are Health Care & Social Assistance (89.3%), Finance & Insurance (82.0%), and Transportation & Warehousing (69.2%).
| Industry | Male | Female |
| Agriculture, Fishing & Hunting | 24 (100.0%) | 0 (0.0%) |
| Mining, Quarrying, & Extraction | 10 (100.0%) | 0 (0.0%) |
| Construction | 220 (100.0%) | 0 (0.0%) |
| Manufacturing | 233 (60.2%) | 154 (39.8%) |
| Wholesale Trade | 41 (100.0%) | 0 (0.0%) |
| Retail Trade | 304 (71.4%) | 122 (28.6%) |
| Transportation & Warehousing | 80 (30.8%) | 180 (69.2%) |
| Utilities | 19 (100.0%) | 0 (0.0%) |
| Information | 13 (100.0%) | 0 (0.0%) |
| Finance & Insurance | 22 (18.0%) | 100 (82.0%) |
| Real Estate, Rental & Leasing | 0 (0.0%) | 0 (0.0%) |
| Professional & Scientific | 90 (57.7%) | 66 (42.3%) |
| Enterprise Management | 0 (0.0%) | 0 (0.0%) |
| Administrative & Support | 16 (45.7%) | 19 (54.3%) |
| Educational Services | 70 (32.9%) | 143 (67.1%) |
| Health Care & Social Assistance | 46 (10.7%) | 384 (89.3%) |
| Arts, Entertainment & Recreation | 73 (81.1%) | 17 (18.9%) |
| Accommodation & Food Services | 151 (37.8%) | 249 (62.3%) |
| Public Administration | 138 (67.6%) | 66 (32.4%) |
| Total | 1,638 (50.0%) | 1,635 (49.9%) |
Education in Strasburg
School Enrollment in Strasburg
The most common levels of schooling among the 1,819 students in Strasburg are high school (436 | 24.0%), college / undergraduate (426 | 23.4%), and elementary school (314 | 17.3%).
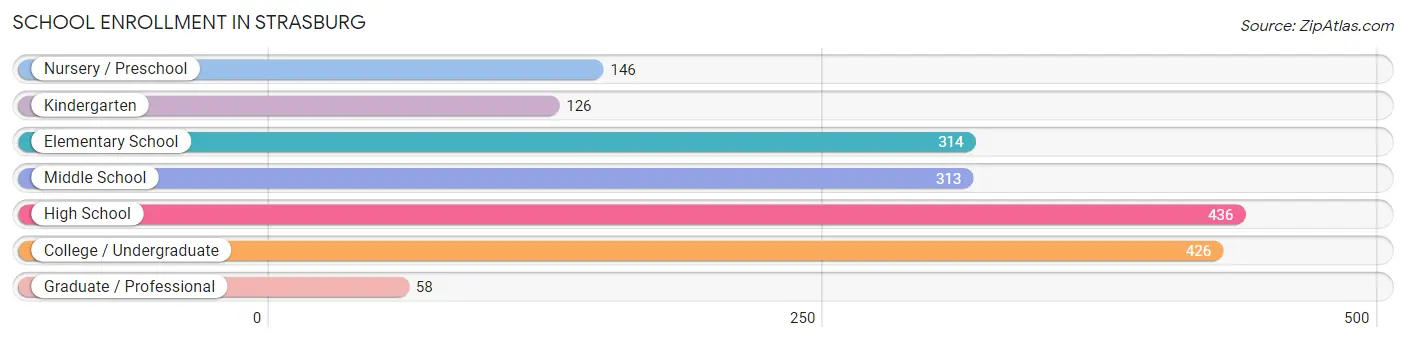
| School Level | # Students | % Students |
| Nursery / Preschool | 146 | 8.0% |
| Kindergarten | 126 | 6.9% |
| Elementary School | 314 | 17.3% |
| Middle School | 313 | 17.2% |
| High School | 436 | 24.0% |
| College / Undergraduate | 426 | 23.4% |
| Graduate / Professional | 58 | 3.2% |
| Total | 1,819 | 100.0% |
School Enrollment by Age by Funding Source in Strasburg
Out of a total of 1,819 students who are enrolled in schools in Strasburg, 568 (31.2%) attend a private institution, while the remaining 1,251 (68.8%) are enrolled in public schools. The age group of 35 years and over has the highest likelihood of being enrolled in private schools, with 207 (77.5% in the age bracket) enrolled. Conversely, the age group of 18 to 19 year olds has the lowest likelihood of being enrolled in a private school, with 98 (100.0% in the age bracket) attending a public institution.

| Age Bracket | Public School | Private School |
| 3 to 4 Year Olds | 57 (46.3%) | 66 (53.7%) |
| 5 to 9 Year Old | 254 (59.6%) | 172 (40.4%) |
| 10 to 14 Year Olds | 331 (75.2%) | 109 (24.8%) |
| 15 to 17 Year Olds | 342 (96.1%) | 14 (3.9%) |
| 18 to 19 Year Olds | 98 (100.0%) | 0 (0.0%) |
| 20 to 24 Year Olds | 86 (100.0%) | 0 (0.0%) |
| 25 to 34 Year Olds | 23 (100.0%) | 0 (0.0%) |
| 35 Years and over | 60 (22.5%) | 207 (77.5%) |
| Total | 1,251 (68.8%) | 568 (31.2%) |
Educational Attainment by Field of Study in Strasburg
Engineering (153 | 18.9%), business (77 | 9.5%), psychology (74 | 9.1%), visual & performing arts (72 | 8.9%), and education (68 | 8.4%) are the most common fields of study among 811 individuals in Strasburg who have obtained a bachelor's degree or higher.
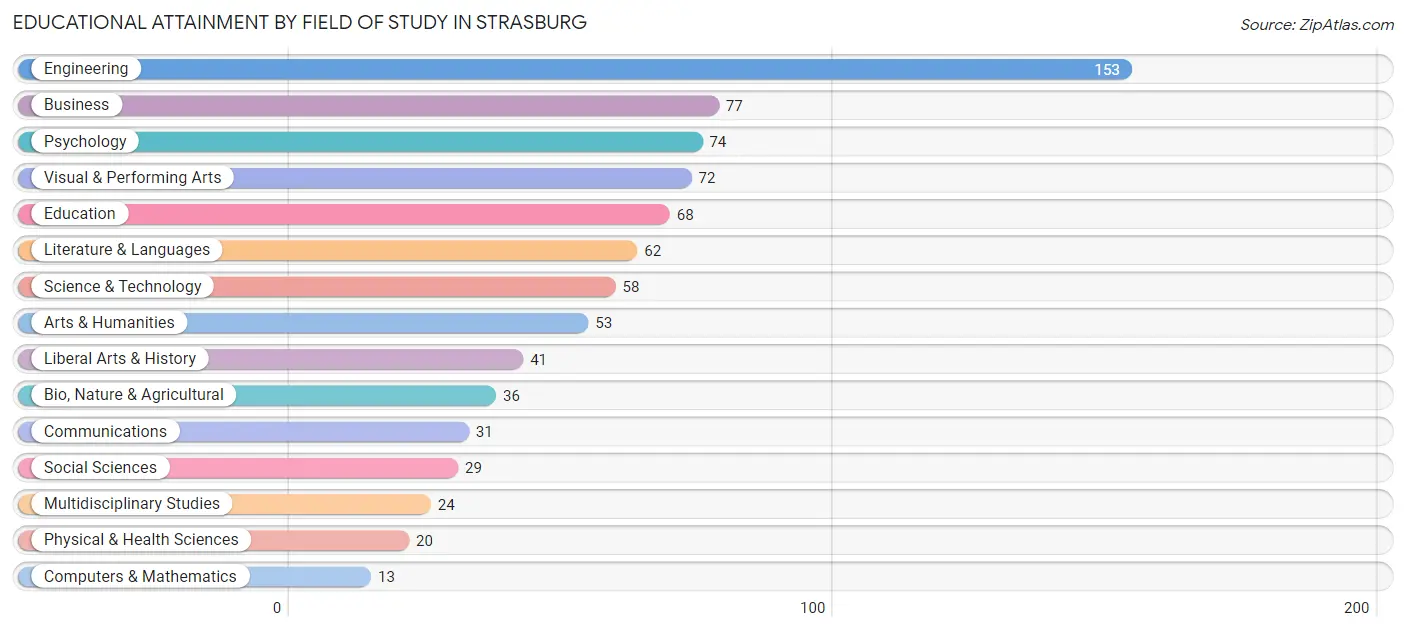
| Field of Study | # Graduates | % Graduates |
| Computers & Mathematics | 13 | 1.6% |
| Bio, Nature & Agricultural | 36 | 4.4% |
| Physical & Health Sciences | 20 | 2.5% |
| Psychology | 74 | 9.1% |
| Social Sciences | 29 | 3.6% |
| Engineering | 153 | 18.9% |
| Multidisciplinary Studies | 24 | 3.0% |
| Science & Technology | 58 | 7.1% |
| Business | 77 | 9.5% |
| Education | 68 | 8.4% |
| Literature & Languages | 62 | 7.6% |
| Liberal Arts & History | 41 | 5.1% |
| Visual & Performing Arts | 72 | 8.9% |
| Communications | 31 | 3.8% |
| Arts & Humanities | 53 | 6.5% |
| Total | 811 | 100.0% |
Transportation & Commute in Strasburg
Vehicle Availability by Sex in Strasburg
The most prevalent vehicle ownership categories in Strasburg are males with 2 vehicles (681, accounting for 41.1%) and females with 2 vehicles (879, making up 41.9%).
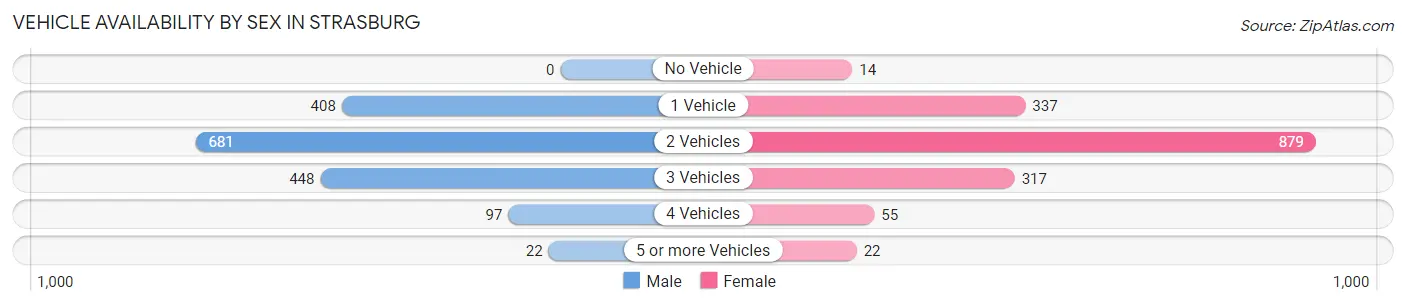
| Vehicles Available | Male | Female |
| No Vehicle | 0 (0.0%) | 14 (0.9%) |
| 1 Vehicle | 408 (24.6%) | 337 (20.7%) |
| 2 Vehicles | 681 (41.1%) | 879 (54.1%) |
| 3 Vehicles | 448 (27.1%) | 317 (19.5%) |
| 4 Vehicles | 97 (5.9%) | 55 (3.4%) |
| 5 or more Vehicles | 22 (1.3%) | 22 (1.3%) |
| Total | 1,656 (100.0%) | 1,624 (100.0%) |
Commute Time in Strasburg
The most frequently occuring commute durations in Strasburg are 15 to 19 minutes (546 commuters, 17.5%), 25 to 29 minutes (508 commuters, 16.3%), and 20 to 24 minutes (365 commuters, 11.7%).
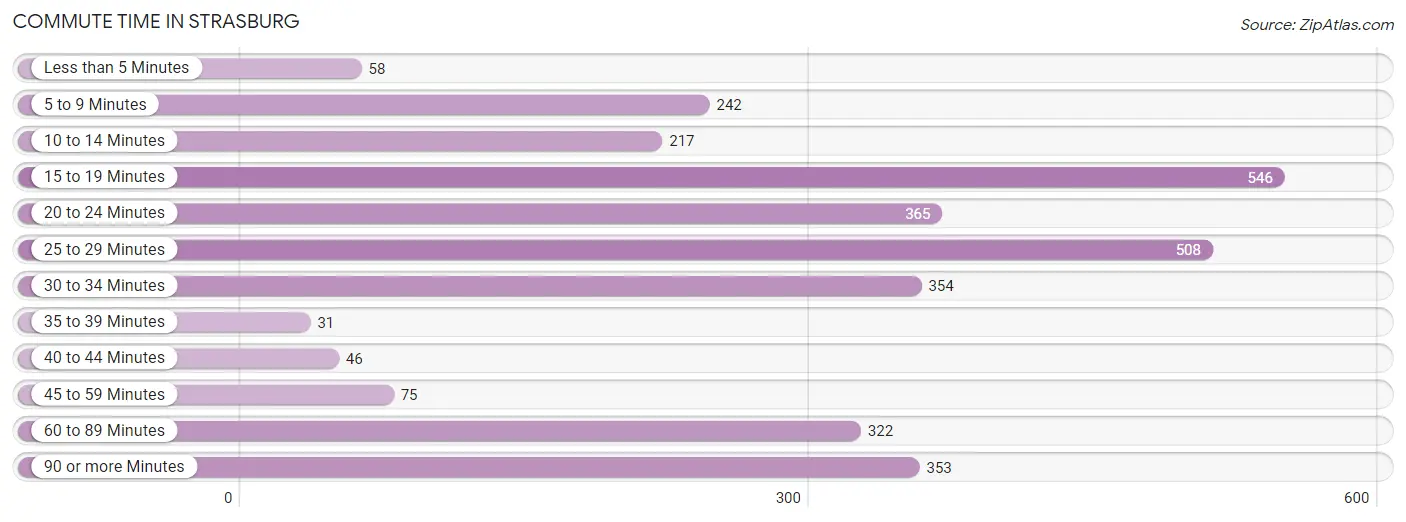
| Commute Time | # Commuters | % Commuters |
| Less than 5 Minutes | 58 | 1.9% |
| 5 to 9 Minutes | 242 | 7.8% |
| 10 to 14 Minutes | 217 | 7.0% |
| 15 to 19 Minutes | 546 | 17.5% |
| 20 to 24 Minutes | 365 | 11.7% |
| 25 to 29 Minutes | 508 | 16.3% |
| 30 to 34 Minutes | 354 | 11.4% |
| 35 to 39 Minutes | 31 | 1.0% |
| 40 to 44 Minutes | 46 | 1.5% |
| 45 to 59 Minutes | 75 | 2.4% |
| 60 to 89 Minutes | 322 | 10.3% |
| 90 or more Minutes | 353 | 11.3% |
Commute Time by Sex in Strasburg
The most common commute times in Strasburg are 90 or more minutes (269 commuters, 16.4%) for males and 15 to 19 minutes (318 commuters, 21.6%) for females.
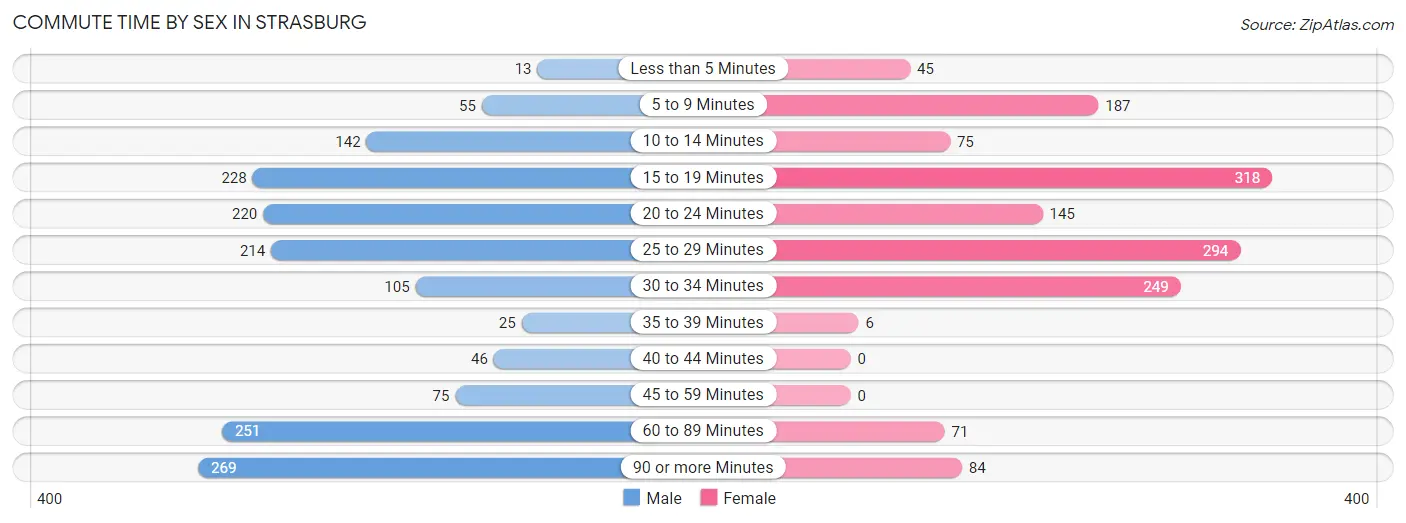
| Commute Time | Male | Female |
| Less than 5 Minutes | 13 (0.8%) | 45 (3.0%) |
| 5 to 9 Minutes | 55 (3.4%) | 187 (12.7%) |
| 10 to 14 Minutes | 142 (8.6%) | 75 (5.1%) |
| 15 to 19 Minutes | 228 (13.9%) | 318 (21.6%) |
| 20 to 24 Minutes | 220 (13.4%) | 145 (9.8%) |
| 25 to 29 Minutes | 214 (13.0%) | 294 (20.0%) |
| 30 to 34 Minutes | 105 (6.4%) | 249 (16.9%) |
| 35 to 39 Minutes | 25 (1.5%) | 6 (0.4%) |
| 40 to 44 Minutes | 46 (2.8%) | 0 (0.0%) |
| 45 to 59 Minutes | 75 (4.6%) | 0 (0.0%) |
| 60 to 89 Minutes | 251 (15.3%) | 71 (4.8%) |
| 90 or more Minutes | 269 (16.4%) | 84 (5.7%) |
Time of Departure to Work by Sex in Strasburg
The most frequent times of departure to work in Strasburg are 4:00 PM to 11:59 PM (234, 14.2%) for males and 4:00 PM to 11:59 PM (434, 29.4%) for females.
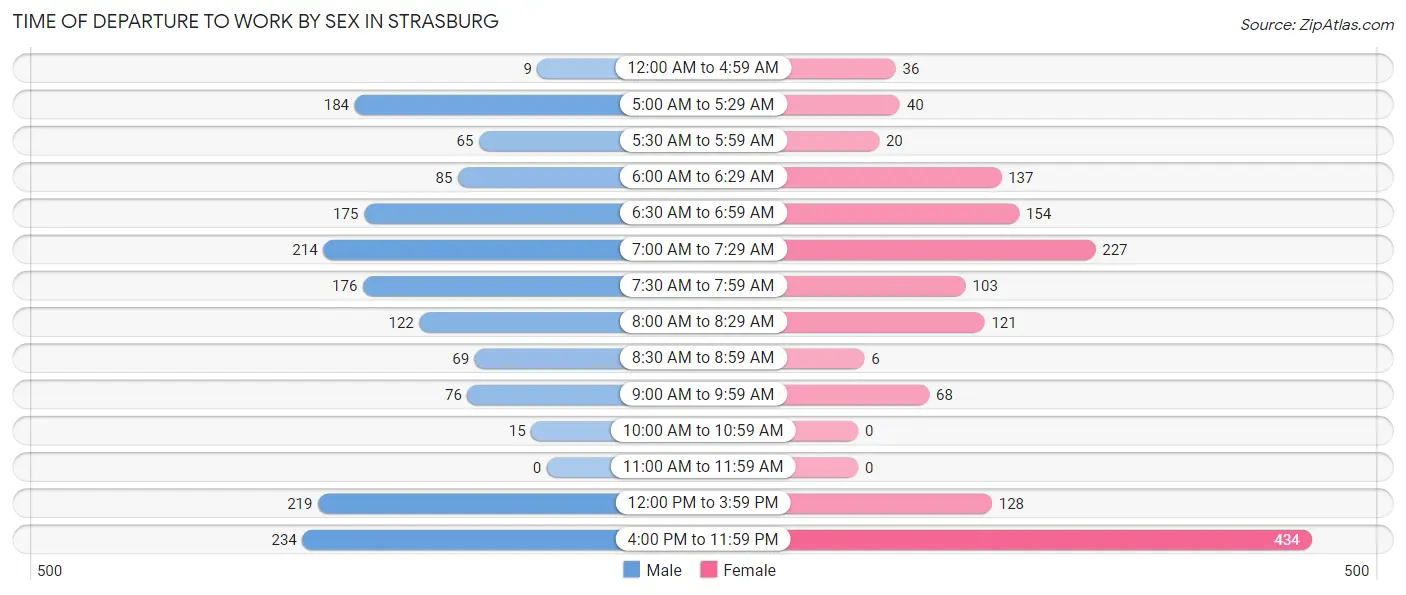
| Time of Departure | Male | Female |
| 12:00 AM to 4:59 AM | 9 (0.5%) | 36 (2.4%) |
| 5:00 AM to 5:29 AM | 184 (11.2%) | 40 (2.7%) |
| 5:30 AM to 5:59 AM | 65 (4.0%) | 20 (1.4%) |
| 6:00 AM to 6:29 AM | 85 (5.2%) | 137 (9.3%) |
| 6:30 AM to 6:59 AM | 175 (10.6%) | 154 (10.4%) |
| 7:00 AM to 7:29 AM | 214 (13.0%) | 227 (15.4%) |
| 7:30 AM to 7:59 AM | 176 (10.7%) | 103 (7.0%) |
| 8:00 AM to 8:29 AM | 122 (7.4%) | 121 (8.2%) |
| 8:30 AM to 8:59 AM | 69 (4.2%) | 6 (0.4%) |
| 9:00 AM to 9:59 AM | 76 (4.6%) | 68 (4.6%) |
| 10:00 AM to 10:59 AM | 15 (0.9%) | 0 (0.0%) |
| 11:00 AM to 11:59 AM | 0 (0.0%) | 0 (0.0%) |
| 12:00 PM to 3:59 PM | 219 (13.3%) | 128 (8.7%) |
| 4:00 PM to 11:59 PM | 234 (14.2%) | 434 (29.4%) |
| Total | 1,643 (100.0%) | 1,474 (100.0%) |
Housing Occupancy in Strasburg
Occupancy by Ownership in Strasburg
Of the total 2,965 dwellings in Strasburg, owner-occupied units account for 2,070 (69.8%), while renter-occupied units make up 895 (30.2%).
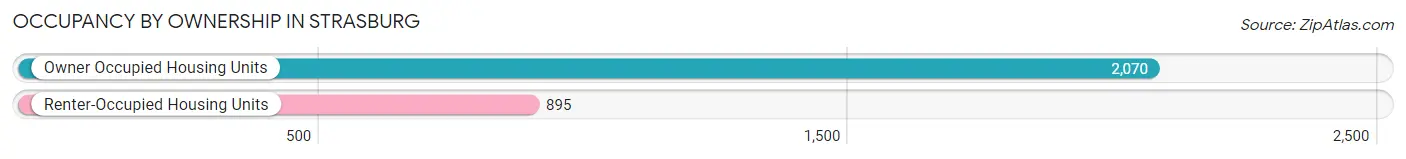
| Occupancy | # Housing Units | % Housing Units |
| Owner Occupied Housing Units | 2,070 | 69.8% |
| Renter-Occupied Housing Units | 895 | 30.2% |
| Total Occupied Housing Units | 2,965 | 100.0% |
Occupancy by Household Size in Strasburg
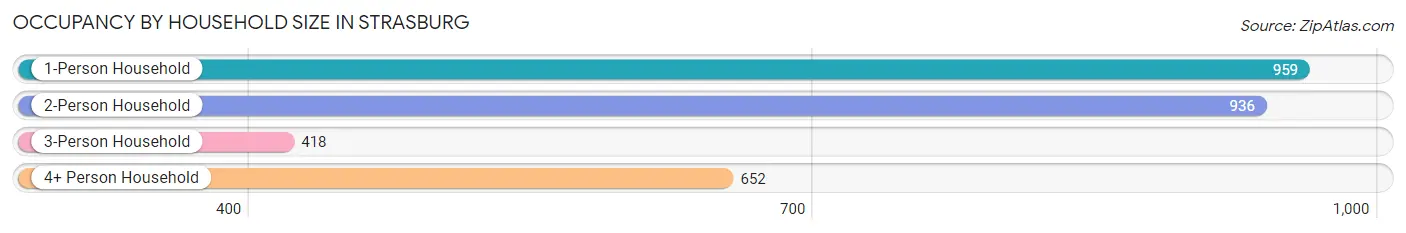
| Household Size | # Housing Units | % Housing Units |
| 1-Person Household | 959 | 32.3% |
| 2-Person Household | 936 | 31.6% |
| 3-Person Household | 418 | 14.1% |
| 4+ Person Household | 652 | 22.0% |
| Total Housing Units | 2,965 | 100.0% |
Occupancy by Ownership by Household Size in Strasburg
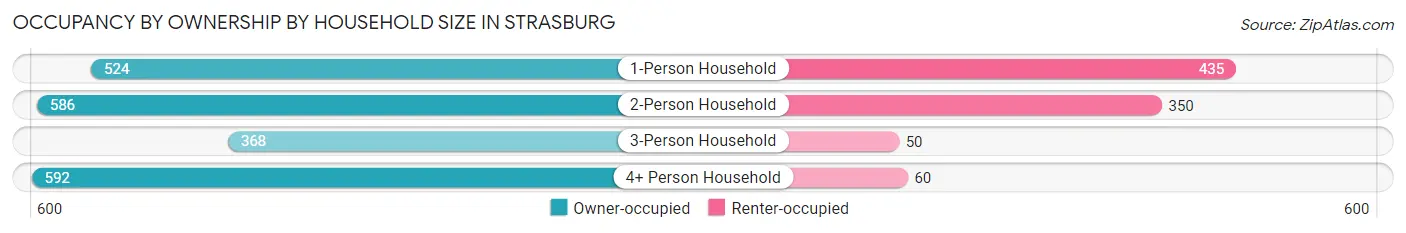
| Household Size | Owner-occupied | Renter-occupied |
| 1-Person Household | 524 (54.6%) | 435 (45.4%) |
| 2-Person Household | 586 (62.6%) | 350 (37.4%) |
| 3-Person Household | 368 (88.0%) | 50 (12.0%) |
| 4+ Person Household | 592 (90.8%) | 60 (9.2%) |
| Total Housing Units | 2,070 (69.8%) | 895 (30.2%) |
Occupancy by Educational Attainment in Strasburg
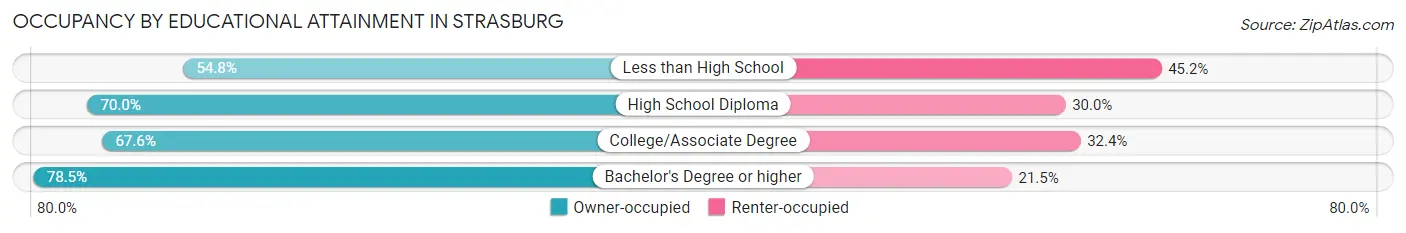
| Household Size | Owner-occupied | Renter-occupied |
| Less than High School | 80 (54.8%) | 66 (45.2%) |
| High School Diploma | 703 (70.0%) | 301 (30.0%) |
| College/Associate Degree | 859 (67.6%) | 411 (32.4%) |
| Bachelor's Degree or higher | 428 (78.5%) | 117 (21.5%) |
Occupancy by Age of Householder in Strasburg
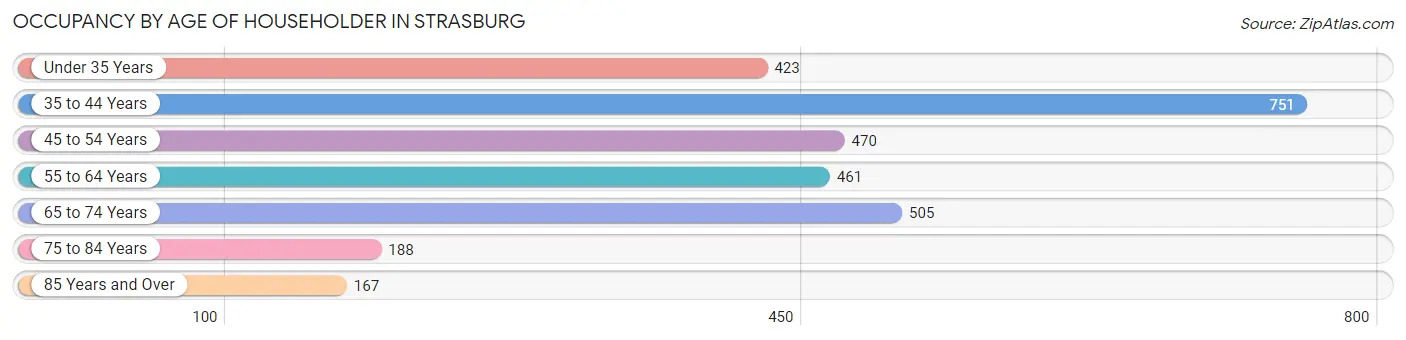
| Age Bracket | # Households | % Households |
| Under 35 Years | 423 | 14.3% |
| 35 to 44 Years | 751 | 25.3% |
| 45 to 54 Years | 470 | 15.9% |
| 55 to 64 Years | 461 | 15.5% |
| 65 to 74 Years | 505 | 17.0% |
| 75 to 84 Years | 188 | 6.3% |
| 85 Years and Over | 167 | 5.6% |
| Total | 2,965 | 100.0% |
Housing Finances in Strasburg
Median Income by Occupancy in Strasburg
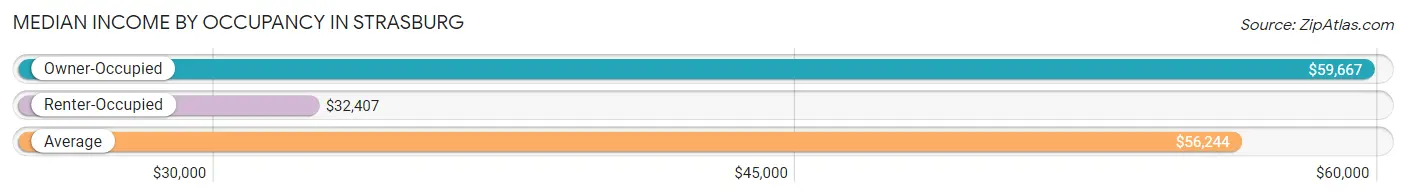
| Occupancy Type | # Households | Median Income |
| Owner-Occupied | 2,070 (69.8%) | $59,667 |
| Renter-Occupied | 895 (30.2%) | $32,407 |
| Average | 2,965 (100.0%) | $56,244 |
Occupancy by Householder Income Bracket in Strasburg
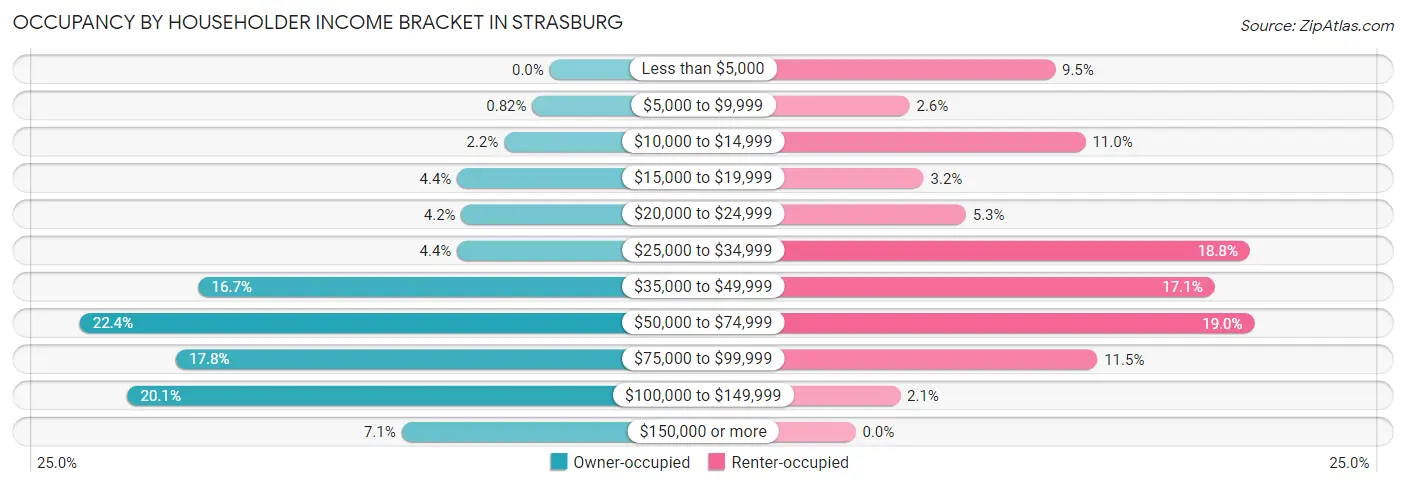
| Income Bracket | Owner-occupied | Renter-occupied |
| Less than $5,000 | 0 (0.0%) | 85 (9.5%) |
| $5,000 to $9,999 | 17 (0.8%) | 23 (2.6%) |
| $10,000 to $14,999 | 45 (2.2%) | 98 (11.0%) |
| $15,000 to $19,999 | 91 (4.4%) | 29 (3.2%) |
| $20,000 to $24,999 | 87 (4.2%) | 47 (5.2%) |
| $25,000 to $34,999 | 91 (4.4%) | 168 (18.8%) |
| $35,000 to $49,999 | 346 (16.7%) | 153 (17.1%) |
| $50,000 to $74,999 | 463 (22.4%) | 170 (19.0%) |
| $75,000 to $99,999 | 368 (17.8%) | 103 (11.5%) |
| $100,000 to $149,999 | 416 (20.1%) | 19 (2.1%) |
| $150,000 or more | 146 (7.0%) | 0 (0.0%) |
| Total | 2,070 (100.0%) | 895 (100.0%) |
Monthly Housing Cost Tiers in Strasburg
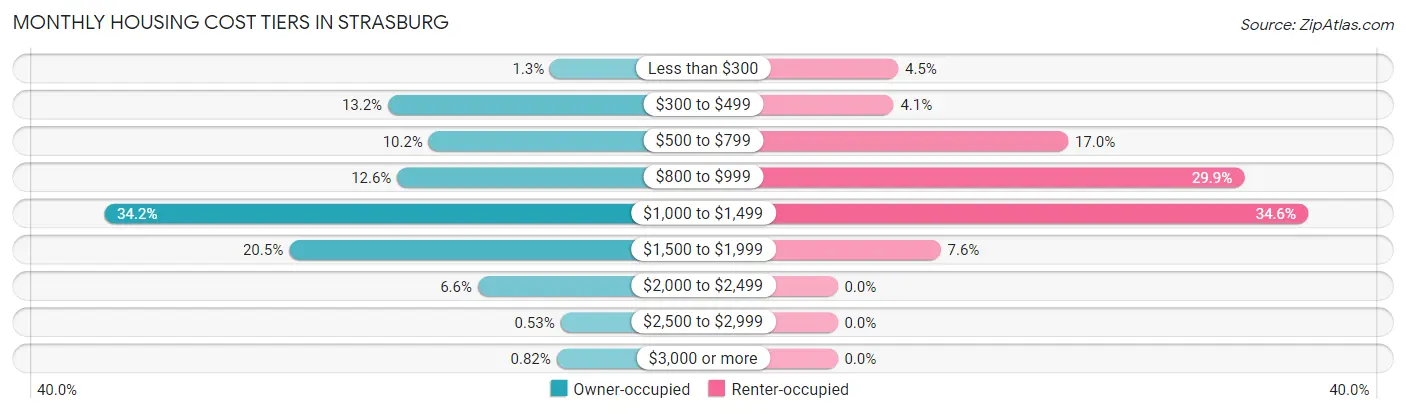
| Monthly Cost | Owner-occupied | Renter-occupied |
| Less than $300 | 27 (1.3%) | 40 (4.5%) |
| $300 to $499 | 274 (13.2%) | 37 (4.1%) |
| $500 to $799 | 212 (10.2%) | 152 (17.0%) |
| $800 to $999 | 260 (12.6%) | 268 (29.9%) |
| $1,000 to $1,499 | 707 (34.2%) | 310 (34.6%) |
| $1,500 to $1,999 | 425 (20.5%) | 68 (7.6%) |
| $2,000 to $2,499 | 137 (6.6%) | 0 (0.0%) |
| $2,500 to $2,999 | 11 (0.5%) | 0 (0.0%) |
| $3,000 or more | 17 (0.8%) | 0 (0.0%) |
| Total | 2,070 (100.0%) | 895 (100.0%) |
Physical Housing Characteristics in Strasburg
Housing Structures in Strasburg
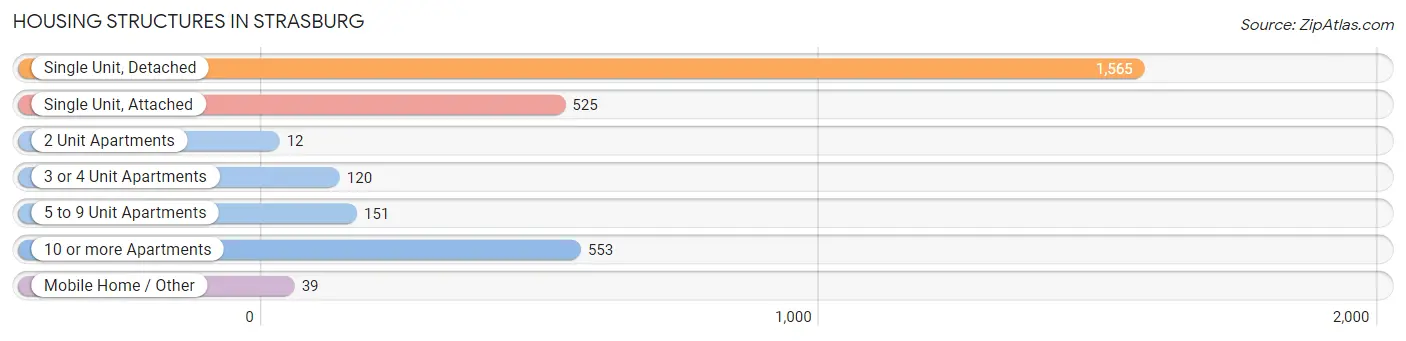
| Structure Type | # Housing Units | % Housing Units |
| Single Unit, Detached | 1,565 | 52.8% |
| Single Unit, Attached | 525 | 17.7% |
| 2 Unit Apartments | 12 | 0.4% |
| 3 or 4 Unit Apartments | 120 | 4.1% |
| 5 to 9 Unit Apartments | 151 | 5.1% |
| 10 or more Apartments | 553 | 18.6% |
| Mobile Home / Other | 39 | 1.3% |
| Total | 2,965 | 100.0% |
Housing Structures by Occupancy in Strasburg
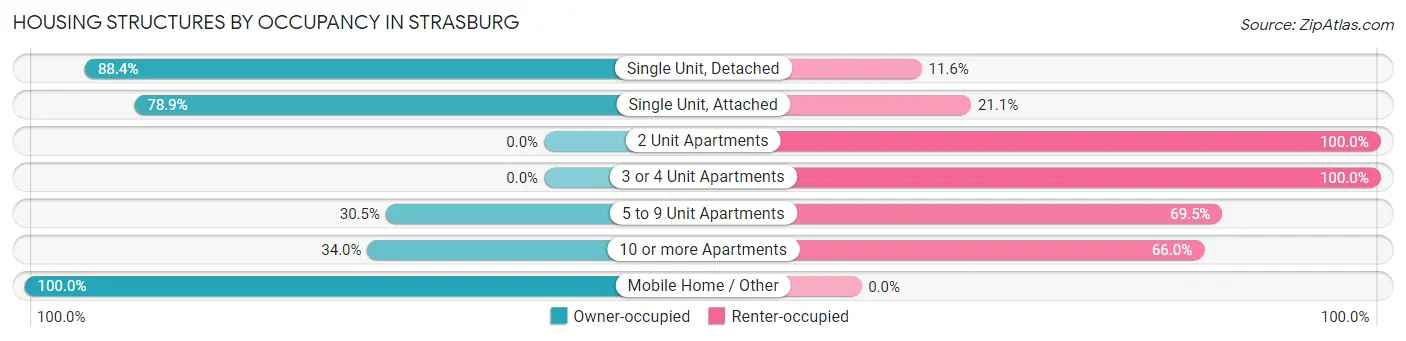
| Structure Type | Owner-occupied | Renter-occupied |
| Single Unit, Detached | 1,383 (88.4%) | 182 (11.6%) |
| Single Unit, Attached | 414 (78.9%) | 111 (21.1%) |
| 2 Unit Apartments | 0 (0.0%) | 12 (100.0%) |
| 3 or 4 Unit Apartments | 0 (0.0%) | 120 (100.0%) |
| 5 to 9 Unit Apartments | 46 (30.5%) | 105 (69.5%) |
| 10 or more Apartments | 188 (34.0%) | 365 (66.0%) |
| Mobile Home / Other | 39 (100.0%) | 0 (0.0%) |
| Total | 2,070 (69.8%) | 895 (30.2%) |
Housing Structures by Number of Rooms in Strasburg
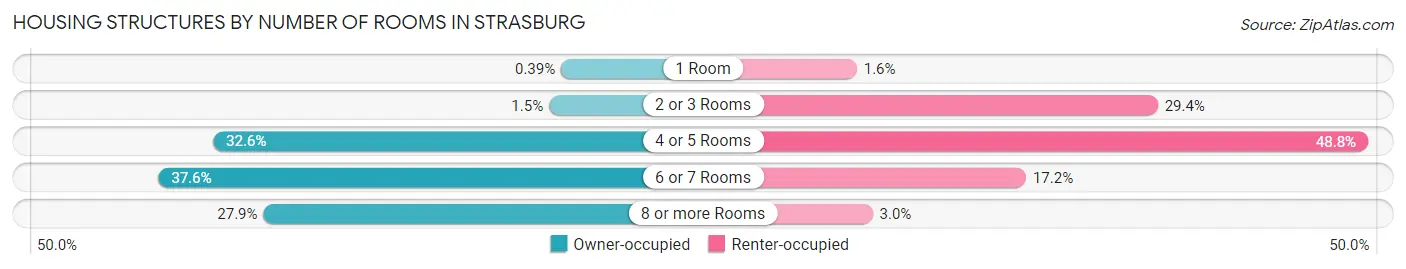
| Number of Rooms | Owner-occupied | Renter-occupied |
| 1 Room | 8 (0.4%) | 14 (1.6%) |
| 2 or 3 Rooms | 31 (1.5%) | 263 (29.4%) |
| 4 or 5 Rooms | 674 (32.6%) | 437 (48.8%) |
| 6 or 7 Rooms | 779 (37.6%) | 154 (17.2%) |
| 8 or more Rooms | 578 (27.9%) | 27 (3.0%) |
| Total | 2,070 (100.0%) | 895 (100.0%) |
Housing Structure by Heating Type in Strasburg
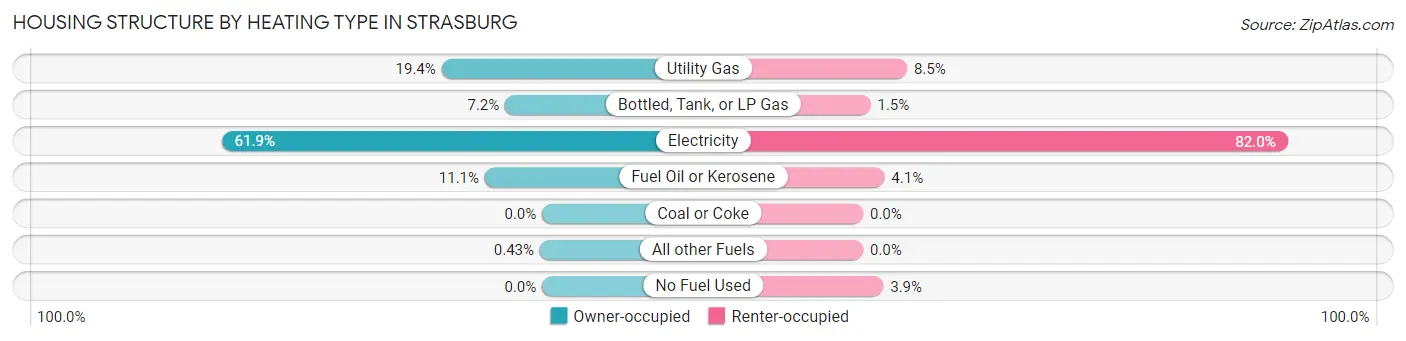
| Heating Type | Owner-occupied | Renter-occupied |
| Utility Gas | 402 (19.4%) | 76 (8.5%) |
| Bottled, Tank, or LP Gas | 148 (7.1%) | 13 (1.5%) |
| Electricity | 1,282 (61.9%) | 734 (82.0%) |
| Fuel Oil or Kerosene | 229 (11.1%) | 37 (4.1%) |
| Coal or Coke | 0 (0.0%) | 0 (0.0%) |
| All other Fuels | 9 (0.4%) | 0 (0.0%) |
| No Fuel Used | 0 (0.0%) | 35 (3.9%) |
| Total | 2,070 (100.0%) | 895 (100.0%) |
Household Vehicle Usage in Strasburg
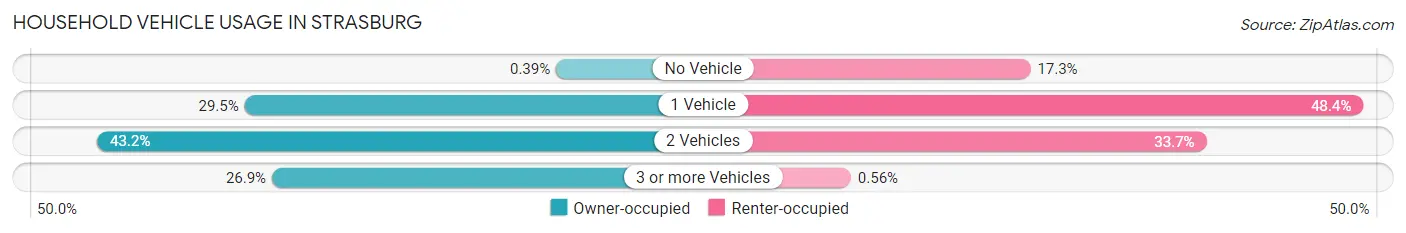
| Vehicles per Household | Owner-occupied | Renter-occupied |
| No Vehicle | 8 (0.4%) | 155 (17.3%) |
| 1 Vehicle | 610 (29.5%) | 433 (48.4%) |
| 2 Vehicles | 895 (43.2%) | 302 (33.7%) |
| 3 or more Vehicles | 557 (26.9%) | 5 (0.6%) |
| Total | 2,070 (100.0%) | 895 (100.0%) |
Real Estate & Mortgages in Strasburg
Real Estate and Mortgage Overview in Strasburg
| Characteristic | Without Mortgage | With Mortgage |
| Housing Units | 504 | 1,566 |
| Median Property Value | $240,900 | $222,800 |
| Median Household Income | $54,091 | $146 |
| Monthly Housing Costs | $488 | $17 |
| Real Estate Taxes | $1,500 | $0 |
Property Value by Mortgage Status in Strasburg
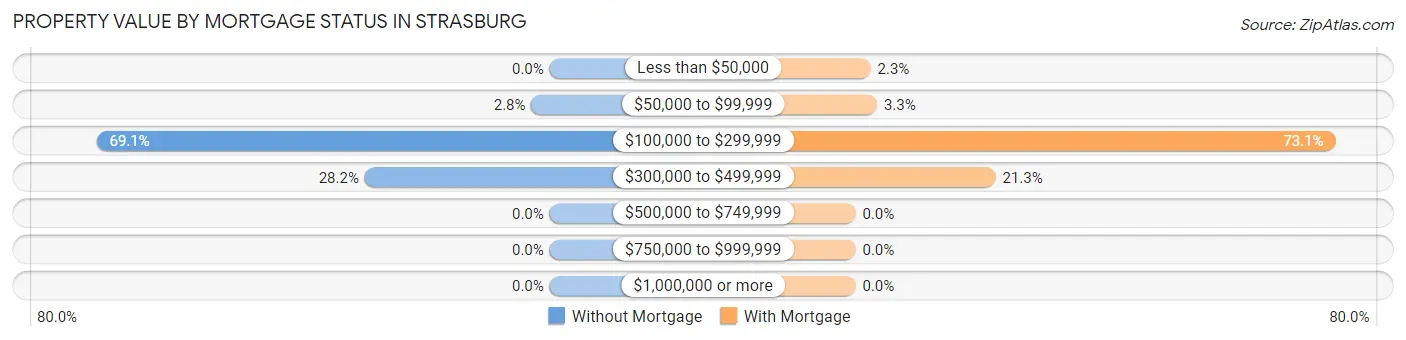
| Property Value | Without Mortgage | With Mortgage |
| Less than $50,000 | 0 (0.0%) | 36 (2.3%) |
| $50,000 to $99,999 | 14 (2.8%) | 51 (3.3%) |
| $100,000 to $299,999 | 348 (69.1%) | 1,145 (73.1%) |
| $300,000 to $499,999 | 142 (28.2%) | 334 (21.3%) |
| $500,000 to $749,999 | 0 (0.0%) | 0 (0.0%) |
| $750,000 to $999,999 | 0 (0.0%) | 0 (0.0%) |
| $1,000,000 or more | 0 (0.0%) | 0 (0.0%) |
| Total | 504 (100.0%) | 1,566 (100.0%) |
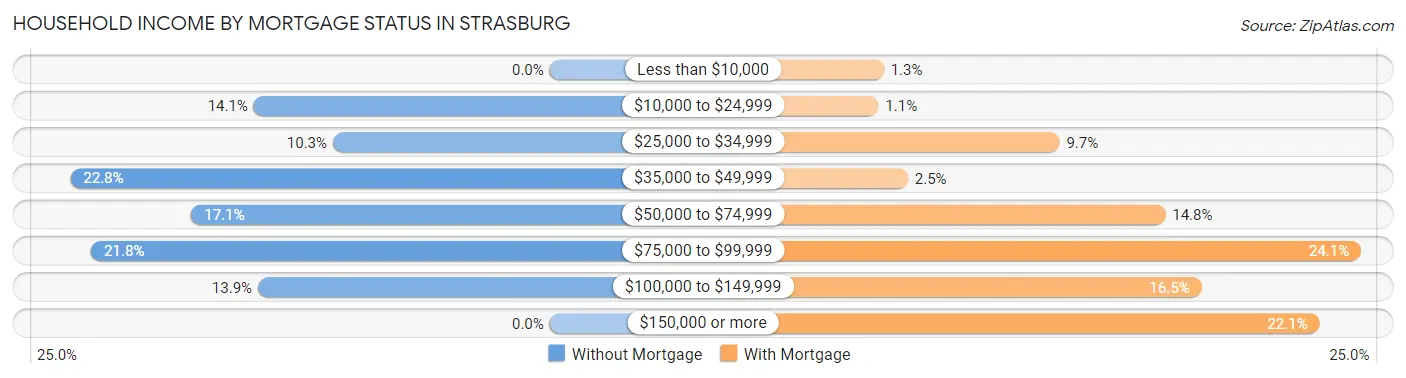
Household Income by Mortgage Status in Strasburg
| Household Income | Without Mortgage | With Mortgage |
| Less than $10,000 | 0 (0.0%) | 21 (1.3%) |
| $10,000 to $24,999 | 71 (14.1%) | 17 (1.1%) |
| $25,000 to $34,999 | 52 (10.3%) | 152 (9.7%) |
| $35,000 to $49,999 | 115 (22.8%) | 39 (2.5%) |
| $50,000 to $74,999 | 86 (17.1%) | 231 (14.7%) |
| $75,000 to $99,999 | 110 (21.8%) | 377 (24.1%) |
| $100,000 to $149,999 | 70 (13.9%) | 258 (16.5%) |
| $150,000 or more | 0 (0.0%) | 346 (22.1%) |
| Total | 504 (100.0%) | 1,566 (100.0%) |
Property Value to Household Income Ratio in Strasburg
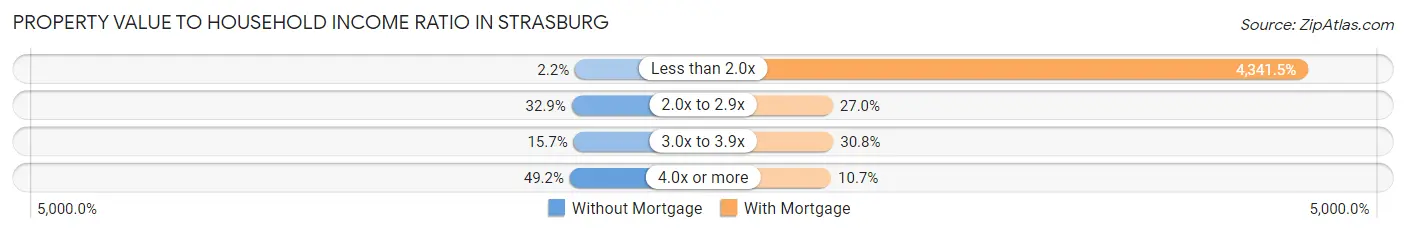
| Value-to-Income Ratio | Without Mortgage | With Mortgage |
| Less than 2.0x | 11 (2.2%) | 67,988 (4,341.5%) |
| 2.0x to 2.9x | 166 (32.9%) | 422 (27.0%) |
| 3.0x to 3.9x | 79 (15.7%) | 482 (30.8%) |
| 4.0x or more | 248 (49.2%) | 168 (10.7%) |
| Total | 504 (100.0%) | 1,566 (100.0%) |
Real Estate Taxes by Mortgage Status in Strasburg
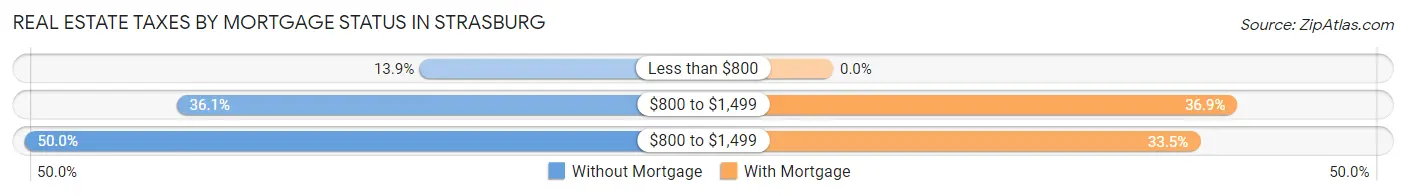
| Property Taxes | Without Mortgage | With Mortgage |
| Less than $800 | 70 (13.9%) | 0 (0.0%) |
| $800 to $1,499 | 182 (36.1%) | 578 (36.9%) |
| $800 to $1,499 | 252 (50.0%) | 525 (33.5%) |
| Total | 504 (100.0%) | 1,566 (100.0%) |
Health & Disability in Strasburg
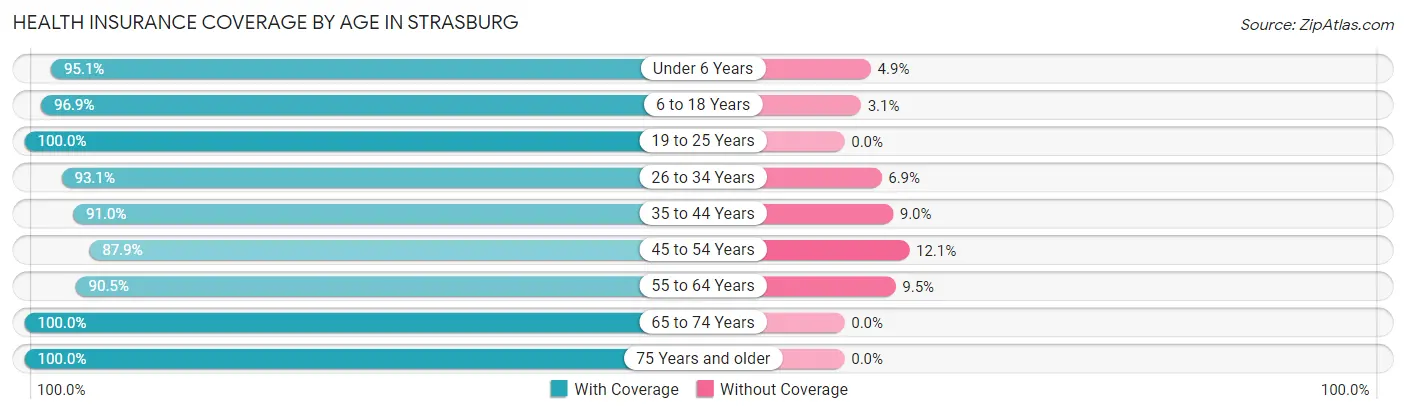
Health Insurance Coverage by Age in Strasburg
| Age Bracket | With Coverage | Without Coverage |
| Under 6 Years | 715 (95.1%) | 37 (4.9%) |
| 6 to 18 Years | 1,265 (96.9%) | 40 (3.1%) |
| 19 to 25 Years | 475 (100.0%) | 0 (0.0%) |
| 26 to 34 Years | 553 (93.1%) | 41 (6.9%) |
| 35 to 44 Years | 1,107 (91.0%) | 110 (9.0%) |
| 45 to 54 Years | 663 (87.9%) | 91 (12.1%) |
| 55 to 64 Years | 656 (90.5%) | 69 (9.5%) |
| 65 to 74 Years | 771 (100.0%) | 0 (0.0%) |
| 75 Years and older | 473 (100.0%) | 0 (0.0%) |
| Total | 6,678 (94.5%) | 388 (5.5%) |
Health Insurance Coverage by Citizenship Status in Strasburg
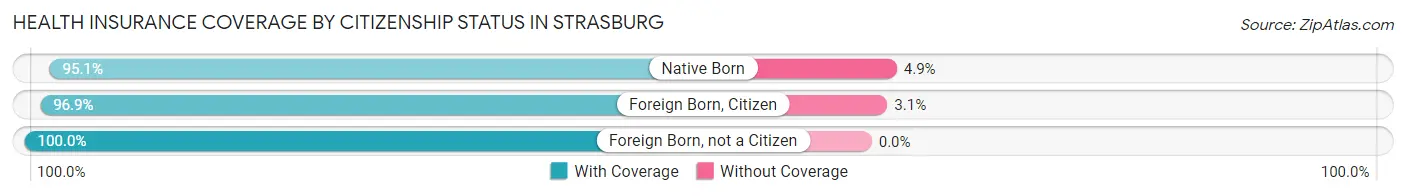
| Citizenship Status | With Coverage | Without Coverage |
| Native Born | 715 (95.1%) | 37 (4.9%) |
| Foreign Born, Citizen | 1,265 (96.9%) | 40 (3.1%) |
| Foreign Born, not a Citizen | 475 (100.0%) | 0 (0.0%) |
Health Insurance Coverage by Household Income in Strasburg
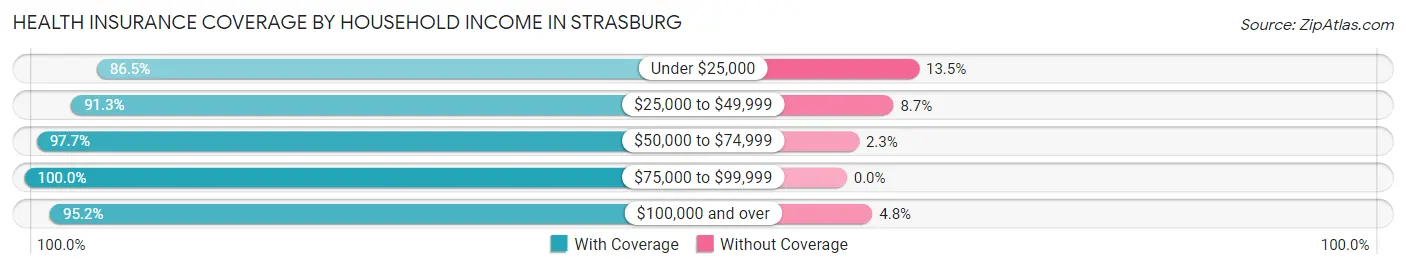
| Household Income | With Coverage | Without Coverage |
| Under $25,000 | 747 (86.5%) | 117 (13.5%) |
| $25,000 to $49,999 | 1,389 (91.3%) | 133 (8.7%) |
| $50,000 to $74,999 | 1,457 (97.7%) | 34 (2.3%) |
| $75,000 to $99,999 | 1,015 (100.0%) | 0 (0.0%) |
| $100,000 and over | 2,070 (95.2%) | 104 (4.8%) |
Public vs Private Health Insurance Coverage by Age in Strasburg
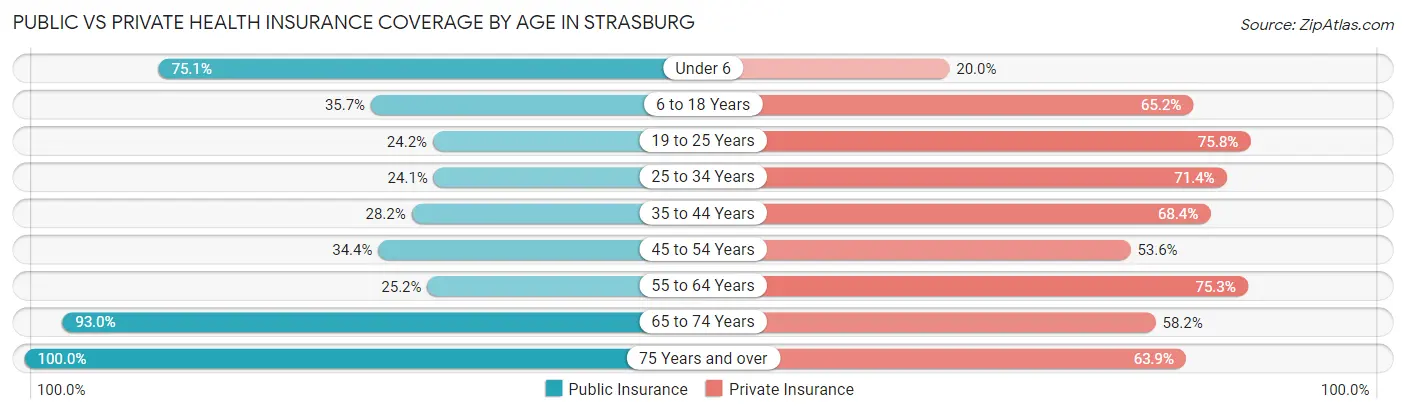
| Age Bracket | Public Insurance | Private Insurance |
| Under 6 | 565 (75.1%) | 150 (20.0%) |
| 6 to 18 Years | 466 (35.7%) | 851 (65.2%) |
| 19 to 25 Years | 115 (24.2%) | 360 (75.8%) |
| 25 to 34 Years | 143 (24.1%) | 424 (71.4%) |
| 35 to 44 Years | 343 (28.2%) | 832 (68.4%) |
| 45 to 54 Years | 259 (34.4%) | 404 (53.6%) |
| 55 to 64 Years | 183 (25.2%) | 546 (75.3%) |
| 65 to 74 Years | 717 (93.0%) | 449 (58.2%) |
| 75 Years and over | 473 (100.0%) | 302 (63.8%) |
| Total | 3,264 (46.2%) | 4,318 (61.1%) |
Disability Status by Sex by Age in Strasburg
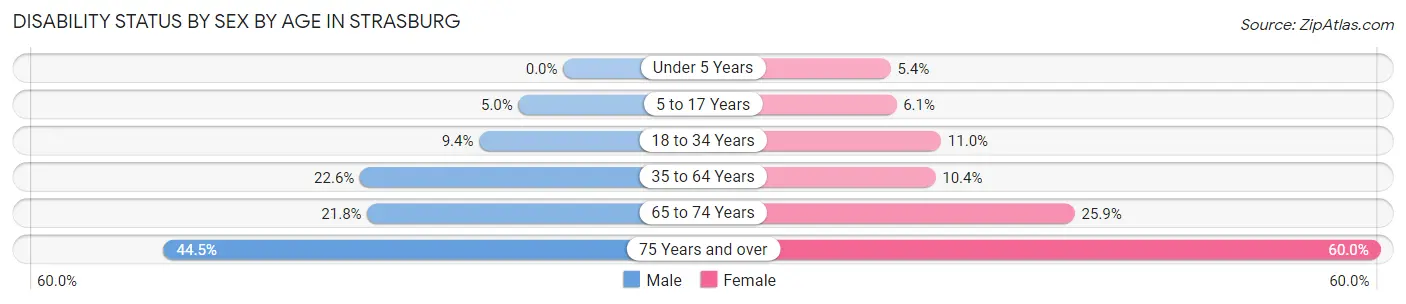
| Age Bracket | Male | Female |
| Under 5 Years | 0 (0.0%) | 7 (5.4%) |
| 5 to 17 Years | 29 (5.0%) | 43 (6.1%) |
| 18 to 34 Years | 54 (9.4%) | 69 (11.0%) |
| 35 to 64 Years | 282 (22.6%) | 151 (10.4%) |
| 65 to 74 Years | 79 (21.8%) | 106 (25.9%) |
| 75 Years and over | 77 (44.5%) | 180 (60.0%) |
Disability Class by Sex by Age in Strasburg
Disability Class: Hearing Difficulty
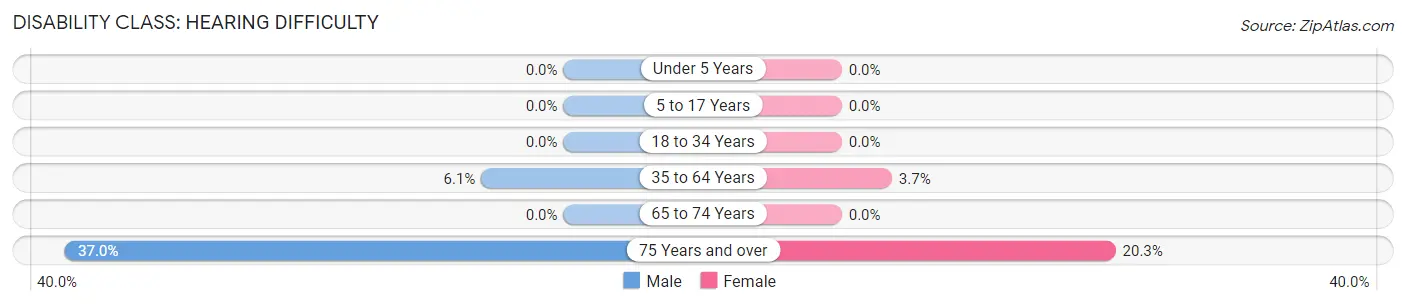
| Age Bracket | Male | Female |
| Under 5 Years | 0 (0.0%) | 0 (0.0%) |
| 5 to 17 Years | 0 (0.0%) | 0 (0.0%) |
| 18 to 34 Years | 0 (0.0%) | 0 (0.0%) |
| 35 to 64 Years | 76 (6.1%) | 54 (3.7%) |
| 65 to 74 Years | 0 (0.0%) | 0 (0.0%) |
| 75 Years and over | 64 (37.0%) | 61 (20.3%) |
Disability Class: Vision Difficulty
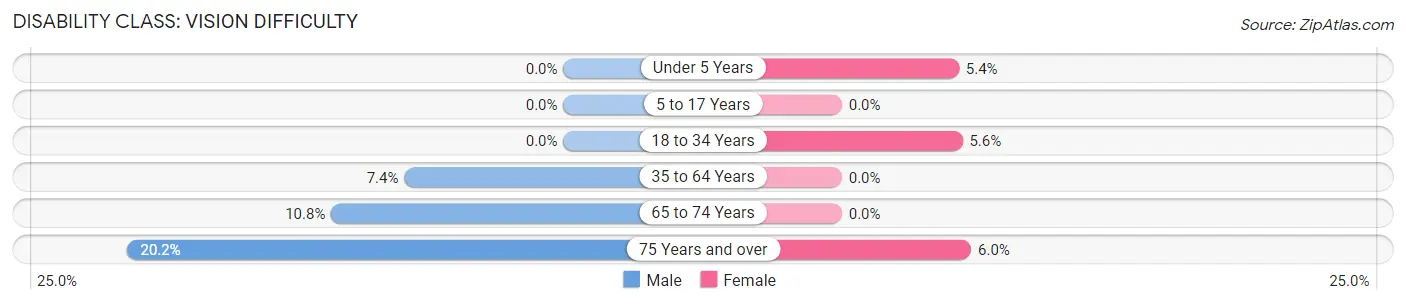
| Age Bracket | Male | Female |
| Under 5 Years | 0 (0.0%) | 7 (5.4%) |
| 5 to 17 Years | 0 (0.0%) | 0 (0.0%) |
| 18 to 34 Years | 0 (0.0%) | 35 (5.6%) |
| 35 to 64 Years | 92 (7.4%) | 0 (0.0%) |
| 65 to 74 Years | 39 (10.8%) | 0 (0.0%) |
| 75 Years and over | 35 (20.2%) | 18 (6.0%) |
Disability Class: Cognitive Difficulty
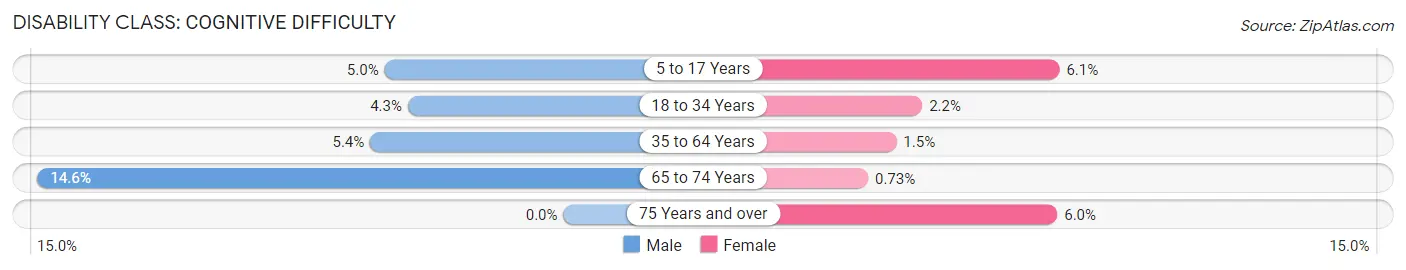
| Age Bracket | Male | Female |
| 5 to 17 Years | 29 (5.0%) | 43 (6.1%) |
| 18 to 34 Years | 25 (4.3%) | 14 (2.2%) |
| 35 to 64 Years | 67 (5.4%) | 22 (1.5%) |
| 65 to 74 Years | 53 (14.6%) | 3 (0.7%) |
| 75 Years and over | 0 (0.0%) | 18 (6.0%) |
Disability Class: Ambulatory Difficulty
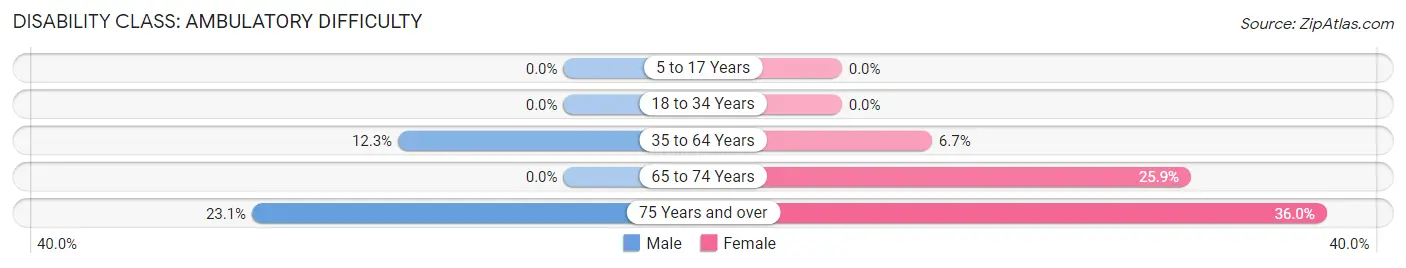
| Age Bracket | Male | Female |
| 5 to 17 Years | 0 (0.0%) | 0 (0.0%) |
| 18 to 34 Years | 0 (0.0%) | 0 (0.0%) |
| 35 to 64 Years | 153 (12.3%) | 97 (6.7%) |
| 65 to 74 Years | 0 (0.0%) | 106 (25.9%) |
| 75 Years and over | 40 (23.1%) | 108 (36.0%) |
Disability Class: Self-Care Difficulty
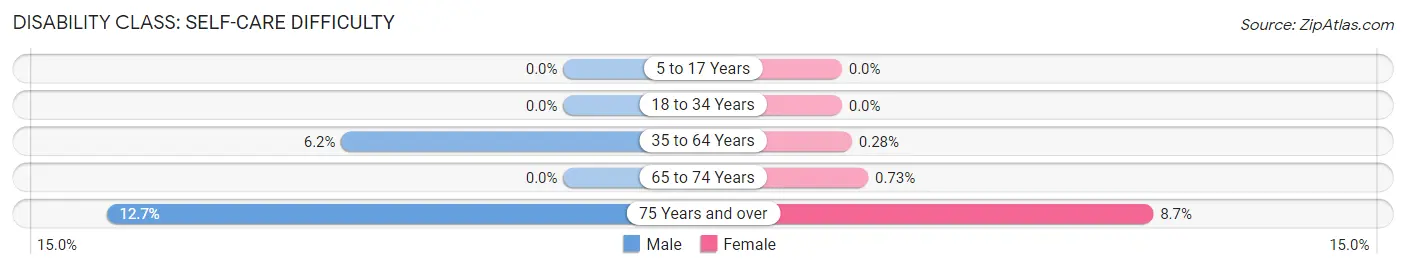
| Age Bracket | Male | Female |
| 5 to 17 Years | 0 (0.0%) | 0 (0.0%) |
| 18 to 34 Years | 0 (0.0%) | 0 (0.0%) |
| 35 to 64 Years | 77 (6.2%) | 4 (0.3%) |
| 65 to 74 Years | 0 (0.0%) | 3 (0.7%) |
| 75 Years and over | 22 (12.7%) | 26 (8.7%) |
Technology Access in Strasburg
Computing Device Access in Strasburg
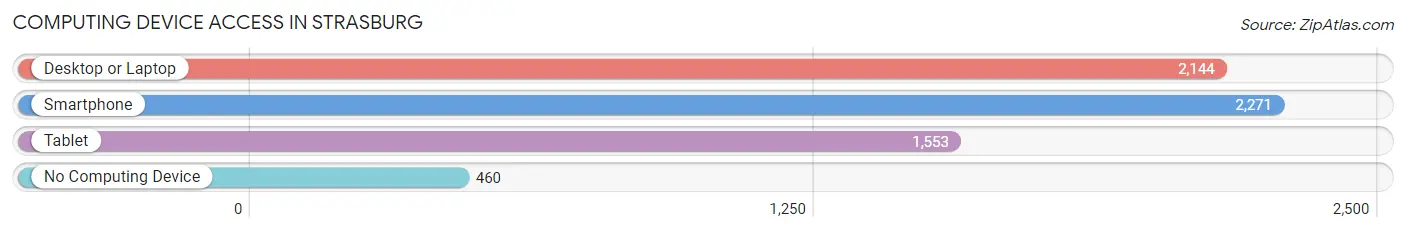
| Device Type | # Households | % Households |
| Desktop or Laptop | 2,144 | 72.3% |
| Smartphone | 2,271 | 76.6% |
| Tablet | 1,553 | 52.4% |
| No Computing Device | 460 | 15.5% |
| Total | 2,965 | 100.0% |
Internet Access in Strasburg
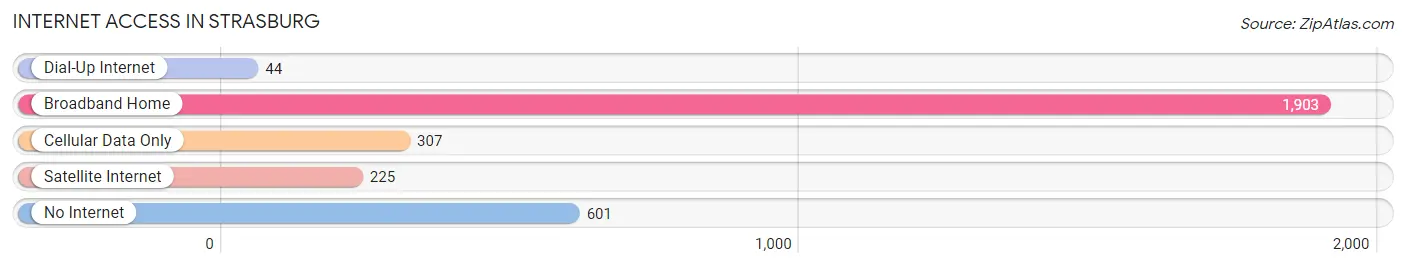
| Internet Type | # Households | % Households |
| Dial-Up Internet | 44 | 1.5% |
| Broadband Home | 1,903 | 64.2% |
| Cellular Data Only | 307 | 10.3% |
| Satellite Internet | 225 | 7.6% |
| No Internet | 601 | 20.3% |
| Total | 2,965 | 100.0% |
Strasburg Summary
Strasburg, Virginia is a small town located in the Shenandoah Valley of the Commonwealth of Virginia. It is situated in the northern part of Shenandoah County, approximately 70 miles west of Washington, D.C. and 30 miles south of Winchester. The town is situated along the banks of the Shenandoah River and is surrounded by the Blue Ridge Mountains. The population of Strasburg was 5,398 as of the 2010 census.
History
Strasburg was founded in 1761 by Peter Stover, a German immigrant. The town was named after Strasbourg, France, the hometown of Stover’s wife. The town was originally a farming community, but it soon became a major stop on the Valley Turnpike, a major transportation route in the area. The town was also a major stop on the Winchester and Potomac Railroad, which connected Winchester to Washington, D.C.
During the Civil War, Strasburg was the site of several battles, including the Battle of Cedar Creek in October 1864. The town was also the site of the Battle of Tom’s Brook in October 1864. After the war, Strasburg experienced a period of growth and prosperity. The town was incorporated in 1875 and the first public school was established in 1876.
Geography
Strasburg is located in the northern part of Shenandoah County, approximately 70 miles west of Washington, D.C. and 30 miles south of Winchester. The town is situated along the banks of the Shenandoah River and is surrounded by the Blue Ridge Mountains. The town has a total area of 2.2 square miles, all of which is land.
Economy
Strasburg’s economy is largely based on agriculture and tourism. The town is home to several farms, including the Strasburg Dairy Farm, which produces milk, cheese, and other dairy products. The town is also home to several wineries, including the Shenandoah Vineyards and the Strasburg Winery.
Tourism is also an important part of the local economy. The town is home to several historic sites, including the Strasburg Museum, the Strasburg Railroad, and the Cedar Creek Battlefield. The town is also home to several festivals and events, including the Strasburg Harvest Festival and the Strasburg Music Festival.
Demographics
As of the 2010 census, the population of Strasburg was 5,398. The racial makeup of the town was 94.3% White, 2.3% African American, 0.3% Native American, 0.7% Asian, 0.1% Pacific Islander, 0.7% from other races, and 1.6% from two or more races. Hispanic or Latino of any race were 2.2% of the population.
The median income for a household in the town was $41,944, and the median income for a family was $50,917. The per capita income for the town was $20,945. About 8.2% of families and 10.3% of the population were below the poverty line, including 14.2% of those under age 18 and 8.2% of those age 65 or over.
Common Questions
What is Per Capita Income in Strasburg?
Per Capita income in Strasburg is $27,307.
What is the Median Family Income in Strasburg?
Median Family Income in Strasburg is $59,363.
What is the Median Household income in Strasburg?
Median Household Income in Strasburg is $56,244.
What is Income or Wage Gap in Strasburg?
Income or Wage Gap in Strasburg is 36.1%.
Women in Strasburg earn 63.9 cents for every dollar earned by a man.
What is Inequality or Gini Index in Strasburg?
Inequality or Gini Index in Strasburg is 0.37.
What is the Total Population of Strasburg?
Total Population of Strasburg is 7,104.
What is the Total Male Population of Strasburg?
Total Male Population of Strasburg is 3,481.
What is the Total Female Population of Strasburg?
Total Female Population of Strasburg is 3,623.
What is the Ratio of Males per 100 Females in Strasburg?
There are 96.08 Males per 100 Females in Strasburg.
What is the Ratio of Females per 100 Males in Strasburg?
There are 104.08 Females per 100 Males in Strasburg.
What is the Median Population Age in Strasburg?
Median Population Age in Strasburg is 36.8 Years.
What is the Average Family Size in Strasburg
Average Family Size in Strasburg is 3.0 People.
What is the Average Household Size in Strasburg
Average Household Size in Strasburg is 2.4 People.
How Large is the Labor Force in Strasburg?
There are 3,443 People in the Labor Forcein in Strasburg.
What is the Percentage of People in the Labor Force in Strasburg?
63.8% of People are in the Labor Force in Strasburg.
What is the Unemployment Rate in Strasburg?
Unemployment Rate in Strasburg is 3.9%.