Woodburn, VA Map & Demographics
Woodburn Map
Woodburn Overview
$50,915
PER CAPITA INCOME
$153,224
AVG FAMILY INCOME
$127,406
AVG HOUSEHOLD INCOME
15.1%
WAGE / INCOME GAP [ % ]
84.9¢/ $1
WAGE / INCOME GAP [ $ ]
0.42
INEQUALITY / GINI INDEX
9,960
TOTAL POPULATION
5,299
MALE POPULATION
4,661
FEMALE POPULATION
113.69
MALES / 100 FEMALES
87.96
FEMALES / 100 MALES
32.6
MEDIAN AGE
3.6
AVG FAMILY SIZE
3.1
AVG HOUSEHOLD SIZE
5,076
LABOR FORCE [ PEOPLE ]
69.4%
PERCENT IN LABOR FORCE
3.0%
UNEMPLOYMENT RATE
Income in Woodburn
Income Overview in Woodburn
Per Capita Income in Woodburn is $50,915, while median incomes of families and households are $153,224 and $127,406 respectively.
| Characteristic | Number | Measure |
| Per Capita Income | 9,960 | $50,915 |
| Median Family Income | 2,279 | $153,224 |
| Mean Family Income | 2,279 | $170,985 |
| Median Household Income | 3,174 | $127,406 |
| Mean Household Income | 3,174 | $155,851 |
| Income Deficit | 2,279 | $0 |
| Wage / Income Gap (%) | 9,960 | 15.13% |
| Wage / Income Gap ($) | 9,960 | 84.87¢ per $1 |
| Gini / Inequality Index | 9,960 | 0.42 |
Earnings by Sex in Woodburn
Average Earnings in Woodburn are $68,253, $69,736 for men and $59,183 for women, a difference of 15.1%.
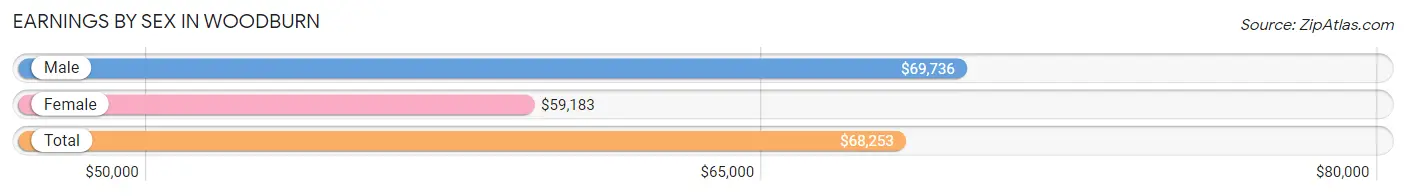
| Sex | Number | Average Earnings |
| Male | 2,773 (53.4%) | $69,736 |
| Female | 2,418 (46.6%) | $59,183 |
| Total | 5,191 (100.0%) | $68,253 |
Earnings by Sex by Income Bracket in Woodburn
The most common earnings brackets in Woodburn are $100,000+ for men (901 | 32.5%) and $100,000+ for women (674 | 27.9%).
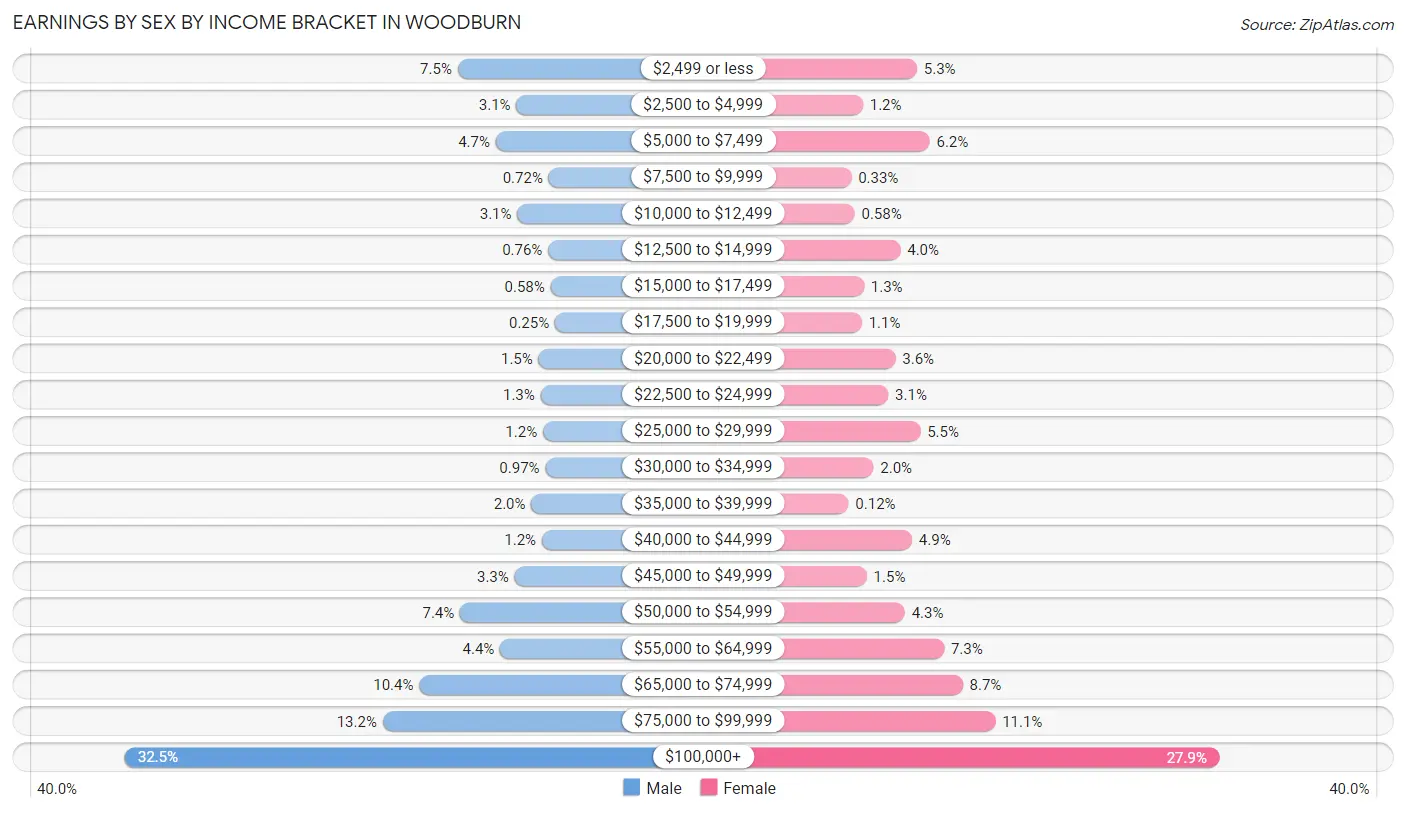
| Income | Male | Female |
| $2,499 or less | 209 (7.5%) | 127 (5.2%) |
| $2,500 to $4,999 | 87 (3.1%) | 29 (1.2%) |
| $5,000 to $7,499 | 130 (4.7%) | 150 (6.2%) |
| $7,500 to $9,999 | 20 (0.7%) | 8 (0.3%) |
| $10,000 to $12,499 | 85 (3.1%) | 14 (0.6%) |
| $12,500 to $14,999 | 21 (0.8%) | 97 (4.0%) |
| $15,000 to $17,499 | 16 (0.6%) | 31 (1.3%) |
| $17,500 to $19,999 | 7 (0.3%) | 27 (1.1%) |
| $20,000 to $22,499 | 41 (1.5%) | 88 (3.6%) |
| $22,500 to $24,999 | 37 (1.3%) | 75 (3.1%) |
| $25,000 to $29,999 | 32 (1.1%) | 133 (5.5%) |
| $30,000 to $34,999 | 27 (1.0%) | 48 (2.0%) |
| $35,000 to $39,999 | 56 (2.0%) | 3 (0.1%) |
| $40,000 to $44,999 | 34 (1.2%) | 118 (4.9%) |
| $45,000 to $49,999 | 91 (3.3%) | 36 (1.5%) |
| $50,000 to $54,999 | 204 (7.4%) | 105 (4.3%) |
| $55,000 to $64,999 | 121 (4.4%) | 176 (7.3%) |
| $65,000 to $74,999 | 289 (10.4%) | 210 (8.7%) |
| $75,000 to $99,999 | 365 (13.2%) | 269 (11.1%) |
| $100,000+ | 901 (32.5%) | 674 (27.9%) |
| Total | 2,773 (100.0%) | 2,418 (100.0%) |
Earnings by Sex by Educational Attainment in Woodburn
Average earnings in Woodburn are $81,510 for men and $70,131 for women, a difference of 14.0%. Men with an educational attainment of graduate degree enjoy the highest average annual earnings of $105,781, while those with high school diploma education earn the least with $46,118. Women with an educational attainment of graduate degree earn the most with the average annual earnings of $110,375, while those with high school diploma education have the smallest earnings of $40,536.
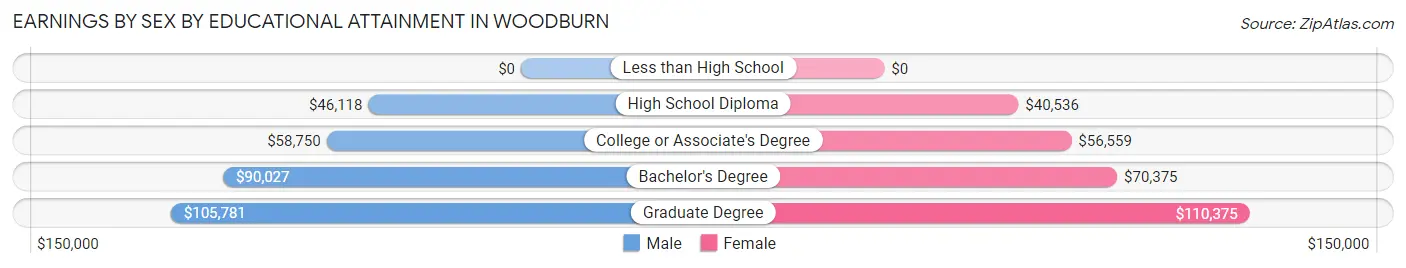
| Educational Attainment | Male Income | Female Income |
| Less than High School | - | - |
| High School Diploma | $46,118 | $40,536 |
| College or Associate's Degree | $58,750 | $56,559 |
| Bachelor's Degree | $90,027 | $70,375 |
| Graduate Degree | $105,781 | $110,375 |
| Total | $81,510 | $70,131 |
Family Income in Woodburn
Family Income Brackets in Woodburn
According to the Woodburn family income data, there are 722 families falling into the $200,000+ income range, which is the most common income bracket and makes up 31.7% of all families. Conversely, the $10,000 to $14,999 income bracket is the least frequent group with only 16 families (0.7%) belonging to this category.
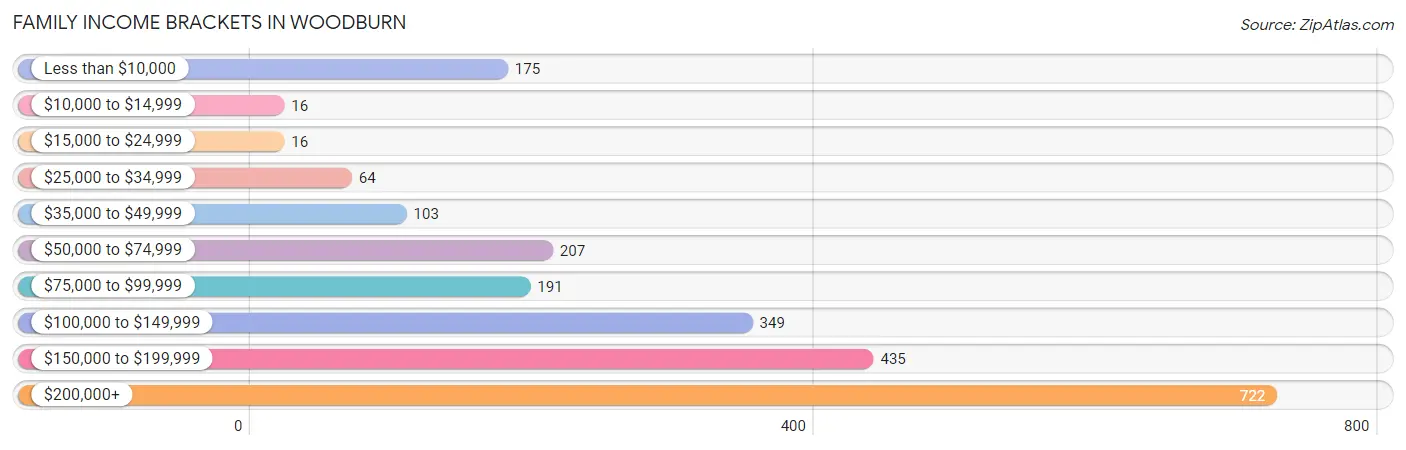
| Income Bracket | # Families | % Families |
| Less than $10,000 | 175 | 7.7% |
| $10,000 to $14,999 | 16 | 0.7% |
| $15,000 to $24,999 | 16 | 0.7% |
| $25,000 to $34,999 | 64 | 2.8% |
| $35,000 to $49,999 | 103 | 4.5% |
| $50,000 to $74,999 | 207 | 9.1% |
| $75,000 to $99,999 | 191 | 8.4% |
| $100,000 to $149,999 | 349 | 15.3% |
| $150,000 to $199,999 | 435 | 19.1% |
| $200,000+ | 722 | 31.7% |
Family Income by Famaliy Size in Woodburn
6-person families (35 | 1.5%) account for the highest median family income in Woodburn with $185,096 per family, while 2-person families (732 | 32.1%) have the highest median income of $76,072 per family member.
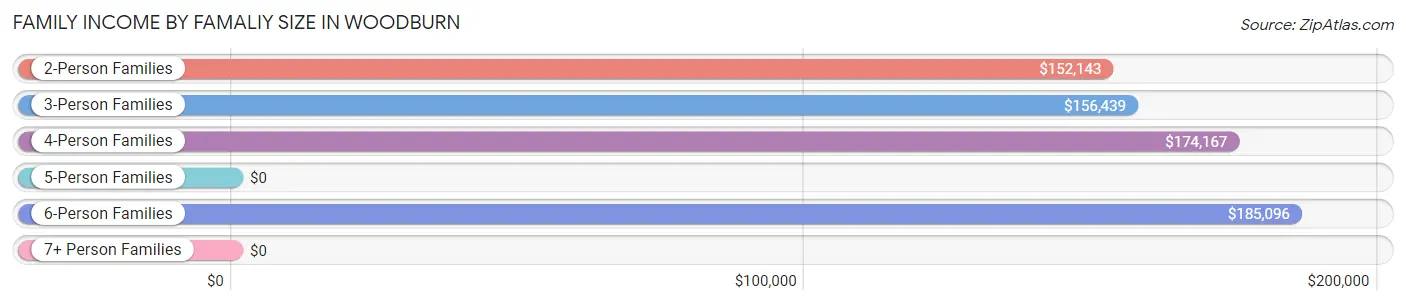
| Income Bracket | # Families | Median Income |
| 2-Person Families | 732 (32.1%) | $152,143 |
| 3-Person Families | 443 (19.4%) | $156,439 |
| 4-Person Families | 544 (23.9%) | $174,167 |
| 5-Person Families | 468 (20.5%) | $0 |
| 6-Person Families | 35 (1.5%) | $185,096 |
| 7+ Person Families | 57 (2.5%) | $0 |
| Total | 2,279 (100.0%) | $153,224 |
Family Income by Number of Earners in Woodburn
The median family income in Woodburn is $153,224, with families comprising 2 earners (1,002) having the highest median family income of $191,607, while families with no earners (286) have the lowest median family income of $87,500, accounting for 44.0% and 12.6% of families, respectively.
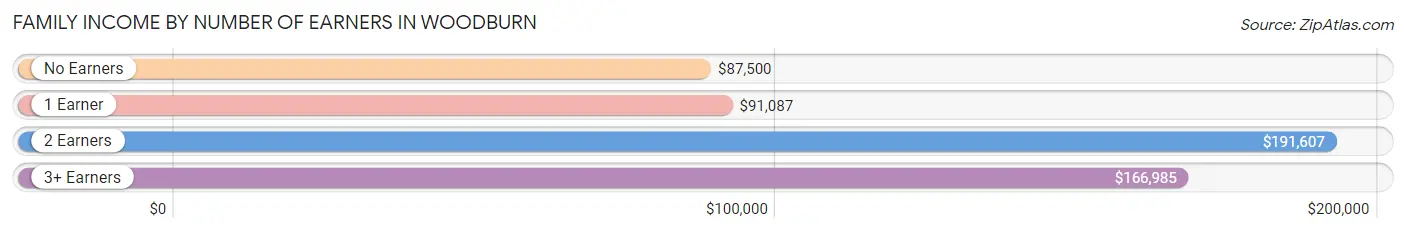
| Number of Earners | # Families | Median Income |
| No Earners | 286 (12.6%) | $87,500 |
| 1 Earner | 644 (28.3%) | $91,087 |
| 2 Earners | 1,002 (44.0%) | $191,607 |
| 3+ Earners | 347 (15.2%) | $166,985 |
| Total | 2,279 (100.0%) | $153,224 |
Household Income in Woodburn
Household Income Brackets in Woodburn
With 863 households falling in the category, the $200,000+ income range is the most frequent in Woodburn, accounting for 27.2% of all households. In contrast, only 16 households (0.5%) fall into the $10,000 to $14,999 income bracket, making it the least populous group.
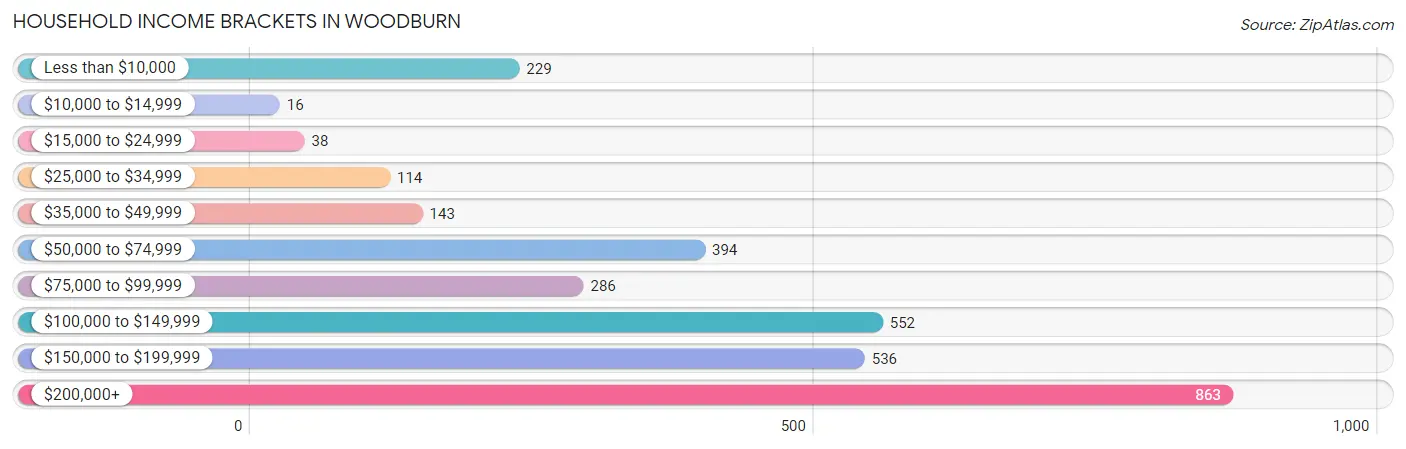
| Income Bracket | # Households | % Households |
| Less than $10,000 | 229 | 7.2% |
| $10,000 to $14,999 | 16 | 0.5% |
| $15,000 to $24,999 | 38 | 1.2% |
| $25,000 to $34,999 | 114 | 3.6% |
| $35,000 to $49,999 | 143 | 4.5% |
| $50,000 to $74,999 | 394 | 12.4% |
| $75,000 to $99,999 | 286 | 9.0% |
| $100,000 to $149,999 | 552 | 17.4% |
| $150,000 to $199,999 | 536 | 16.9% |
| $200,000+ | 863 | 27.2% |
Household Income by Householder Age in Woodburn
The median household income in Woodburn is $127,406, with the highest median household income of $145,428 found in the 45 to 64 years age bracket for the primary householder. A total of 1,215 households (38.3%) fall into this category. Meanwhile, the 15 to 24 years age bracket for the primary householder has the lowest median household income of $0, with 113 households (3.6%) in this group.
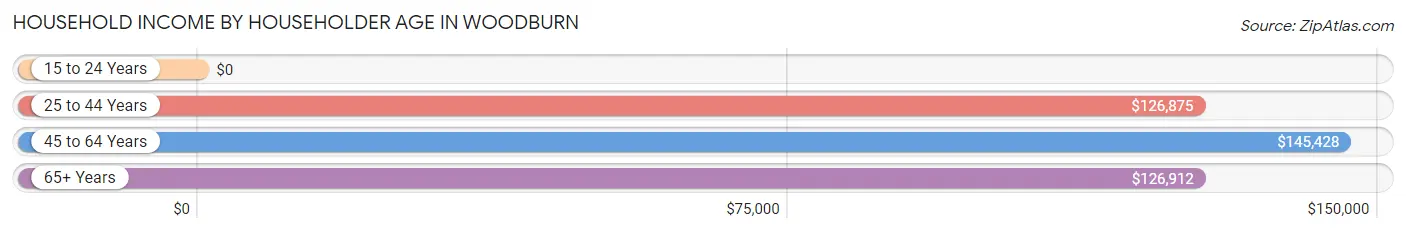
| Income Bracket | # Households | Median Income |
| 15 to 24 Years | 113 (3.6%) | $0 |
| 25 to 44 Years | 1,302 (41.0%) | $126,875 |
| 45 to 64 Years | 1,215 (38.3%) | $145,428 |
| 65+ Years | 544 (17.1%) | $126,912 |
| Total | 3,174 (100.0%) | $127,406 |
Poverty in Woodburn
Income Below Poverty by Sex and Age in Woodburn
With 14.2% poverty level for males and 13.3% for females among the residents of Woodburn, 6 to 11 year old males and 12 to 14 year old females are the most vulnerable to poverty, with 307 males (32.7%) and 150 females (43.3%) in their respective age groups living below the poverty level.
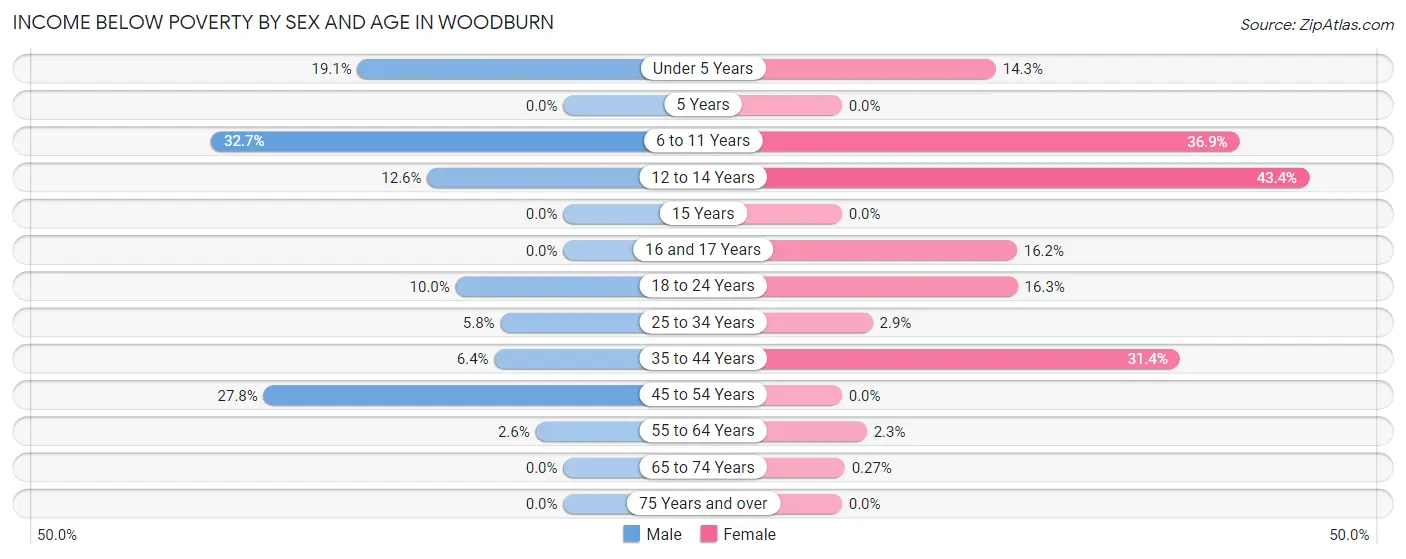
| Age Bracket | Male | Female |
| Under 5 Years | 89 (19.1%) | 23 (14.3%) |
| 5 Years | 0 (0.0%) | 0 (0.0%) |
| 6 to 11 Years | 307 (32.7%) | 124 (36.9%) |
| 12 to 14 Years | 26 (12.6%) | 150 (43.3%) |
| 15 Years | 0 (0.0%) | 0 (0.0%) |
| 16 and 17 Years | 0 (0.0%) | 19 (16.2%) |
| 18 to 24 Years | 33 (10.0%) | 39 (16.3%) |
| 25 to 34 Years | 58 (5.8%) | 29 (2.9%) |
| 35 to 44 Years | 32 (6.4%) | 212 (31.4%) |
| 45 to 54 Years | 185 (27.8%) | 0 (0.0%) |
| 55 to 64 Years | 12 (2.6%) | 11 (2.3%) |
| 65 to 74 Years | 0 (0.0%) | 1 (0.3%) |
| 75 Years and over | 0 (0.0%) | 0 (0.0%) |
| Total | 742 (14.2%) | 608 (13.3%) |
Income Above Poverty by Sex and Age in Woodburn
According to the poverty statistics in Woodburn, males aged 5 years and females aged 5 years are the age groups that are most secure financially, with 100.0% of males and 100.0% of females in these age groups living above the poverty line.
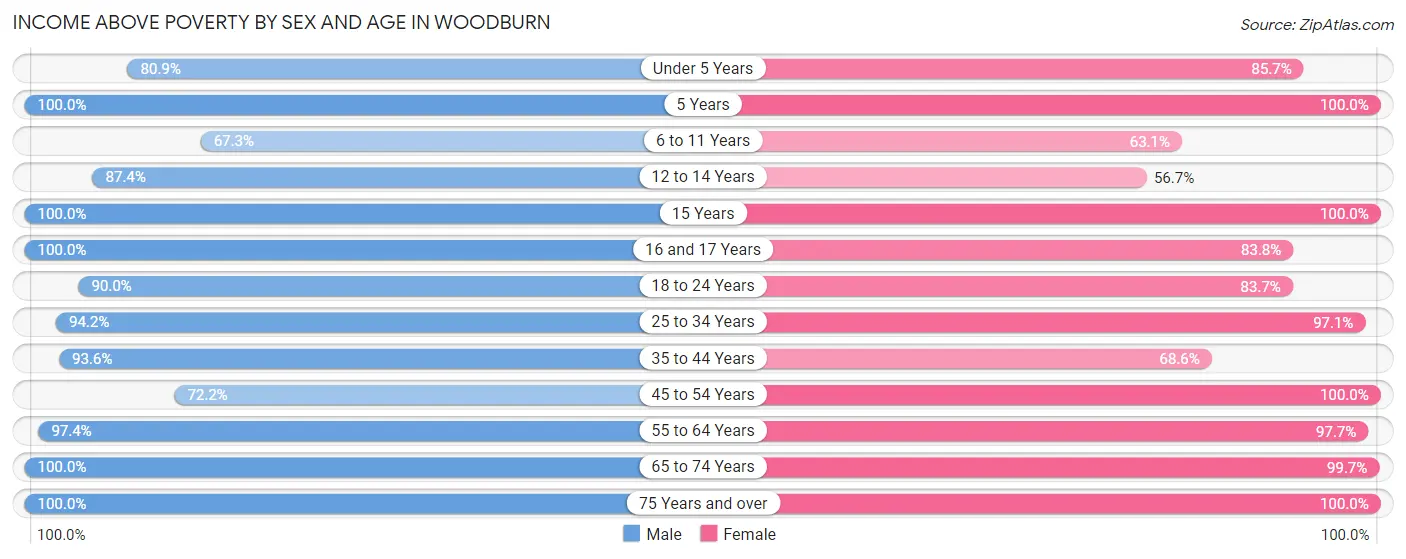
| Age Bracket | Male | Female |
| Under 5 Years | 377 (80.9%) | 138 (85.7%) |
| 5 Years | 63 (100.0%) | 94 (100.0%) |
| 6 to 11 Years | 632 (67.3%) | 212 (63.1%) |
| 12 to 14 Years | 180 (87.4%) | 196 (56.7%) |
| 15 Years | 15 (100.0%) | 20 (100.0%) |
| 16 and 17 Years | 98 (100.0%) | 98 (83.8%) |
| 18 to 24 Years | 297 (90.0%) | 200 (83.7%) |
| 25 to 34 Years | 935 (94.2%) | 986 (97.1%) |
| 35 to 44 Years | 468 (93.6%) | 464 (68.6%) |
| 45 to 54 Years | 480 (72.2%) | 502 (100.0%) |
| 55 to 64 Years | 453 (97.4%) | 466 (97.7%) |
| 65 to 74 Years | 336 (100.0%) | 363 (99.7%) |
| 75 Years and over | 149 (100.0%) | 232 (100.0%) |
| Total | 4,483 (85.8%) | 3,971 (86.7%) |
Income Below Poverty Among Married-Couple Families in Woodburn
The poverty statistics for married-couple families in Woodburn show that 9.7% or 192 of the total 1,977 families live below the poverty line. Families with 3 or 4 children have the highest poverty rate of 52.9%, comprising of 163 families. On the other hand, families with no children have the lowest poverty rate of 0.0%, which includes 0 families.
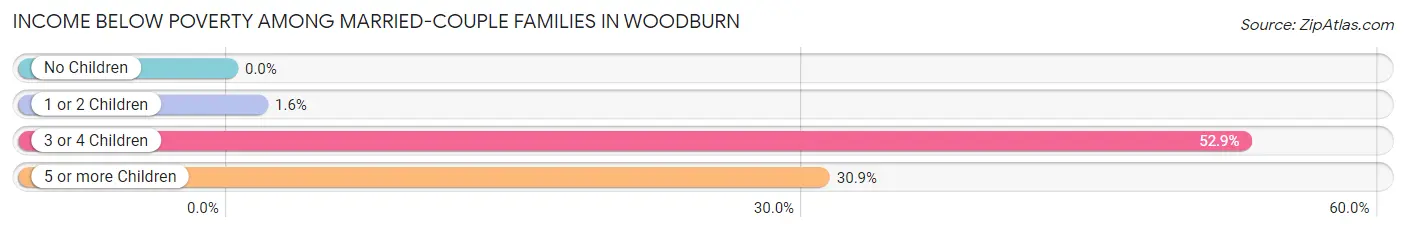
| Children | Above Poverty | Below Poverty |
| No Children | 850 (100.0%) | 0 (0.0%) |
| 1 or 2 Children | 752 (98.4%) | 12 (1.6%) |
| 3 or 4 Children | 145 (47.1%) | 163 (52.9%) |
| 5 or more Children | 38 (69.1%) | 17 (30.9%) |
| Total | 1,785 (90.3%) | 192 (9.7%) |
Income Below Poverty Among Single-Parent Households in Woodburn
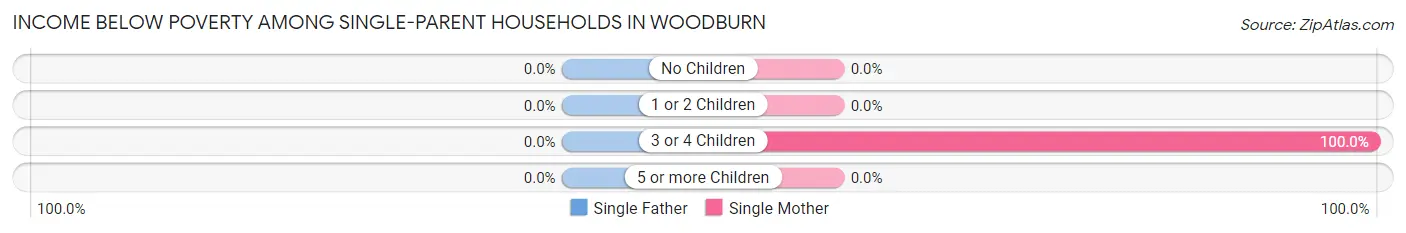
| Children | Single Father | Single Mother |
| No Children | 0 (0.0%) | 0 (0.0%) |
| 1 or 2 Children | 0 (0.0%) | 0 (0.0%) |
| 3 or 4 Children | 0 (0.0%) | 18 (100.0%) |
| 5 or more Children | 0 (0.0%) | 0 (0.0%) |
| Total | 0 (0.0%) | 18 (8.1%) |
Income Below Poverty Among Married-Couple vs Single-Parent Households in Woodburn
The poverty data for Woodburn shows that 192 of the married-couple family households (9.7%) and 18 of the single-parent households (6.0%) are living below the poverty level. Within the married-couple family households, those with 3 or 4 children have the highest poverty rate, with 163 households (52.9%) falling below the poverty line. Among the single-parent households, those with 3 or 4 children have the highest poverty rate, with 18 household (90.0%) living below poverty.
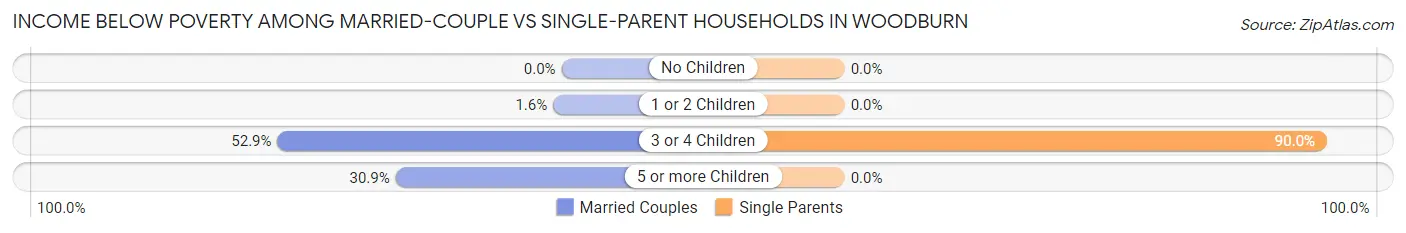
| Children | Married-Couple Families | Single-Parent Households |
| No Children | 0 (0.0%) | 0 (0.0%) |
| 1 or 2 Children | 12 (1.6%) | 0 (0.0%) |
| 3 or 4 Children | 163 (52.9%) | 18 (90.0%) |
| 5 or more Children | 17 (30.9%) | 0 (0.0%) |
| Total | 192 (9.7%) | 18 (6.0%) |
Race in Woodburn
The most populous races in Woodburn are White / Caucasian (5,561 | 55.8%), Asian (2,996 | 30.1%), and Hispanic or Latino (924 | 9.3%).
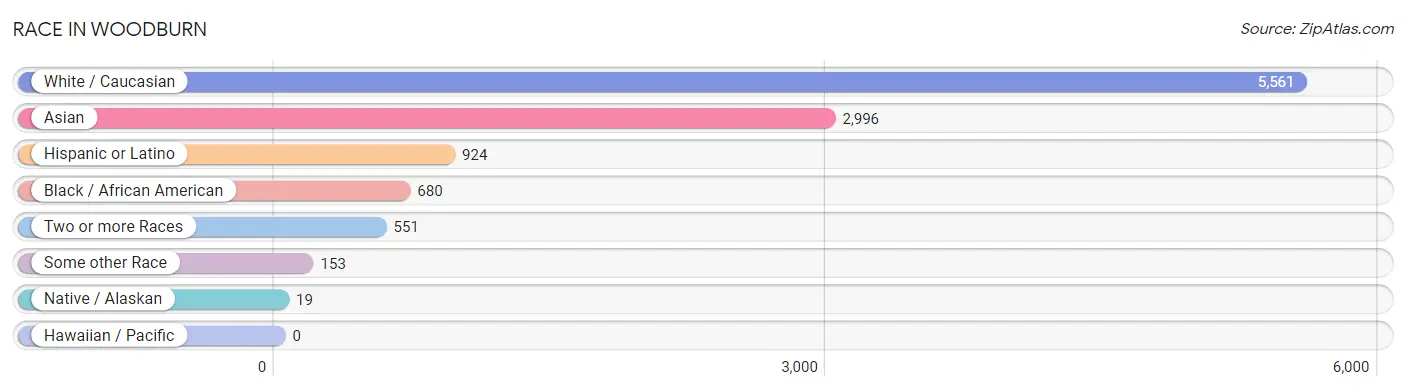
| Race | # Population | % Population |
| Asian | 2,996 | 30.1% |
| Black / African American | 680 | 6.8% |
| Hawaiian / Pacific | 0 | 0.0% |
| Hispanic or Latino | 924 | 9.3% |
| Native / Alaskan | 19 | 0.2% |
| White / Caucasian | 5,561 | 55.8% |
| Two or more Races | 551 | 5.5% |
| Some other Race | 153 | 1.5% |
| Total | 9,960 | 100.0% |
Ancestry in Woodburn
The most populous ancestries reported in Woodburn are English (883 | 8.9%), Korean (799 | 8.0%), German (788 | 7.9%), Arab (661 | 6.6%), and Irish (597 | 6.0%), together accounting for 37.4% of all Woodburn residents.
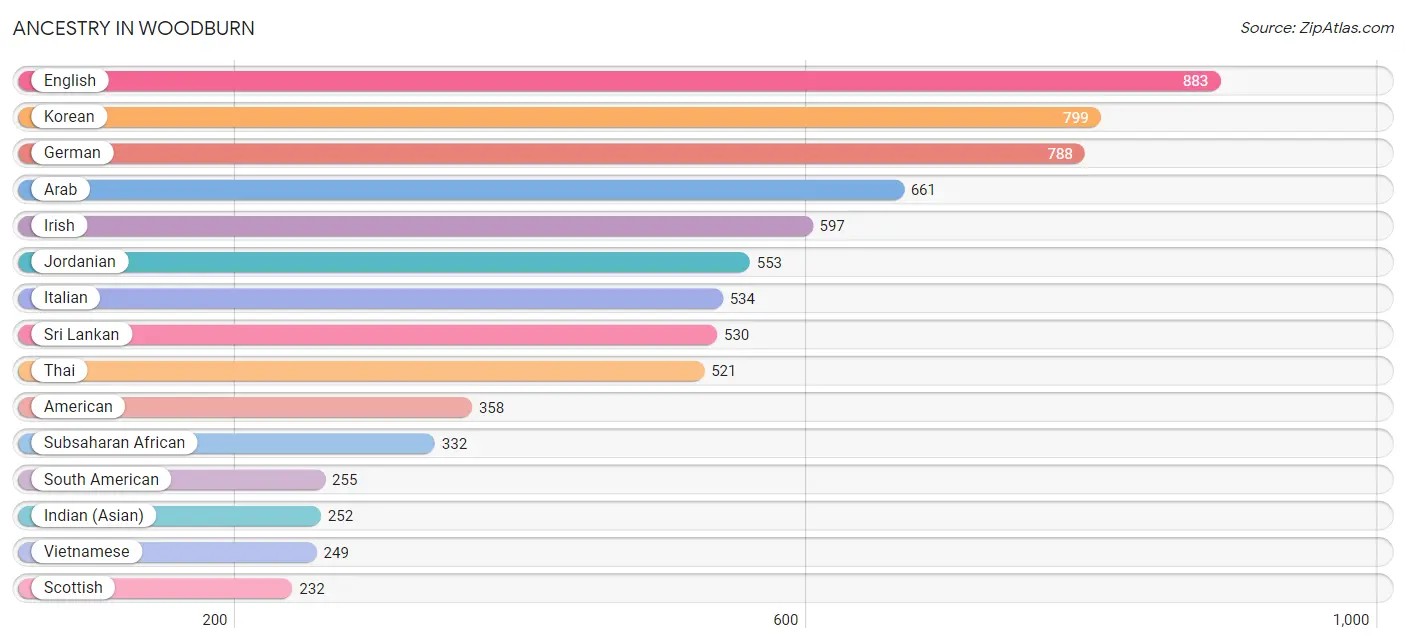
| Ancestry | # Population | % Population |
| Afghan | 196 | 2.0% |
| African | 122 | 1.2% |
| Albanian | 6 | 0.1% |
| American | 358 | 3.6% |
| Arab | 661 | 6.6% |
| Argentinean | 11 | 0.1% |
| Assyrian / Chaldean / Syriac | 4 | 0.0% |
| Austrian | 24 | 0.2% |
| Belgian | 78 | 0.8% |
| Bhutanese | 23 | 0.2% |
| Bolivian | 30 | 0.3% |
| British | 15 | 0.2% |
| Bulgarian | 161 | 1.6% |
| Burmese | 106 | 1.1% |
| Cajun | 5 | 0.1% |
| Canadian | 6 | 0.1% |
| Central American | 176 | 1.8% |
| Colombian | 76 | 0.8% |
| Creek | 24 | 0.2% |
| Croatian | 33 | 0.3% |
| Cuban | 213 | 2.1% |
| Czech | 17 | 0.2% |
| Czechoslovakian | 5 | 0.1% |
| Danish | 105 | 1.1% |
| Dominican | 12 | 0.1% |
| Dutch | 122 | 1.2% |
| Eastern European | 32 | 0.3% |
| Ecuadorian | 21 | 0.2% |
| English | 883 | 8.9% |
| Ethiopian | 25 | 0.3% |
| European | 120 | 1.2% |
| Filipino | 43 | 0.4% |
| French | 92 | 0.9% |
| French Canadian | 28 | 0.3% |
| German | 788 | 7.9% |
| Ghanaian | 7 | 0.1% |
| Greek | 25 | 0.3% |
| Guatemalan | 65 | 0.6% |
| Honduran | 1 | 0.0% |
| Hungarian | 59 | 0.6% |
| Indian (Asian) | 252 | 2.5% |
| Indonesian | 4 | 0.0% |
| Iranian | 141 | 1.4% |
| Irish | 597 | 6.0% |
| Italian | 534 | 5.4% |
| Jamaican | 2 | 0.0% |
| Jordanian | 553 | 5.6% |
| Kenyan | 42 | 0.4% |
| Korean | 799 | 8.0% |
| Lebanese | 103 | 1.0% |
| Lithuanian | 109 | 1.1% |
| Mexican | 96 | 1.0% |
| Native Hawaiian | 3 | 0.0% |
| Navajo | 2 | 0.0% |
| Northern European | 20 | 0.2% |
| Norwegian | 30 | 0.3% |
| Paraguayan | 34 | 0.3% |
| Peruvian | 83 | 0.8% |
| Polish | 221 | 2.2% |
| Portuguese | 19 | 0.2% |
| Puerto Rican | 122 | 1.2% |
| Romanian | 25 | 0.3% |
| Russian | 32 | 0.3% |
| Salvadoran | 110 | 1.1% |
| Scandinavian | 21 | 0.2% |
| Scotch-Irish | 24 | 0.2% |
| Scottish | 232 | 2.3% |
| Slavic | 146 | 1.5% |
| Slovak | 4 | 0.0% |
| Slovene | 10 | 0.1% |
| South American | 255 | 2.6% |
| Spaniard | 21 | 0.2% |
| Spanish | 12 | 0.1% |
| Sri Lankan | 530 | 5.3% |
| Subsaharan African | 332 | 3.3% |
| Swedish | 138 | 1.4% |
| Swiss | 6 | 0.1% |
| Thai | 521 | 5.2% |
| Ukrainian | 22 | 0.2% |
| Vietnamese | 249 | 2.5% |
| Welsh | 34 | 0.3% | View All 81 Rows |
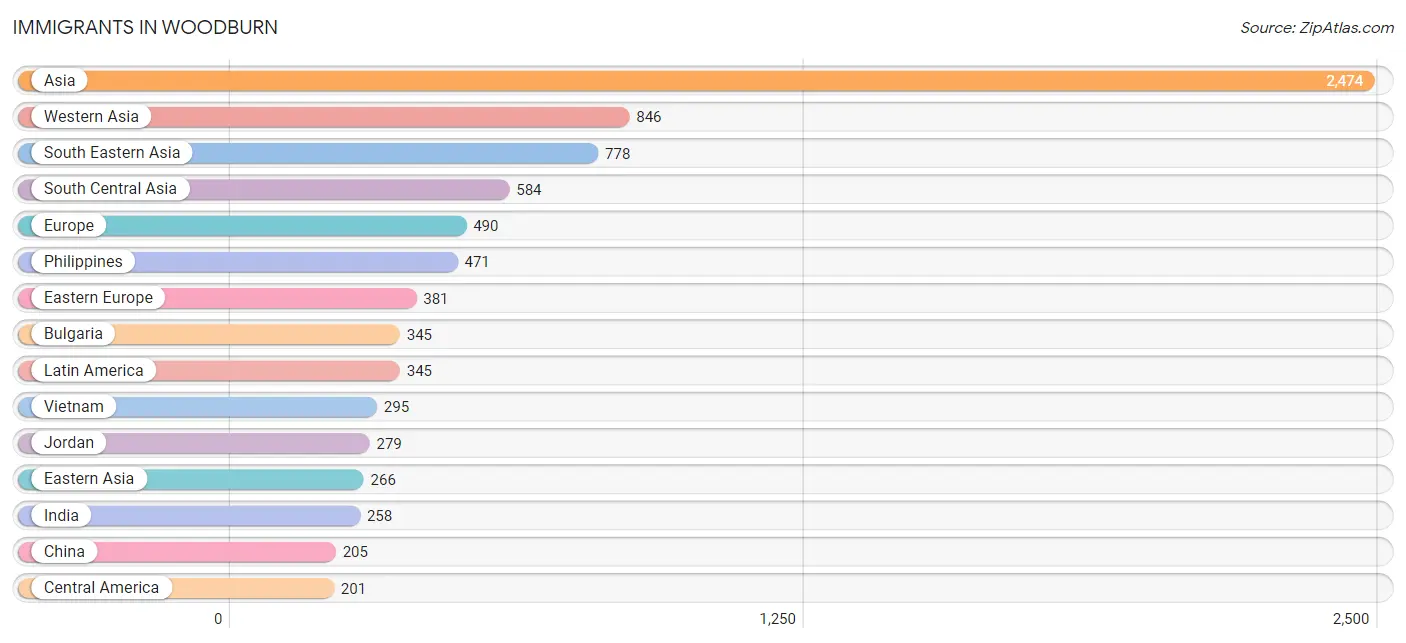
Immigrants in Woodburn
The most numerous immigrant groups reported in Woodburn came from Asia (2,474 | 24.8%), Western Asia (846 | 8.5%), South Eastern Asia (778 | 7.8%), South Central Asia (584 | 5.9%), and Europe (490 | 4.9%), together accounting for 51.9% of all Woodburn residents.
| Immigration Origin | # Population | % Population |
| Afghanistan | 161 | 1.6% |
| Africa | 165 | 1.7% |
| Albania | 6 | 0.1% |
| Argentina | 11 | 0.1% |
| Asia | 2,474 | 24.8% |
| Bangladesh | 38 | 0.4% |
| Bolivia | 11 | 0.1% |
| Bulgaria | 345 | 3.5% |
| Caribbean | 6 | 0.1% |
| Central America | 201 | 2.0% |
| China | 205 | 2.1% |
| Colombia | 13 | 0.1% |
| Denmark | 21 | 0.2% |
| Eastern Africa | 72 | 0.7% |
| Eastern Asia | 266 | 2.7% |
| Eastern Europe | 381 | 3.8% |
| Ecuador | 3 | 0.0% |
| El Salvador | 82 | 0.8% |
| England | 51 | 0.5% |
| Ethiopia | 20 | 0.2% |
| Europe | 490 | 4.9% |
| Greece | 25 | 0.3% |
| Guatemala | 23 | 0.2% |
| Hungary | 10 | 0.1% |
| India | 258 | 2.6% |
| Iran | 71 | 0.7% |
| Iraq | 4 | 0.0% |
| Ireland | 6 | 0.1% |
| Israel | 7 | 0.1% |
| Jamaica | 6 | 0.1% |
| Jordan | 279 | 2.8% |
| Kenya | 42 | 0.4% |
| Korea | 61 | 0.6% |
| Kuwait | 3 | 0.0% |
| Latin America | 345 | 3.5% |
| Lebanon | 21 | 0.2% |
| Mexico | 96 | 1.0% |
| Middle Africa | 62 | 0.6% |
| Morocco | 13 | 0.1% |
| Nepal | 14 | 0.1% |
| Northern Africa | 13 | 0.1% |
| Northern Europe | 84 | 0.8% |
| Pakistan | 42 | 0.4% |
| Peru | 59 | 0.6% |
| Philippines | 471 | 4.7% |
| Poland | 15 | 0.2% |
| Russia | 5 | 0.1% |
| Singapore | 8 | 0.1% |
| South America | 138 | 1.4% |
| South Central Asia | 584 | 5.9% |
| South Eastern Asia | 778 | 7.8% |
| Southern Europe | 25 | 0.3% |
| Sweden | 6 | 0.1% |
| Taiwan | 33 | 0.3% |
| Venezuela | 7 | 0.1% |
| Vietnam | 295 | 3.0% |
| Western Asia | 846 | 8.5% |
| Zaire | 36 | 0.4% |
| Zimbabwe | 10 | 0.1% | View All 59 Rows |
Sex and Age in Woodburn
Sex and Age in Woodburn
The most populous age groups in Woodburn are 5 to 9 Years (835 | 15.8%) for men and 25 to 29 Years (584 | 12.5%) for women.
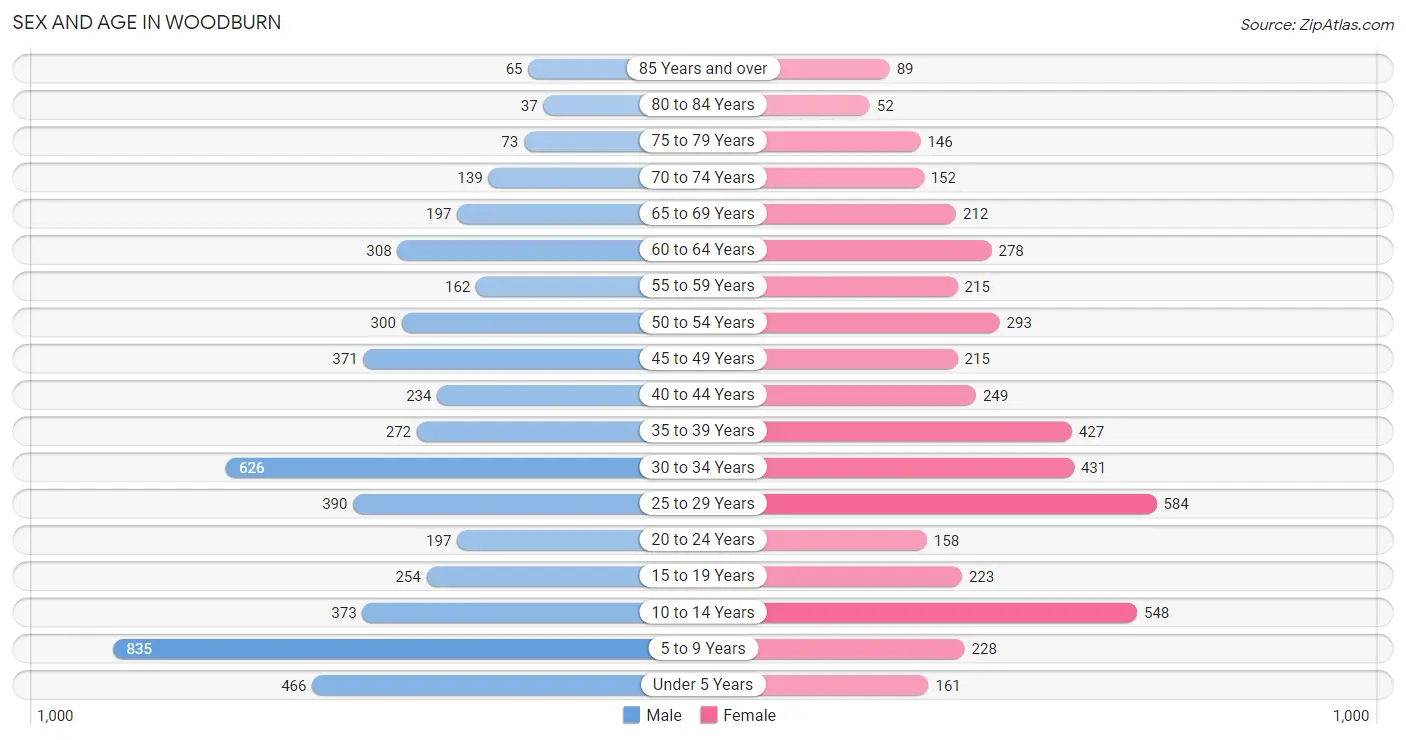
| Age Bracket | Male | Female |
| Under 5 Years | 466 (8.8%) | 161 (3.5%) |
| 5 to 9 Years | 835 (15.8%) | 228 (4.9%) |
| 10 to 14 Years | 373 (7.0%) | 548 (11.8%) |
| 15 to 19 Years | 254 (4.8%) | 223 (4.8%) |
| 20 to 24 Years | 197 (3.7%) | 158 (3.4%) |
| 25 to 29 Years | 390 (7.4%) | 584 (12.5%) |
| 30 to 34 Years | 626 (11.8%) | 431 (9.2%) |
| 35 to 39 Years | 272 (5.1%) | 427 (9.2%) |
| 40 to 44 Years | 234 (4.4%) | 249 (5.3%) |
| 45 to 49 Years | 371 (7.0%) | 215 (4.6%) |
| 50 to 54 Years | 300 (5.7%) | 293 (6.3%) |
| 55 to 59 Years | 162 (3.1%) | 215 (4.6%) |
| 60 to 64 Years | 308 (5.8%) | 278 (6.0%) |
| 65 to 69 Years | 197 (3.7%) | 212 (4.5%) |
| 70 to 74 Years | 139 (2.6%) | 152 (3.3%) |
| 75 to 79 Years | 73 (1.4%) | 146 (3.1%) |
| 80 to 84 Years | 37 (0.7%) | 52 (1.1%) |
| 85 Years and over | 65 (1.2%) | 89 (1.9%) |
| Total | 5,299 (100.0%) | 4,661 (100.0%) |
Families and Households in Woodburn
Median Family Size in Woodburn
The median family size in Woodburn is 3.60 persons per family, with single female/mother families (223 | 9.8%) accounting for the largest median family size of 3.87 persons per family. On the other hand, single male/father families (79 | 3.5%) represent the smallest median family size with 2.29 persons per family.
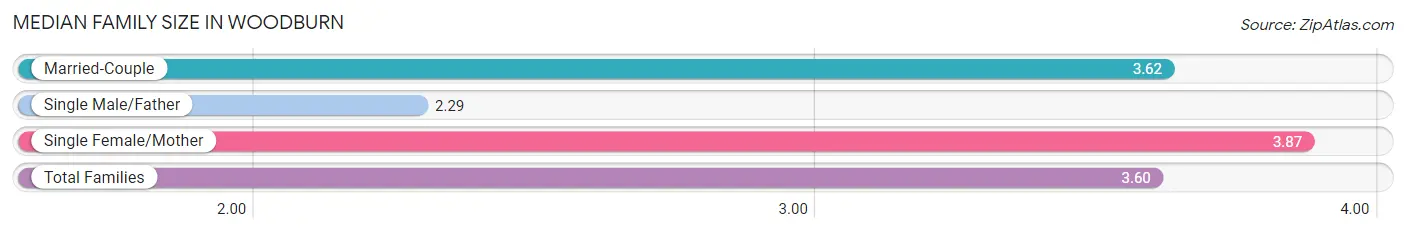
| Family Type | # Families | Family Size |
| Married-Couple | 1,977 (86.8%) | 3.62 |
| Single Male/Father | 79 (3.5%) | 2.29 |
| Single Female/Mother | 223 (9.8%) | 3.87 |
| Total Families | 2,279 (100.0%) | 3.60 |
Median Household Size in Woodburn
The median household size in Woodburn is 3.07 persons per household, with single female/mother households (223 | 7.0%) accounting for the largest median household size of 3.97 persons per household. non-family households (895 | 28.2%) represent the smallest median household size with 1.66 persons per household.
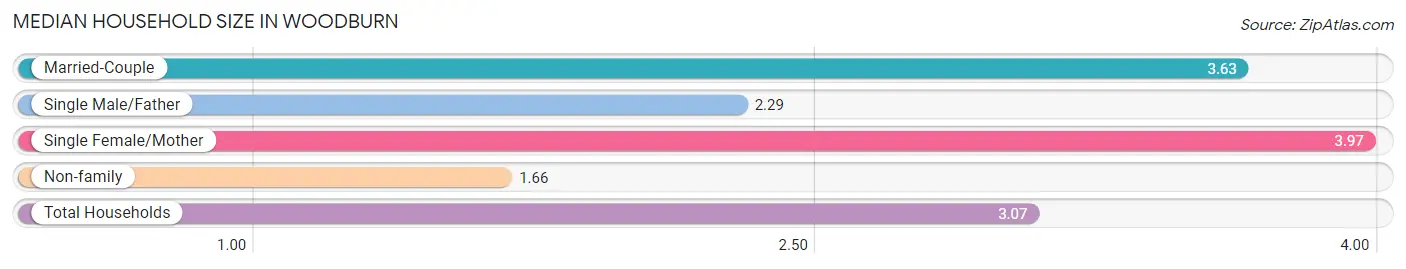
| Household Type | # Households | Household Size |
| Married-Couple | 1,977 (62.3%) | 3.63 |
| Single Male/Father | 79 (2.5%) | 2.29 |
| Single Female/Mother | 223 (7.0%) | 3.97 |
| Non-family | 895 (28.2%) | 1.66 |
| Total Households | 3,174 (100.0%) | 3.07 |
Household Size by Marriage Status in Woodburn
Out of a total of 3,174 households in Woodburn, 2,279 (71.8%) are family households, while 895 (28.2%) are nonfamily households. The most numerous type of family households are 2-person households, comprising 707, and the most common type of nonfamily households are 1-person households, comprising 560.
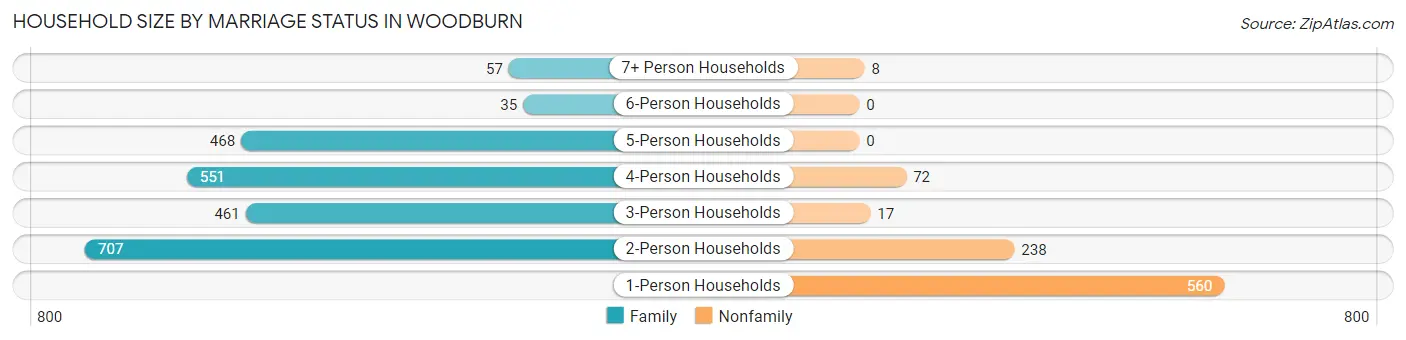
| Household Size | Family Households | Nonfamily Households |
| 1-Person Households | - | 560 (17.6%) |
| 2-Person Households | 707 (22.3%) | 238 (7.5%) |
| 3-Person Households | 461 (14.5%) | 17 (0.5%) |
| 4-Person Households | 551 (17.4%) | 72 (2.3%) |
| 5-Person Households | 468 (14.7%) | 0 (0.0%) |
| 6-Person Households | 35 (1.1%) | 0 (0.0%) |
| 7+ Person Households | 57 (1.8%) | 8 (0.3%) |
| Total | 2,279 (71.8%) | 895 (28.2%) |
Female Fertility in Woodburn
Fertility by Age in Woodburn
Average fertility rate in Woodburn is 45.0 births per 1,000 women. Women in the age bracket of 20 to 34 years have the highest fertility rate with 60.0 births per 1,000 women. Women in the age bracket of 20 to 34 years acount for 68.0% of all women with births.
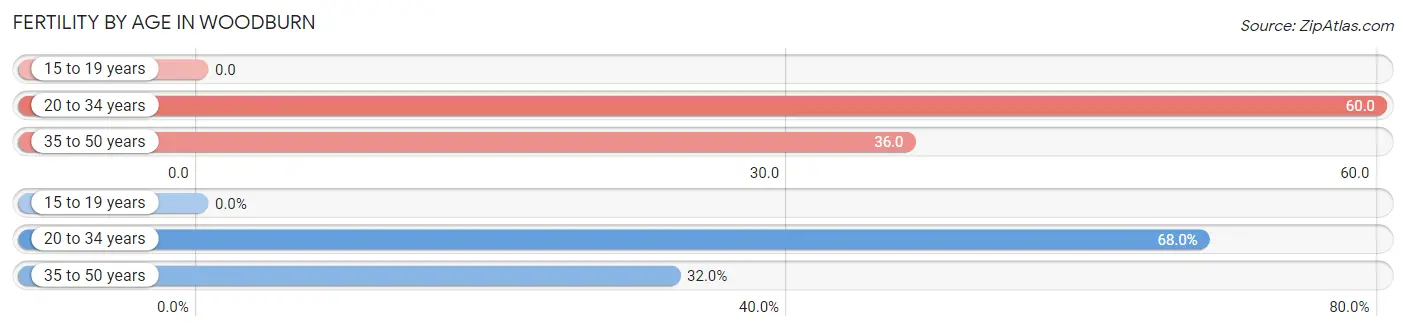
| Age Bracket | Women with Births | Births / 1,000 Women |
| 15 to 19 years | 0 (0.0%) | 0.0 |
| 20 to 34 years | 70 (68.0%) | 60.0 |
| 35 to 50 years | 33 (32.0%) | 36.0 |
| Total | 103 (100.0%) | 45.0 |
Fertility by Age by Marriage Status in Woodburn
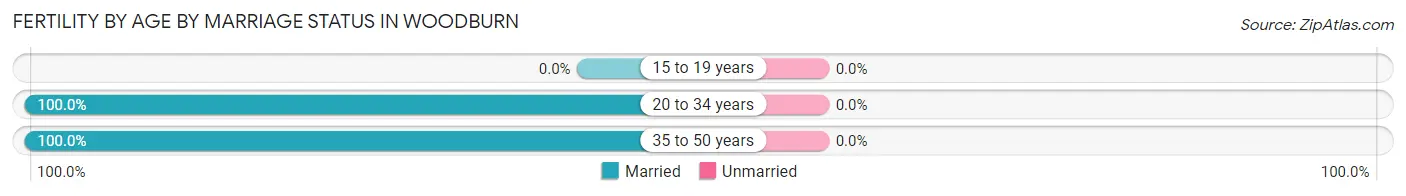
| Age Bracket | Married | Unmarried |
| 15 to 19 years | 0 (0.0%) | 0 (0.0%) |
| 20 to 34 years | 70 (100.0%) | 0 (0.0%) |
| 35 to 50 years | 33 (100.0%) | 0 (0.0%) |
| Total | 103 (100.0%) | 0 (0.0%) |
Fertility by Education in Woodburn
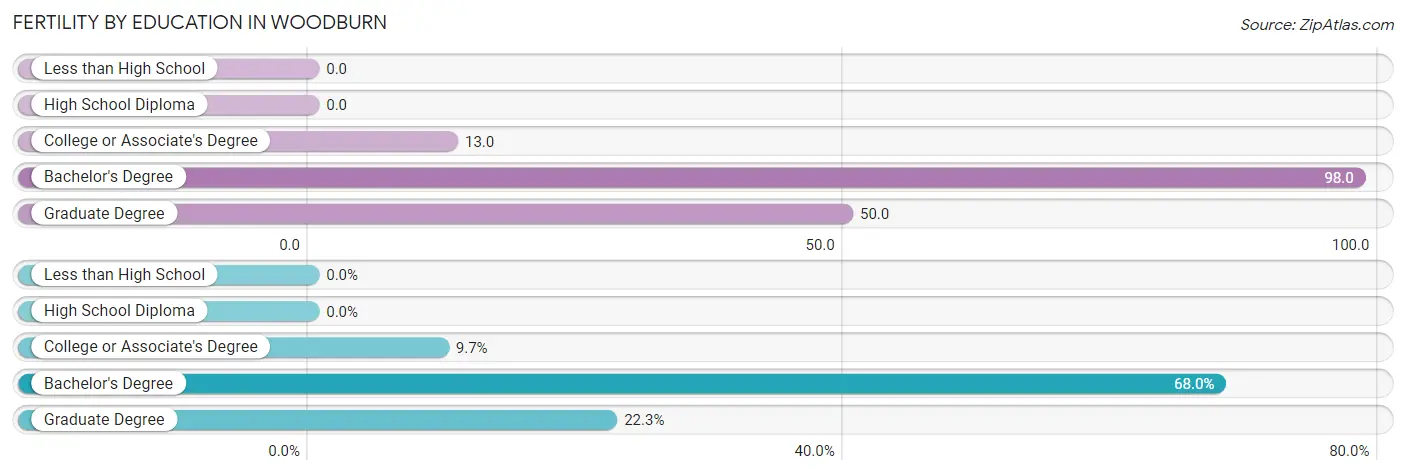
| Educational Attainment | Women with Births | Births / 1,000 Women |
| Less than High School | 0 (0.0%) | 0.0 |
| High School Diploma | 0 (0.0%) | 0.0 |
| College or Associate's Degree | 10 (9.7%) | 13.0 |
| Bachelor's Degree | 70 (68.0%) | 98.0 |
| Graduate Degree | 23 (22.3%) | 50.0 |
| Total | 103 (100.0%) | 45.0 |
Fertility by Education by Marriage Status in Woodburn
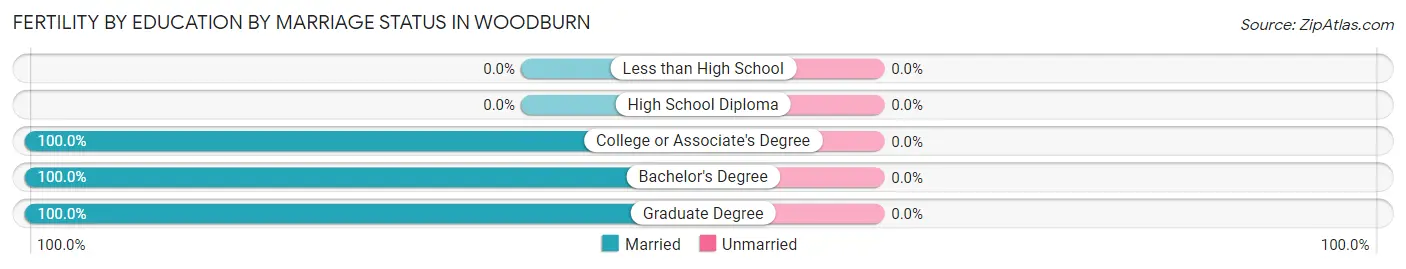
| Educational Attainment | Married | Unmarried |
| Less than High School | 0 (0.0%) | 0 (0.0%) |
| High School Diploma | 0 (0.0%) | 0 (0.0%) |
| College or Associate's Degree | 10 (100.0%) | 0 (0.0%) |
| Bachelor's Degree | 70 (100.0%) | 0 (0.0%) |
| Graduate Degree | 23 (100.0%) | 0 (0.0%) |
| Total | 103 (100.0%) | 0 (0.0%) |
Employment Characteristics in Woodburn
Employment by Class of Employer in Woodburn
Among the 4,883 employed individuals in Woodburn, private company employees (3,171 | 64.9%), federal government employees (656 | 13.4%), and not-for-profit organizations (384 | 7.9%) make up the most common classes of employment.
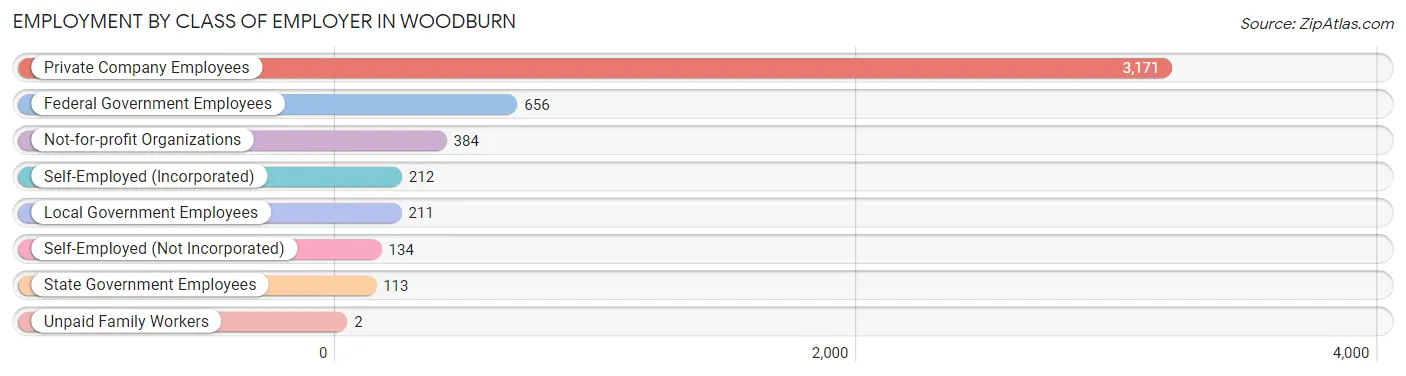
| Employer Class | # Employees | % Employees |
| Private Company Employees | 3,171 | 64.9% |
| Self-Employed (Incorporated) | 212 | 4.3% |
| Self-Employed (Not Incorporated) | 134 | 2.7% |
| Not-for-profit Organizations | 384 | 7.9% |
| Local Government Employees | 211 | 4.3% |
| State Government Employees | 113 | 2.3% |
| Federal Government Employees | 656 | 13.4% |
| Unpaid Family Workers | 2 | 0.0% |
| Total | 4,883 | 100.0% |
Employment Status by Age in Woodburn
According to the labor force statistics for Woodburn, out of the total population over 16 years of age (7,314), 69.4% or 5,076 individuals are in the labor force, with 3.0% or 152 of them unemployed. The age group with the highest labor force participation rate is 45 to 54 years, with 89.7% or 1,058 individuals in the labor force. Within the labor force, the 25 to 29 years age range has the highest percentage of unemployed individuals, with 8.2% or 67 of them being unemployed.
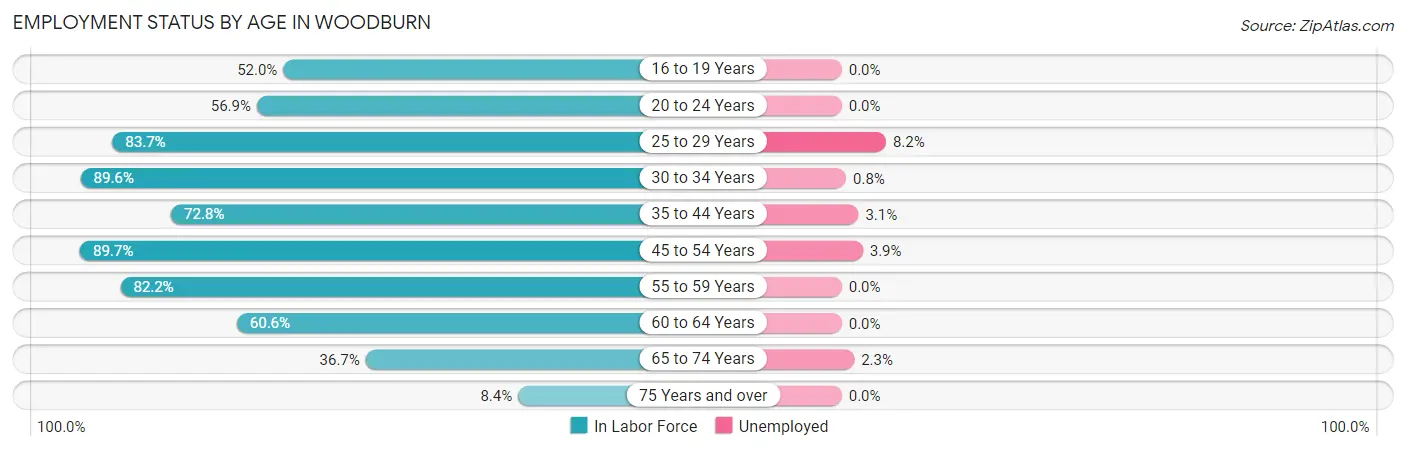
| Age Bracket | In Labor Force | Unemployed |
| 16 to 19 Years | 230 (52.0%) | 0 (0.0%) |
| 20 to 24 Years | 202 (56.9%) | 0 (0.0%) |
| 25 to 29 Years | 815 (83.7%) | 67 (8.2%) |
| 30 to 34 Years | 947 (89.6%) | 8 (0.8%) |
| 35 to 44 Years | 860 (72.8%) | 27 (3.1%) |
| 45 to 54 Years | 1,058 (89.7%) | 41 (3.9%) |
| 55 to 59 Years | 310 (82.2%) | 0 (0.0%) |
| 60 to 64 Years | 355 (60.6%) | 0 (0.0%) |
| 65 to 74 Years | 257 (36.7%) | 6 (2.3%) |
| 75 Years and over | 39 (8.4%) | 0 (0.0%) |
| Total | 5,076 (69.4%) | 152 (3.0%) |
Employment Status by Educational Attainment in Woodburn
According to labor force statistics for Woodburn, 81.2% of individuals (4,348) out of the total population between 25 and 64 years of age (5,355) are in the labor force, with 3.3% or 143 of them being unemployed. The group with the highest labor force participation rate are those with the educational attainment of bachelor's degree or higher, with 88.7% or 2,941 individuals in the labor force. Within the labor force, individuals with less than high school education have the highest percentage of unemployment, with 26.9% or 7 of them being unemployed.
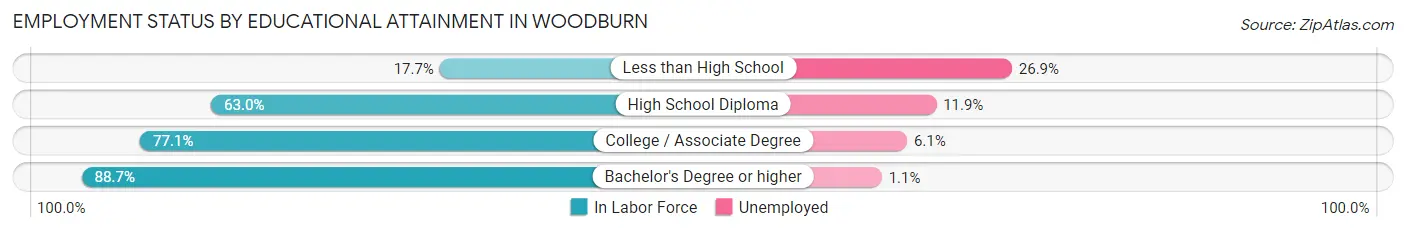
| Educational Attainment | In Labor Force | Unemployed |
| Less than High School | 26 (17.7%) | 40 (26.9%) |
| High School Diploma | 353 (63.0%) | 67 (11.9%) |
| College / Associate Degree | 1,027 (77.1%) | 81 (6.1%) |
| Bachelor's Degree or higher | 2,941 (88.7%) | 36 (1.1%) |
| Total | 4,348 (81.2%) | 177 (3.3%) |
Employment Occupations by Sex in Woodburn
Management, Business, Science and Arts Occupations
The most common Management, Business, Science and Arts occupations in Woodburn are Computers, Engineering & Science (900 | 18.8%), Management (756 | 15.8%), Computers & Mathematics (679 | 14.2%), Community & Social Service (678 | 14.1%), and Business & Financial (622 | 13.0%).
Management, Business, Science and Arts Occupations by Sex
Within the Management, Business, Science and Arts occupations in Woodburn, the most male-oriented occupations are Architecture & Engineering (92.4%), Business & Financial (66.4%), and Computers, Engineering & Science (56.4%), while the most female-oriented occupations are Education, Arts & Media (86.7%), Health Technologists (76.7%), and Life, Physical & Social Science (76.7%).
| Occupation | Male | Female |
| Management | 329 (43.5%) | 427 (56.5%) |
| Business & Financial | 413 (66.4%) | 209 (33.6%) |
| Computers, Engineering & Science | 508 (56.4%) | 392 (43.6%) |
| Computers & Mathematics | 366 (53.9%) | 313 (46.1%) |
| Architecture & Engineering | 121 (92.4%) | 10 (7.6%) |
| Life, Physical & Social Science | 21 (23.3%) | 69 (76.7%) |
| Community & Social Service | 235 (34.7%) | 443 (65.3%) |
| Education, Arts & Media | 21 (13.3%) | 137 (86.7%) |
| Legal Services & Support | 84 (46.7%) | 96 (53.3%) |
| Education Instruction & Library | 85 (37.4%) | 142 (62.6%) |
| Arts, Media & Entertainment | 45 (39.8%) | 68 (60.2%) |
| Health Diagnosing & Treating | 111 (39.1%) | 173 (60.9%) |
| Health Technologists | 52 (23.3%) | 171 (76.7%) |
| Total (Category) | 1,596 (49.3%) | 1,644 (50.7%) |
| Total (Overall) | 2,516 (52.5%) | 2,280 (47.5%) |
Services Occupations
The most common Services occupations in Woodburn are Food Preparation & Serving (230 | 4.8%), Healthcare Support (163 | 3.4%), Personal Care & Service (133 | 2.8%), Cleaning & Maintenance (69 | 1.4%), and Security & Protection (11 | 0.2%).
Services Occupations by Sex
Within the Services occupations in Woodburn, the most male-oriented occupations are Firefighting & Prevention (100.0%), Cleaning & Maintenance (98.6%), and Security & Protection (72.7%), while the most female-oriented occupations are Law Enforcement (100.0%), Personal Care & Service (87.2%), and Healthcare Support (58.3%).
| Occupation | Male | Female |
| Healthcare Support | 68 (41.7%) | 95 (58.3%) |
| Security & Protection | 8 (72.7%) | 3 (27.3%) |
| Firefighting & Prevention | 8 (100.0%) | 0 (0.0%) |
| Law Enforcement | 0 (0.0%) | 3 (100.0%) |
| Food Preparation & Serving | 132 (57.4%) | 98 (42.6%) |
| Cleaning & Maintenance | 68 (98.6%) | 1 (1.5%) |
| Personal Care & Service | 17 (12.8%) | 116 (87.2%) |
| Total (Category) | 293 (48.3%) | 313 (51.6%) |
| Total (Overall) | 2,516 (52.5%) | 2,280 (47.5%) |
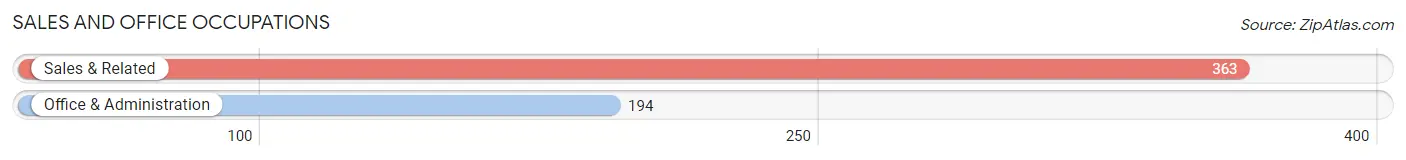
Sales and Office Occupations
The most common Sales and Office occupations in Woodburn are Sales & Related (363 | 7.6%), and Office & Administration (194 | 4.1%).
Sales and Office Occupations by Sex
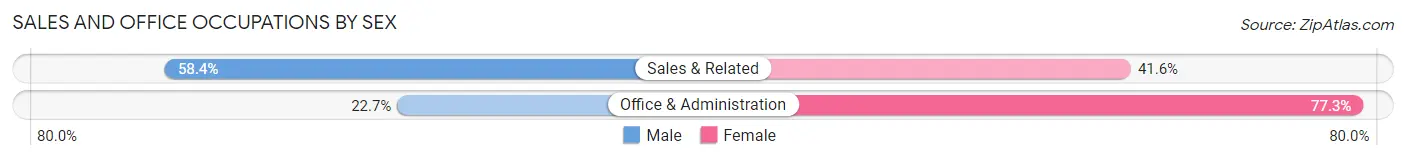
| Occupation | Male | Female |
| Sales & Related | 212 (58.4%) | 151 (41.6%) |
| Office & Administration | 44 (22.7%) | 150 (77.3%) |
| Total (Category) | 256 (46.0%) | 301 (54.0%) |
| Total (Overall) | 2,516 (52.5%) | 2,280 (47.5%) |
Natural Resources, Construction and Maintenance Occupations
The most common Natural Resources, Construction and Maintenance occupations in Woodburn are Installation, Maintenance & Repair (143 | 3.0%), and Construction & Extraction (2 | 0.0%).
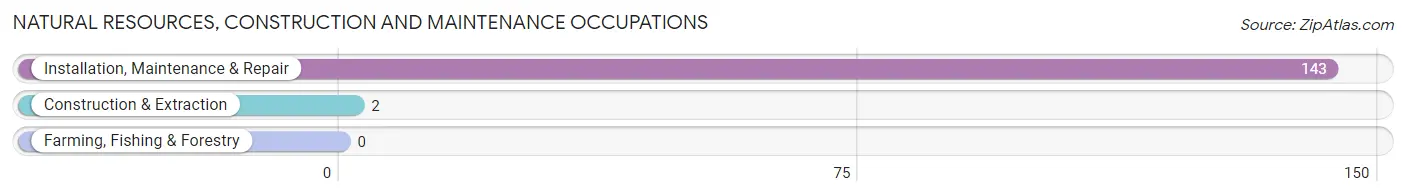
Natural Resources, Construction and Maintenance Occupations by Sex
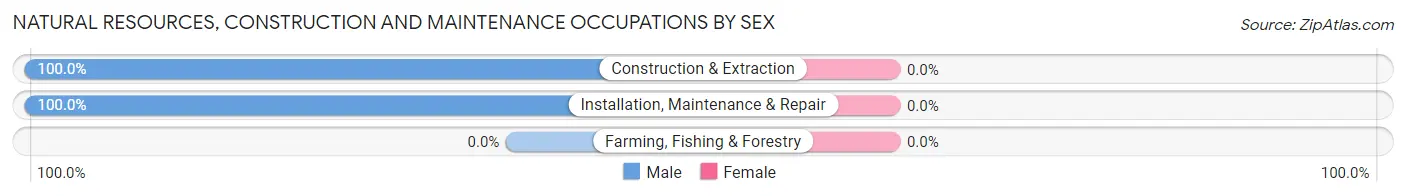
| Occupation | Male | Female |
| Farming, Fishing & Forestry | 0 (0.0%) | 0 (0.0%) |
| Construction & Extraction | 2 (100.0%) | 0 (0.0%) |
| Installation, Maintenance & Repair | 143 (100.0%) | 0 (0.0%) |
| Total (Category) | 145 (100.0%) | 0 (0.0%) |
| Total (Overall) | 2,516 (52.5%) | 2,280 (47.5%) |
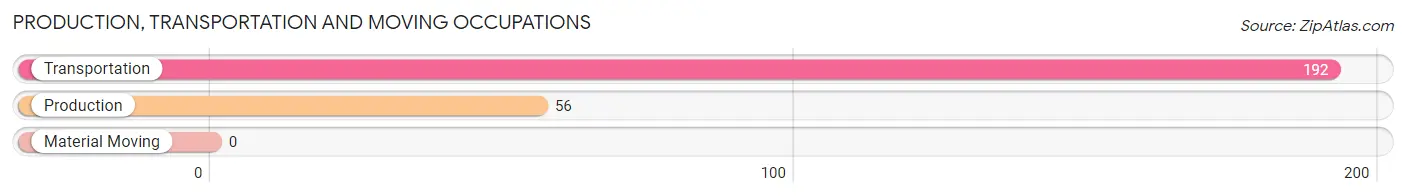
Production, Transportation and Moving Occupations
The most common Production, Transportation and Moving occupations in Woodburn are Transportation (192 | 4.0%), and Production (56 | 1.2%).
Production, Transportation and Moving Occupations by Sex
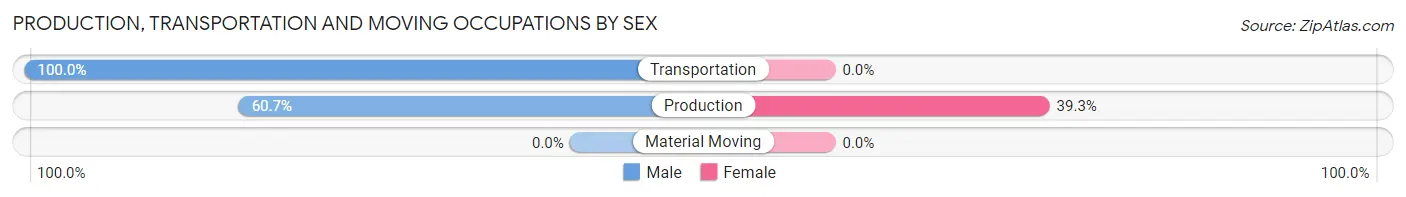
| Occupation | Male | Female |
| Production | 34 (60.7%) | 22 (39.3%) |
| Transportation | 192 (100.0%) | 0 (0.0%) |
| Material Moving | 0 (0.0%) | 0 (0.0%) |
| Total (Category) | 226 (91.1%) | 22 (8.9%) |
| Total (Overall) | 2,516 (52.5%) | 2,280 (47.5%) |
Employment Industries by Sex in Woodburn
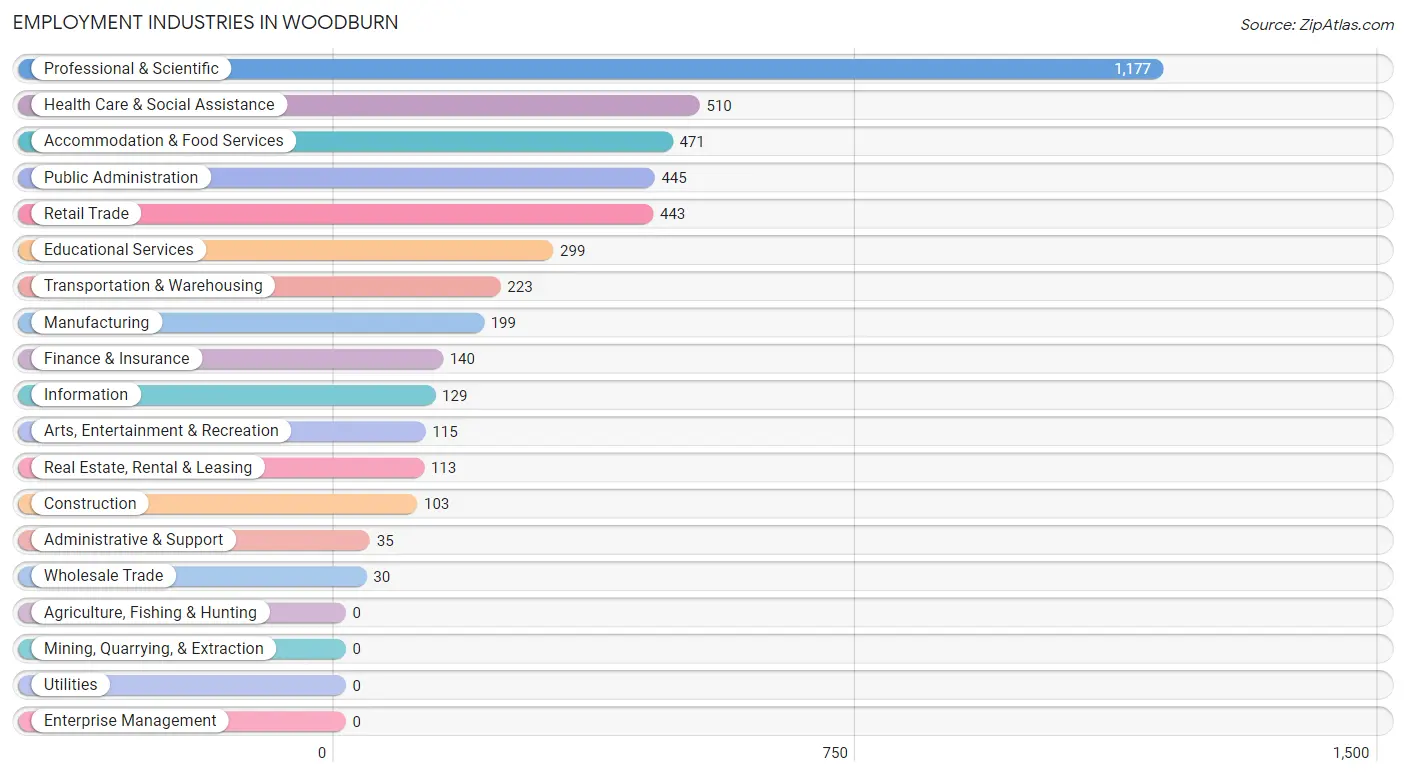
Employment Industries in Woodburn
The major employment industries in Woodburn include Professional & Scientific (1,177 | 24.5%), Health Care & Social Assistance (510 | 10.6%), Accommodation & Food Services (471 | 9.8%), Public Administration (445 | 9.3%), and Retail Trade (443 | 9.2%).
Employment Industries by Sex in Woodburn
The Woodburn industries that see more men than women are Construction (100.0%), Transportation & Warehousing (100.0%), and Information (95.4%), whereas the industries that tend to have a higher number of women are Health Care & Social Assistance (74.3%), Educational Services (72.9%), and Public Administration (65.4%).
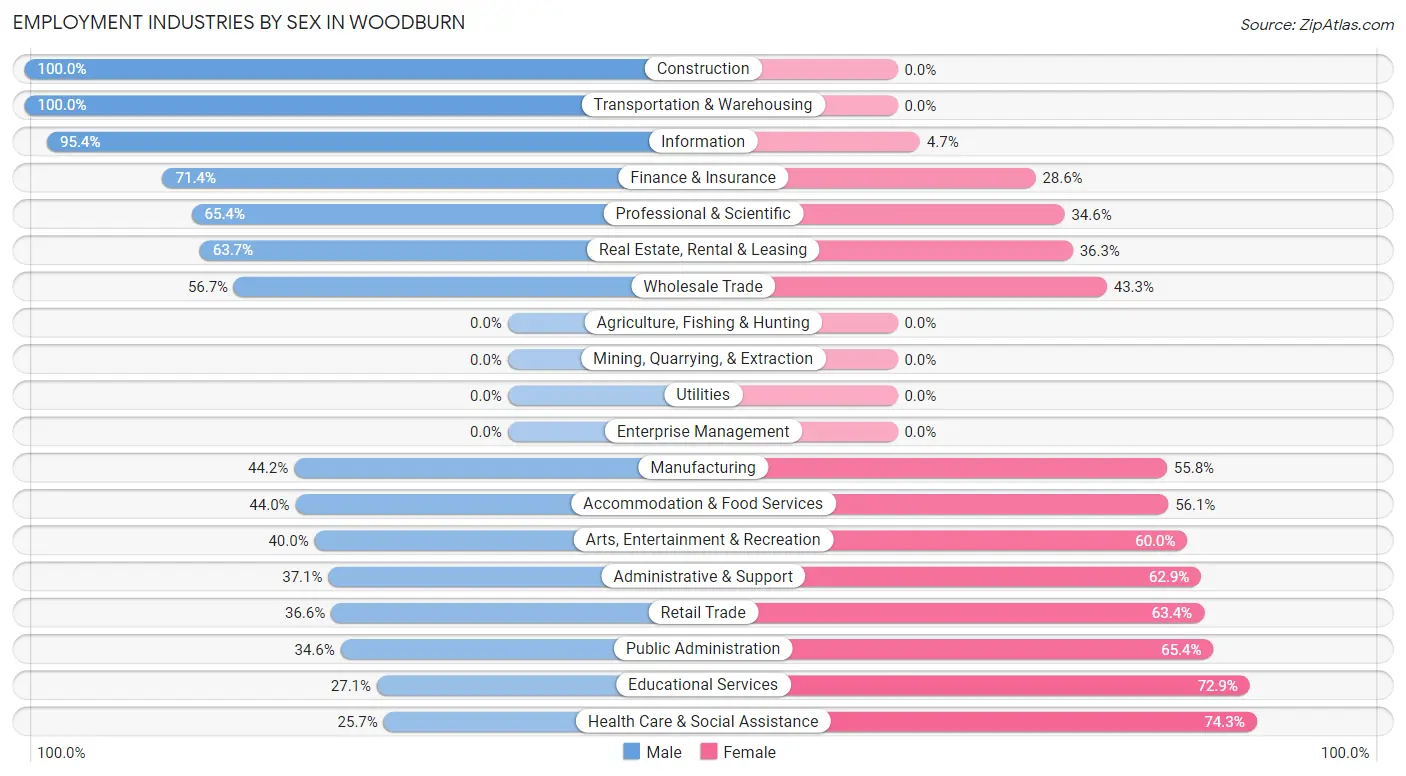
| Industry | Male | Female |
| Agriculture, Fishing & Hunting | 0 (0.0%) | 0 (0.0%) |
| Mining, Quarrying, & Extraction | 0 (0.0%) | 0 (0.0%) |
| Construction | 103 (100.0%) | 0 (0.0%) |
| Manufacturing | 88 (44.2%) | 111 (55.8%) |
| Wholesale Trade | 17 (56.7%) | 13 (43.3%) |
| Retail Trade | 162 (36.6%) | 281 (63.4%) |
| Transportation & Warehousing | 223 (100.0%) | 0 (0.0%) |
| Utilities | 0 (0.0%) | 0 (0.0%) |
| Information | 123 (95.4%) | 6 (4.6%) |
| Finance & Insurance | 100 (71.4%) | 40 (28.6%) |
| Real Estate, Rental & Leasing | 72 (63.7%) | 41 (36.3%) |
| Professional & Scientific | 770 (65.4%) | 407 (34.6%) |
| Enterprise Management | 0 (0.0%) | 0 (0.0%) |
| Administrative & Support | 13 (37.1%) | 22 (62.9%) |
| Educational Services | 81 (27.1%) | 218 (72.9%) |
| Health Care & Social Assistance | 131 (25.7%) | 379 (74.3%) |
| Arts, Entertainment & Recreation | 46 (40.0%) | 69 (60.0%) |
| Accommodation & Food Services | 207 (44.0%) | 264 (56.0%) |
| Public Administration | 154 (34.6%) | 291 (65.4%) |
| Total | 2,516 (52.5%) | 2,280 (47.5%) |
Education in Woodburn
School Enrollment in Woodburn
The most common levels of schooling among the 2,996 students in Woodburn are middle school (787 | 26.3%), elementary school (629 | 21.0%), and high school (482 | 16.1%).
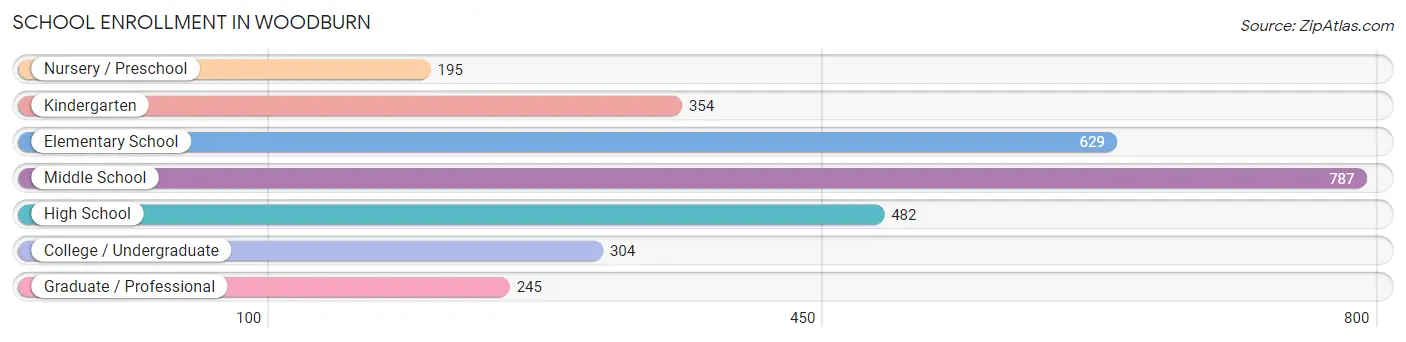
| School Level | # Students | % Students |
| Nursery / Preschool | 195 | 6.5% |
| Kindergarten | 354 | 11.8% |
| Elementary School | 629 | 21.0% |
| Middle School | 787 | 26.3% |
| High School | 482 | 16.1% |
| College / Undergraduate | 304 | 10.2% |
| Graduate / Professional | 245 | 8.2% |
| Total | 2,996 | 100.0% |
School Enrollment by Age by Funding Source in Woodburn
Out of a total of 2,996 students who are enrolled in schools in Woodburn, 686 (22.9%) attend a private institution, while the remaining 2,310 (77.1%) are enrolled in public schools. The age group of 35 years and over has the highest likelihood of being enrolled in private schools, with 68 (100.0% in the age bracket) enrolled. Conversely, the age group of 18 to 19 year olds has the lowest likelihood of being enrolled in a private school, with 218 (100.0% in the age bracket) attending a public institution.
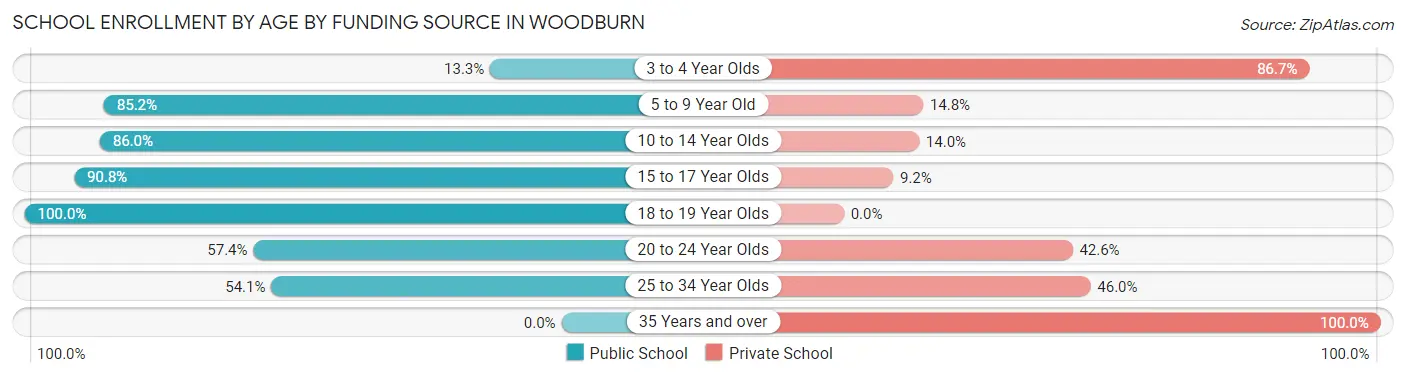
| Age Bracket | Public School | Private School |
| 3 to 4 Year Olds | 19 (13.3%) | 124 (86.7%) |
| 5 to 9 Year Old | 808 (85.2%) | 140 (14.8%) |
| 10 to 14 Year Olds | 792 (86.0%) | 129 (14.0%) |
| 15 to 17 Year Olds | 227 (90.8%) | 23 (9.2%) |
| 18 to 19 Year Olds | 218 (100.0%) | 0 (0.0%) |
| 20 to 24 Year Olds | 66 (57.4%) | 49 (42.6%) |
| 25 to 34 Year Olds | 180 (54.0%) | 153 (46.0%) |
| 35 Years and over | 0 (0.0%) | 68 (100.0%) |
| Total | 2,310 (77.1%) | 686 (22.9%) |
Educational Attainment by Field of Study in Woodburn
Social sciences (742 | 16.9%), business (718 | 16.4%), engineering (506 | 11.5%), computers & mathematics (382 | 8.7%), and education (306 | 7.0%) are the most common fields of study among 4,387 individuals in Woodburn who have obtained a bachelor's degree or higher.
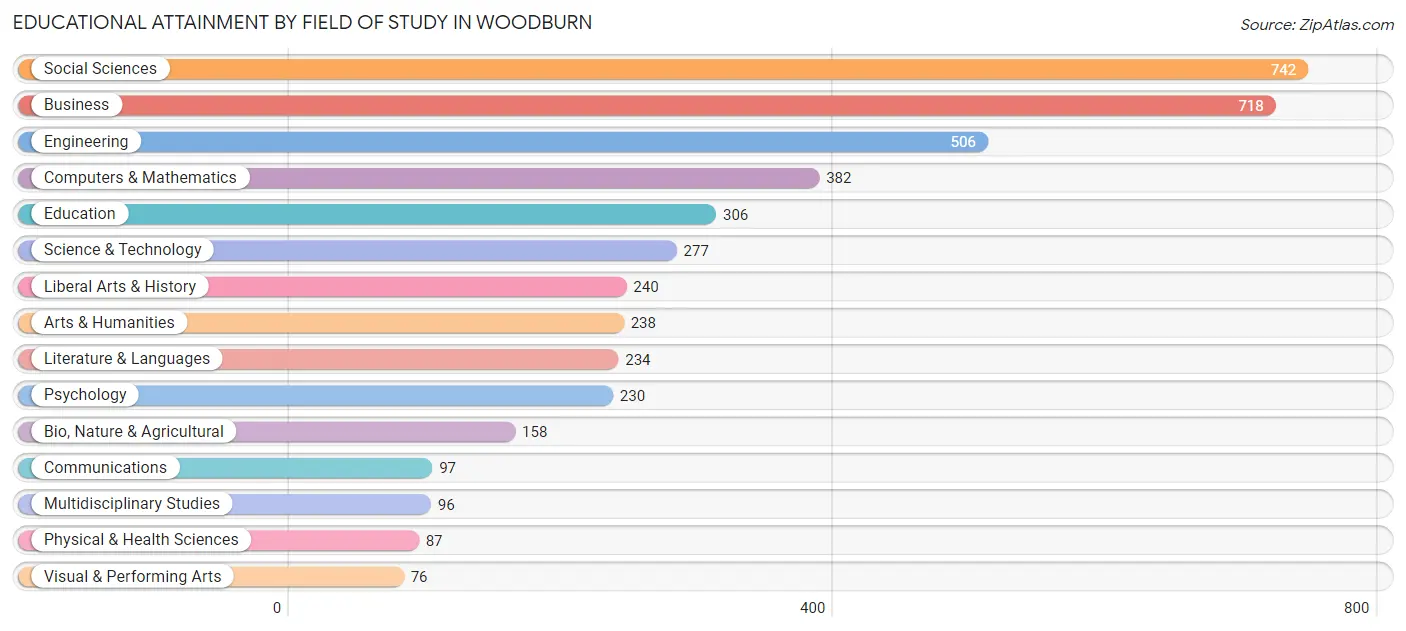
| Field of Study | # Graduates | % Graduates |
| Computers & Mathematics | 382 | 8.7% |
| Bio, Nature & Agricultural | 158 | 3.6% |
| Physical & Health Sciences | 87 | 2.0% |
| Psychology | 230 | 5.2% |
| Social Sciences | 742 | 16.9% |
| Engineering | 506 | 11.5% |
| Multidisciplinary Studies | 96 | 2.2% |
| Science & Technology | 277 | 6.3% |
| Business | 718 | 16.4% |
| Education | 306 | 7.0% |
| Literature & Languages | 234 | 5.3% |
| Liberal Arts & History | 240 | 5.5% |
| Visual & Performing Arts | 76 | 1.7% |
| Communications | 97 | 2.2% |
| Arts & Humanities | 238 | 5.4% |
| Total | 4,387 | 100.0% |
Transportation & Commute in Woodburn
Vehicle Availability by Sex in Woodburn
The most prevalent vehicle ownership categories in Woodburn are males with 2 vehicles (1,403, accounting for 53.5%) and females with 2 vehicles (1,130, making up 62.1%).
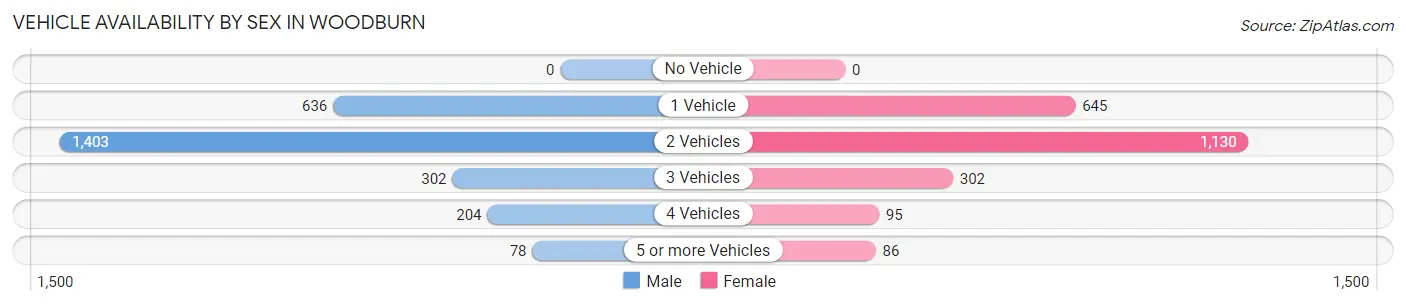
| Vehicles Available | Male | Female |
| No Vehicle | 0 (0.0%) | 0 (0.0%) |
| 1 Vehicle | 636 (24.2%) | 645 (28.6%) |
| 2 Vehicles | 1,403 (53.5%) | 1,130 (50.0%) |
| 3 Vehicles | 302 (11.5%) | 302 (13.4%) |
| 4 Vehicles | 204 (7.8%) | 95 (4.2%) |
| 5 or more Vehicles | 78 (3.0%) | 86 (3.8%) |
| Total | 2,623 (100.0%) | 2,258 (100.0%) |
Commute Time in Woodburn
The most frequently occuring commute durations in Woodburn are 15 to 19 minutes (587 commuters, 16.0%), 20 to 24 minutes (534 commuters, 14.6%), and 30 to 34 minutes (446 commuters, 12.2%).
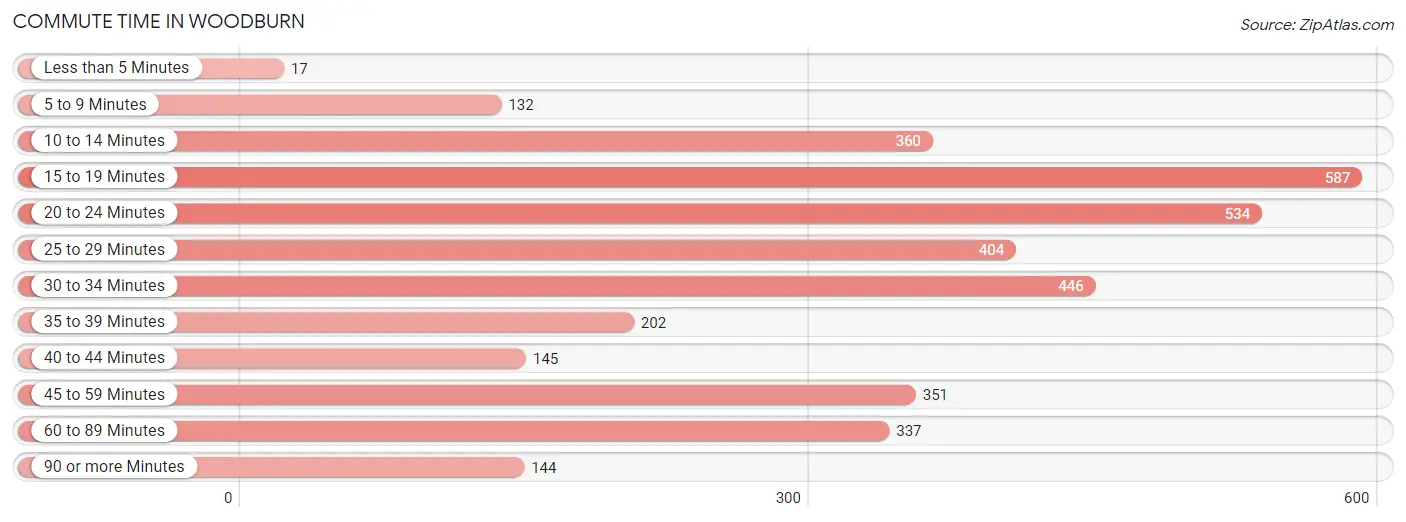
| Commute Time | # Commuters | % Commuters |
| Less than 5 Minutes | 17 | 0.5% |
| 5 to 9 Minutes | 132 | 3.6% |
| 10 to 14 Minutes | 360 | 9.8% |
| 15 to 19 Minutes | 587 | 16.0% |
| 20 to 24 Minutes | 534 | 14.6% |
| 25 to 29 Minutes | 404 | 11.0% |
| 30 to 34 Minutes | 446 | 12.2% |
| 35 to 39 Minutes | 202 | 5.5% |
| 40 to 44 Minutes | 145 | 4.0% |
| 45 to 59 Minutes | 351 | 9.6% |
| 60 to 89 Minutes | 337 | 9.2% |
| 90 or more Minutes | 144 | 3.9% |
Commute Time by Sex in Woodburn
The most common commute times in Woodburn are 30 to 34 minutes (350 commuters, 18.5%) for males and 15 to 19 minutes (357 commuters, 20.2%) for females.
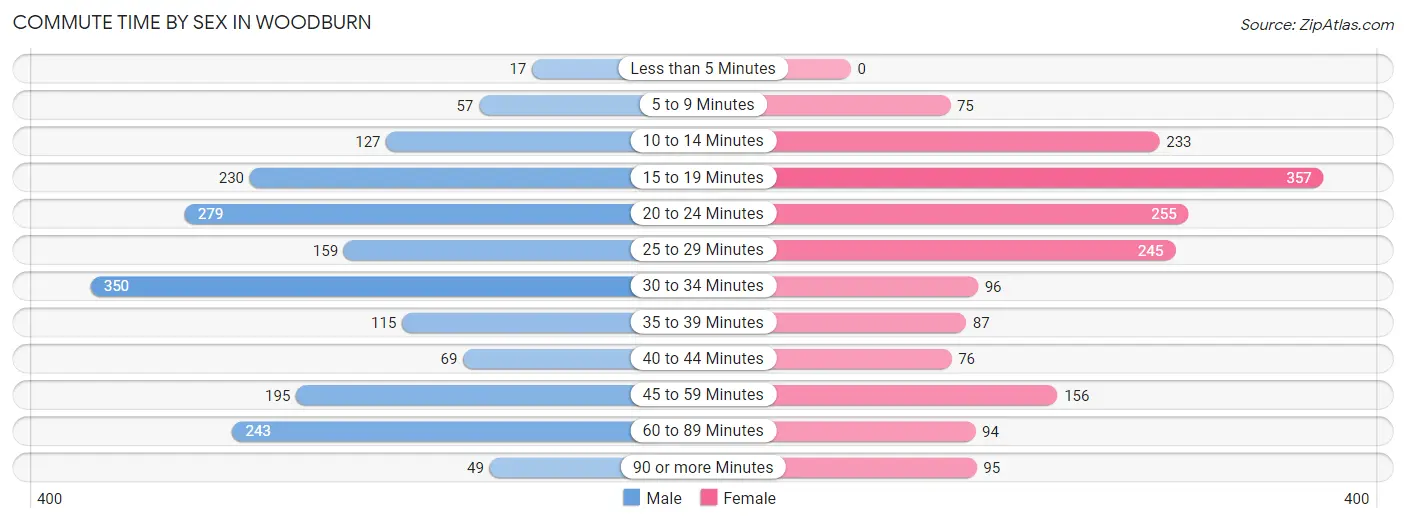
| Commute Time | Male | Female |
| Less than 5 Minutes | 17 (0.9%) | 0 (0.0%) |
| 5 to 9 Minutes | 57 (3.0%) | 75 (4.2%) |
| 10 to 14 Minutes | 127 (6.7%) | 233 (13.2%) |
| 15 to 19 Minutes | 230 (12.2%) | 357 (20.2%) |
| 20 to 24 Minutes | 279 (14.8%) | 255 (14.4%) |
| 25 to 29 Minutes | 159 (8.4%) | 245 (13.9%) |
| 30 to 34 Minutes | 350 (18.5%) | 96 (5.4%) |
| 35 to 39 Minutes | 115 (6.1%) | 87 (4.9%) |
| 40 to 44 Minutes | 69 (3.6%) | 76 (4.3%) |
| 45 to 59 Minutes | 195 (10.3%) | 156 (8.8%) |
| 60 to 89 Minutes | 243 (12.9%) | 94 (5.3%) |
| 90 or more Minutes | 49 (2.6%) | 95 (5.4%) |
Time of Departure to Work by Sex in Woodburn
The most frequent times of departure to work in Woodburn are 9:00 AM to 9:59 AM (291, 15.4%) for males and 8:00 AM to 8:29 AM (417, 23.6%) for females.
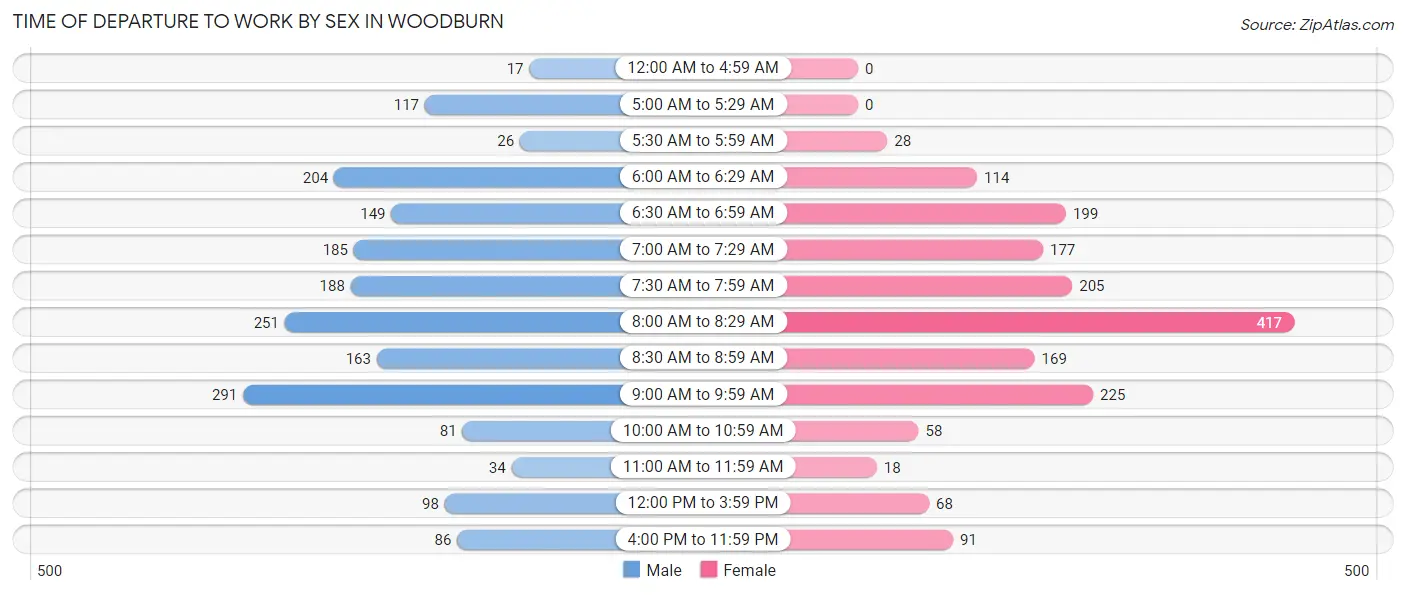
| Time of Departure | Male | Female |
| 12:00 AM to 4:59 AM | 17 (0.9%) | 0 (0.0%) |
| 5:00 AM to 5:29 AM | 117 (6.2%) | 0 (0.0%) |
| 5:30 AM to 5:59 AM | 26 (1.4%) | 28 (1.6%) |
| 6:00 AM to 6:29 AM | 204 (10.8%) | 114 (6.4%) |
| 6:30 AM to 6:59 AM | 149 (7.9%) | 199 (11.3%) |
| 7:00 AM to 7:29 AM | 185 (9.8%) | 177 (10.0%) |
| 7:30 AM to 7:59 AM | 188 (10.0%) | 205 (11.6%) |
| 8:00 AM to 8:29 AM | 251 (13.3%) | 417 (23.6%) |
| 8:30 AM to 8:59 AM | 163 (8.6%) | 169 (9.6%) |
| 9:00 AM to 9:59 AM | 291 (15.4%) | 225 (12.7%) |
| 10:00 AM to 10:59 AM | 81 (4.3%) | 58 (3.3%) |
| 11:00 AM to 11:59 AM | 34 (1.8%) | 18 (1.0%) |
| 12:00 PM to 3:59 PM | 98 (5.2%) | 68 (3.8%) |
| 4:00 PM to 11:59 PM | 86 (4.5%) | 91 (5.1%) |
| Total | 1,890 (100.0%) | 1,769 (100.0%) |
Housing Occupancy in Woodburn
Occupancy by Ownership in Woodburn
Of the total 3,174 dwellings in Woodburn, owner-occupied units account for 1,864 (58.7%), while renter-occupied units make up 1,310 (41.3%).
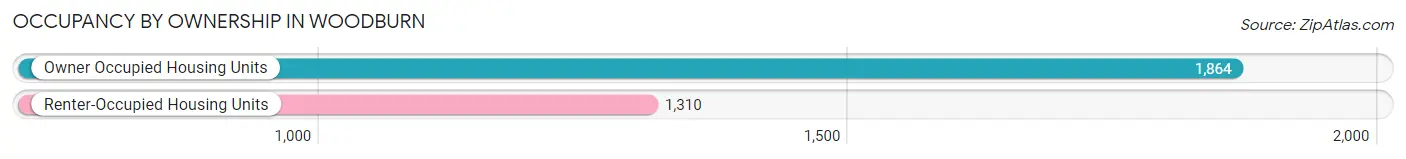
| Occupancy | # Housing Units | % Housing Units |
| Owner Occupied Housing Units | 1,864 | 58.7% |
| Renter-Occupied Housing Units | 1,310 | 41.3% |
| Total Occupied Housing Units | 3,174 | 100.0% |
Occupancy by Household Size in Woodburn
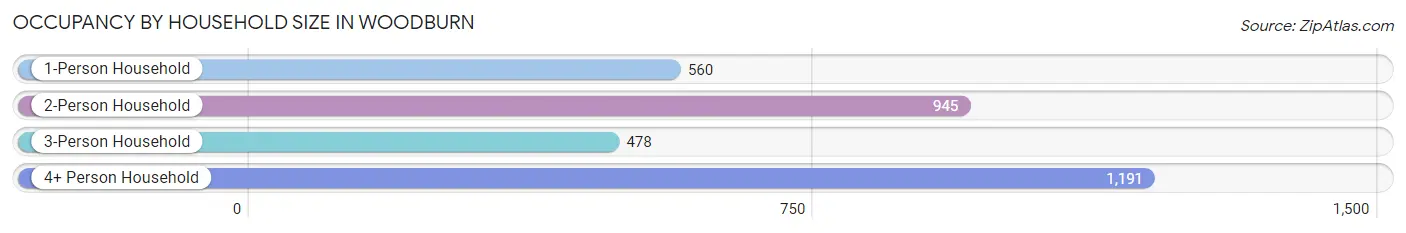
| Household Size | # Housing Units | % Housing Units |
| 1-Person Household | 560 | 17.6% |
| 2-Person Household | 945 | 29.8% |
| 3-Person Household | 478 | 15.1% |
| 4+ Person Household | 1,191 | 37.5% |
| Total Housing Units | 3,174 | 100.0% |
Occupancy by Ownership by Household Size in Woodburn
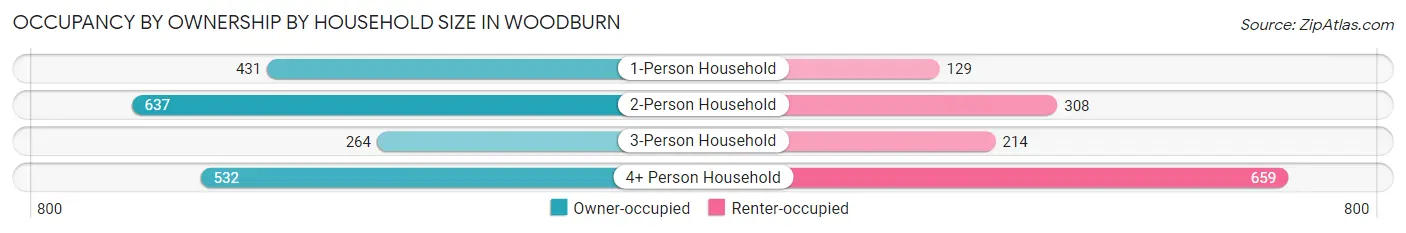
| Household Size | Owner-occupied | Renter-occupied |
| 1-Person Household | 431 (77.0%) | 129 (23.0%) |
| 2-Person Household | 637 (67.4%) | 308 (32.6%) |
| 3-Person Household | 264 (55.2%) | 214 (44.8%) |
| 4+ Person Household | 532 (44.7%) | 659 (55.3%) |
| Total Housing Units | 1,864 (58.7%) | 1,310 (41.3%) |
Occupancy by Educational Attainment in Woodburn
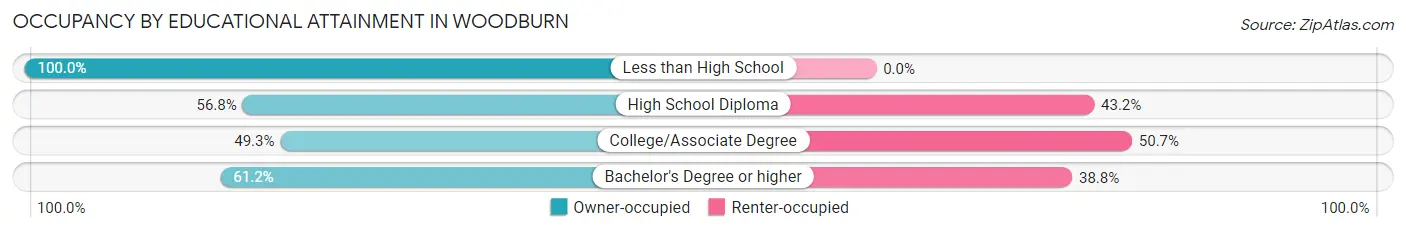
| Household Size | Owner-occupied | Renter-occupied |
| Less than High School | 50 (100.0%) | 0 (0.0%) |
| High School Diploma | 138 (56.8%) | 105 (43.2%) |
| College/Associate Degree | 359 (49.3%) | 369 (50.7%) |
| Bachelor's Degree or higher | 1,317 (61.2%) | 836 (38.8%) |
Occupancy by Age of Householder in Woodburn
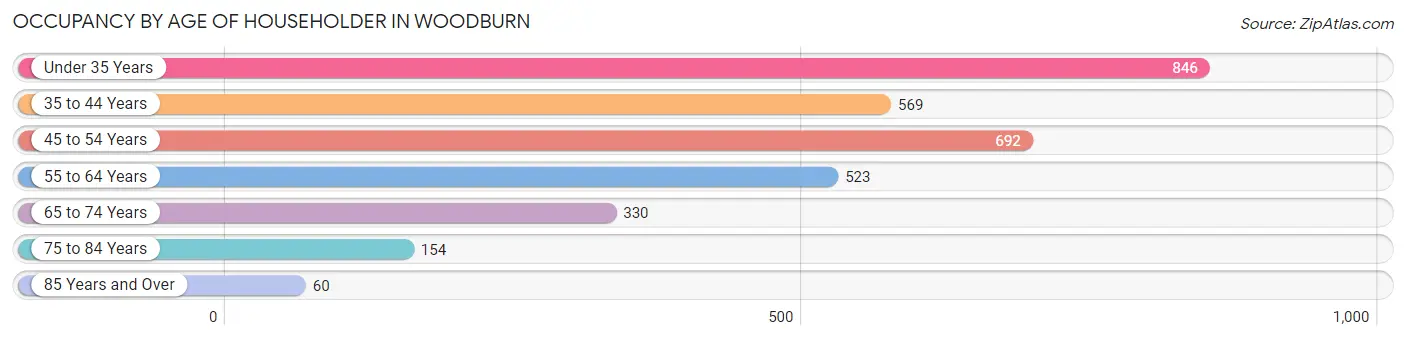
| Age Bracket | # Households | % Households |
| Under 35 Years | 846 | 26.7% |
| 35 to 44 Years | 569 | 17.9% |
| 45 to 54 Years | 692 | 21.8% |
| 55 to 64 Years | 523 | 16.5% |
| 65 to 74 Years | 330 | 10.4% |
| 75 to 84 Years | 154 | 4.9% |
| 85 Years and Over | 60 | 1.9% |
| Total | 3,174 | 100.0% |
Housing Finances in Woodburn
Median Income by Occupancy in Woodburn
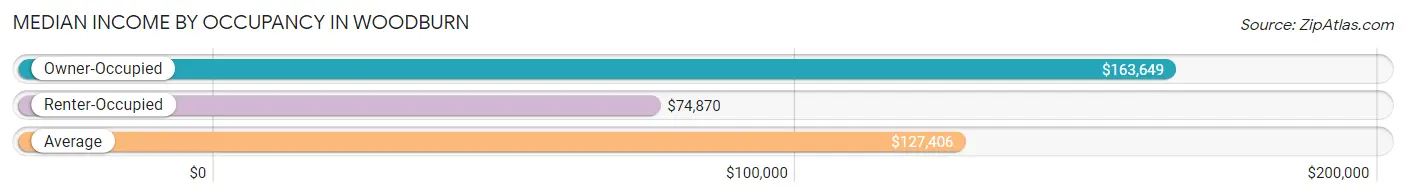
| Occupancy Type | # Households | Median Income |
| Owner-Occupied | 1,864 (58.7%) | $163,649 |
| Renter-Occupied | 1,310 (41.3%) | $74,870 |
| Average | 3,174 (100.0%) | $127,406 |
Occupancy by Householder Income Bracket in Woodburn
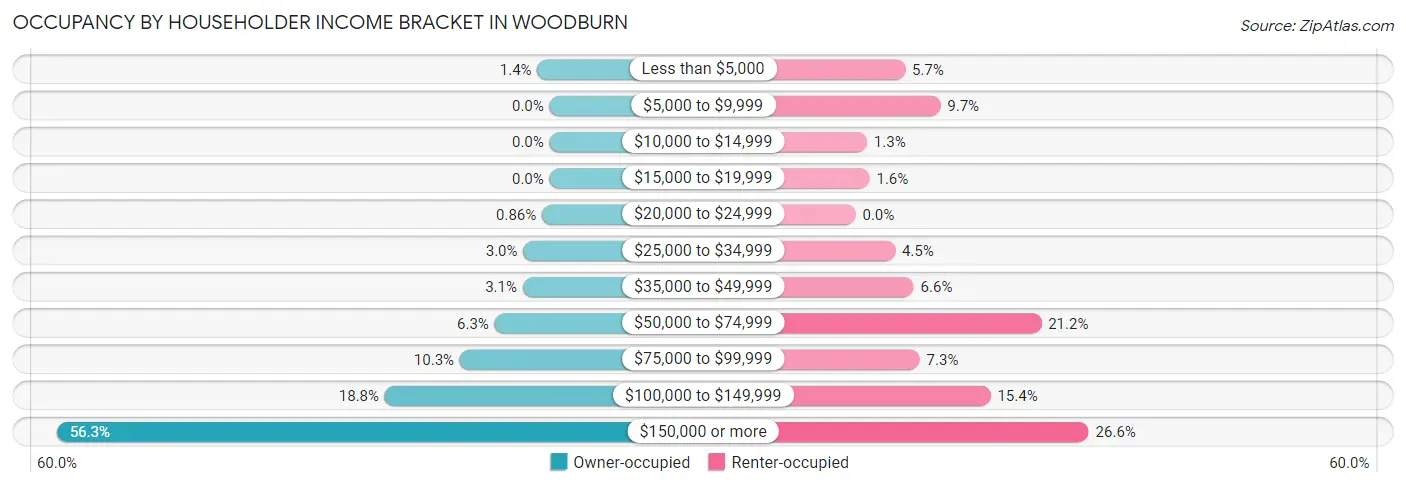
| Income Bracket | Owner-occupied | Renter-occupied |
| Less than $5,000 | 26 (1.4%) | 74 (5.7%) |
| $5,000 to $9,999 | 0 (0.0%) | 127 (9.7%) |
| $10,000 to $14,999 | 0 (0.0%) | 17 (1.3%) |
| $15,000 to $19,999 | 0 (0.0%) | 21 (1.6%) |
| $20,000 to $24,999 | 16 (0.9%) | 0 (0.0%) |
| $25,000 to $34,999 | 56 (3.0%) | 59 (4.5%) |
| $35,000 to $49,999 | 57 (3.1%) | 87 (6.6%) |
| $50,000 to $74,999 | 117 (6.3%) | 278 (21.2%) |
| $75,000 to $99,999 | 191 (10.2%) | 96 (7.3%) |
| $100,000 to $149,999 | 351 (18.8%) | 202 (15.4%) |
| $150,000 or more | 1,050 (56.3%) | 349 (26.6%) |
| Total | 1,864 (100.0%) | 1,310 (100.0%) |
Monthly Housing Cost Tiers in Woodburn
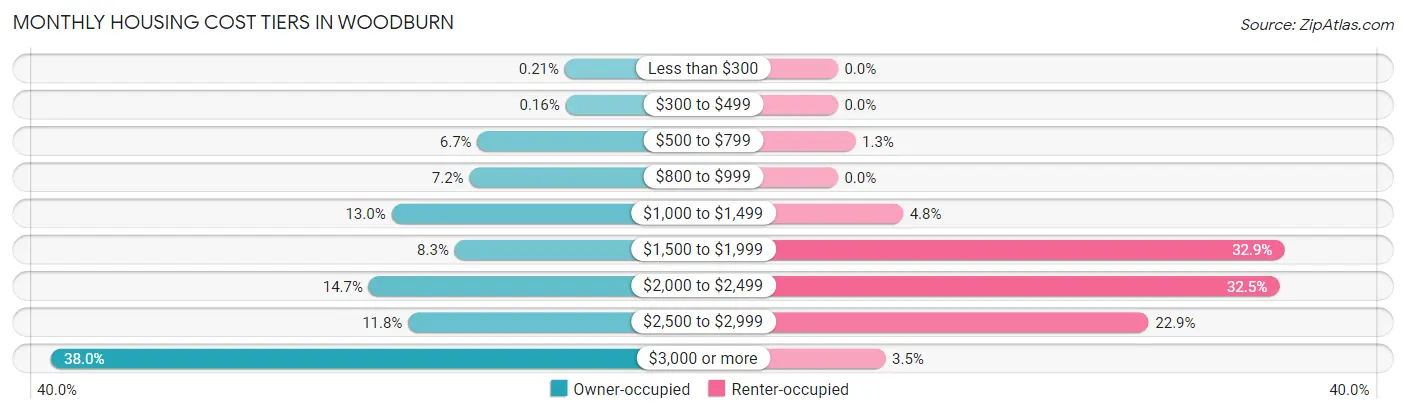
| Monthly Cost | Owner-occupied | Renter-occupied |
| Less than $300 | 4 (0.2%) | 0 (0.0%) |
| $300 to $499 | 3 (0.2%) | 0 (0.0%) |
| $500 to $799 | 124 (6.7%) | 17 (1.3%) |
| $800 to $999 | 135 (7.2%) | 0 (0.0%) |
| $1,000 to $1,499 | 242 (13.0%) | 63 (4.8%) |
| $1,500 to $1,999 | 155 (8.3%) | 431 (32.9%) |
| $2,000 to $2,499 | 273 (14.6%) | 426 (32.5%) |
| $2,500 to $2,999 | 219 (11.7%) | 300 (22.9%) |
| $3,000 or more | 709 (38.0%) | 46 (3.5%) |
| Total | 1,864 (100.0%) | 1,310 (100.0%) |
Physical Housing Characteristics in Woodburn
Housing Structures in Woodburn
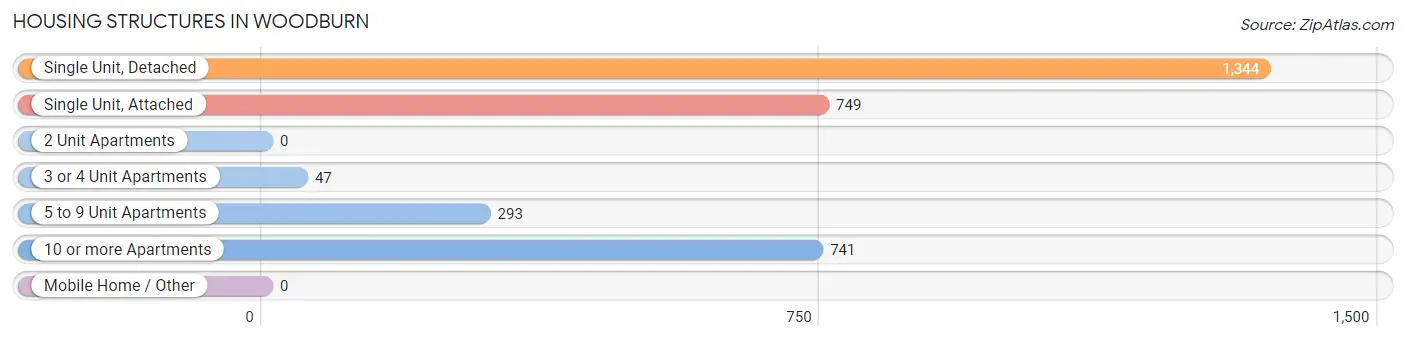
| Structure Type | # Housing Units | % Housing Units |
| Single Unit, Detached | 1,344 | 42.3% |
| Single Unit, Attached | 749 | 23.6% |
| 2 Unit Apartments | 0 | 0.0% |
| 3 or 4 Unit Apartments | 47 | 1.5% |
| 5 to 9 Unit Apartments | 293 | 9.2% |
| 10 or more Apartments | 741 | 23.4% |
| Mobile Home / Other | 0 | 0.0% |
| Total | 3,174 | 100.0% |
Housing Structures by Occupancy in Woodburn
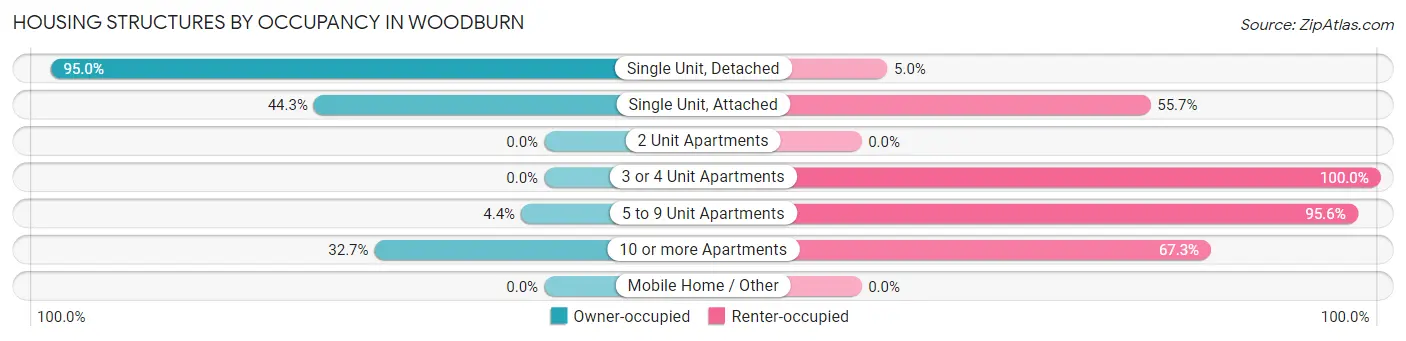
| Structure Type | Owner-occupied | Renter-occupied |
| Single Unit, Detached | 1,277 (95.0%) | 67 (5.0%) |
| Single Unit, Attached | 332 (44.3%) | 417 (55.7%) |
| 2 Unit Apartments | 0 (0.0%) | 0 (0.0%) |
| 3 or 4 Unit Apartments | 0 (0.0%) | 47 (100.0%) |
| 5 to 9 Unit Apartments | 13 (4.4%) | 280 (95.6%) |
| 10 or more Apartments | 242 (32.7%) | 499 (67.3%) |
| Mobile Home / Other | 0 (0.0%) | 0 (0.0%) |
| Total | 1,864 (58.7%) | 1,310 (41.3%) |
Housing Structures by Number of Rooms in Woodburn
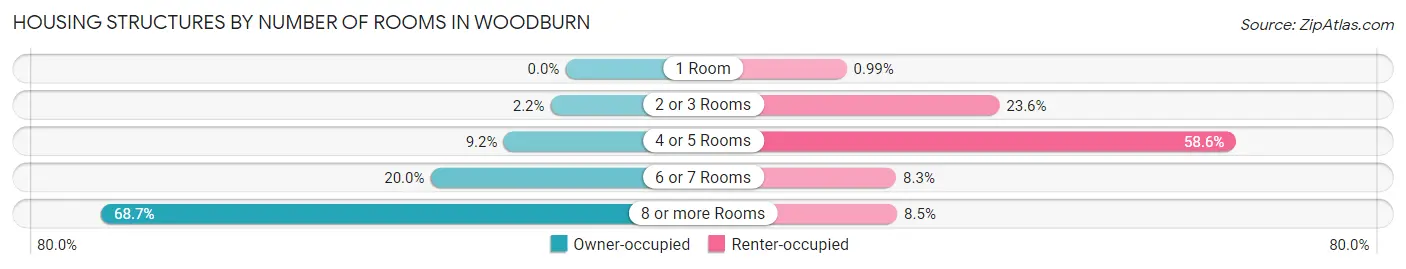
| Number of Rooms | Owner-occupied | Renter-occupied |
| 1 Room | 0 (0.0%) | 13 (1.0%) |
| 2 or 3 Rooms | 41 (2.2%) | 309 (23.6%) |
| 4 or 5 Rooms | 171 (9.2%) | 768 (58.6%) |
| 6 or 7 Rooms | 372 (20.0%) | 109 (8.3%) |
| 8 or more Rooms | 1,280 (68.7%) | 111 (8.5%) |
| Total | 1,864 (100.0%) | 1,310 (100.0%) |
Housing Structure by Heating Type in Woodburn
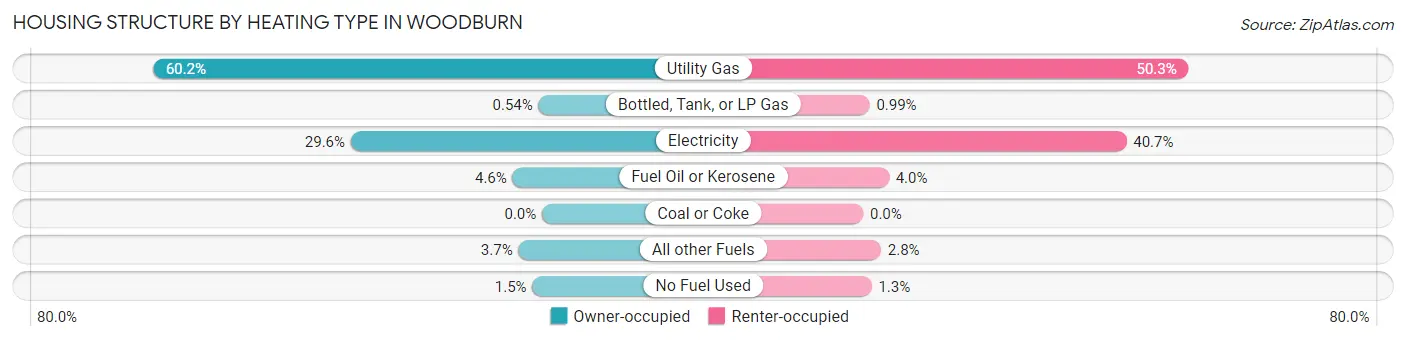
| Heating Type | Owner-occupied | Renter-occupied |
| Utility Gas | 1,122 (60.2%) | 659 (50.3%) |
| Bottled, Tank, or LP Gas | 10 (0.5%) | 13 (1.0%) |
| Electricity | 551 (29.6%) | 533 (40.7%) |
| Fuel Oil or Kerosene | 85 (4.6%) | 52 (4.0%) |
| Coal or Coke | 0 (0.0%) | 0 (0.0%) |
| All other Fuels | 68 (3.6%) | 36 (2.8%) |
| No Fuel Used | 28 (1.5%) | 17 (1.3%) |
| Total | 1,864 (100.0%) | 1,310 (100.0%) |
Household Vehicle Usage in Woodburn
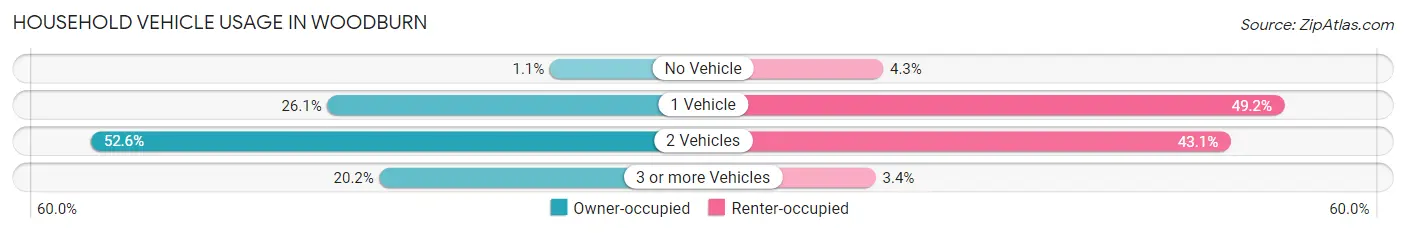
| Vehicles per Household | Owner-occupied | Renter-occupied |
| No Vehicle | 21 (1.1%) | 56 (4.3%) |
| 1 Vehicle | 486 (26.1%) | 644 (49.2%) |
| 2 Vehicles | 980 (52.6%) | 565 (43.1%) |
| 3 or more Vehicles | 377 (20.2%) | 45 (3.4%) |
| Total | 1,864 (100.0%) | 1,310 (100.0%) |
Real Estate & Mortgages in Woodburn
Real Estate and Mortgage Overview in Woodburn
| Characteristic | Without Mortgage | With Mortgage |
| Housing Units | 551 | 1,313 |
| Median Property Value | $718,100 | $792,300 |
| Median Household Income | $127,426 | $843 |
| Monthly Housing Costs | $1,014 | $695 |
| Real Estate Taxes | $7,272 | $3 |
Property Value by Mortgage Status in Woodburn
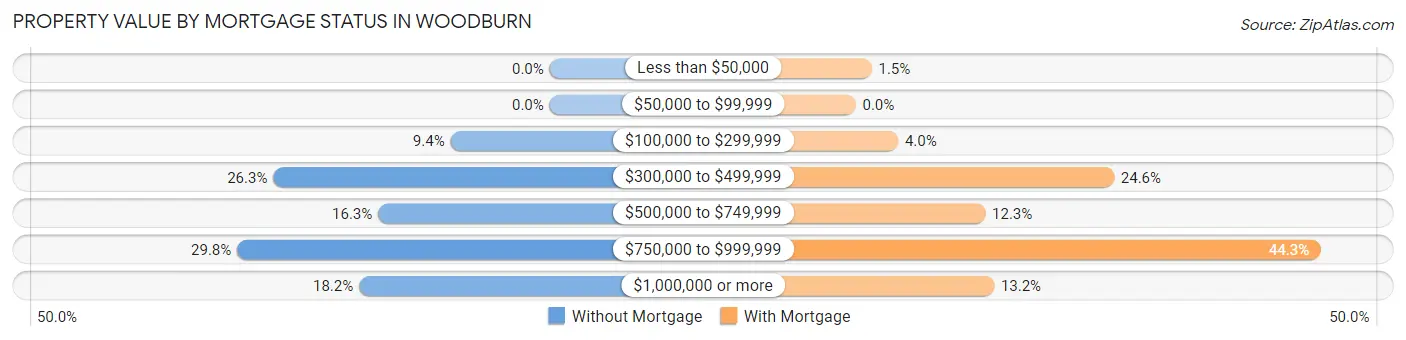
| Property Value | Without Mortgage | With Mortgage |
| Less than $50,000 | 0 (0.0%) | 20 (1.5%) |
| $50,000 to $99,999 | 0 (0.0%) | 0 (0.0%) |
| $100,000 to $299,999 | 52 (9.4%) | 53 (4.0%) |
| $300,000 to $499,999 | 145 (26.3%) | 323 (24.6%) |
| $500,000 to $749,999 | 90 (16.3%) | 162 (12.3%) |
| $750,000 to $999,999 | 164 (29.8%) | 582 (44.3%) |
| $1,000,000 or more | 100 (18.1%) | 173 (13.2%) |
| Total | 551 (100.0%) | 1,313 (100.0%) |
Household Income by Mortgage Status in Woodburn
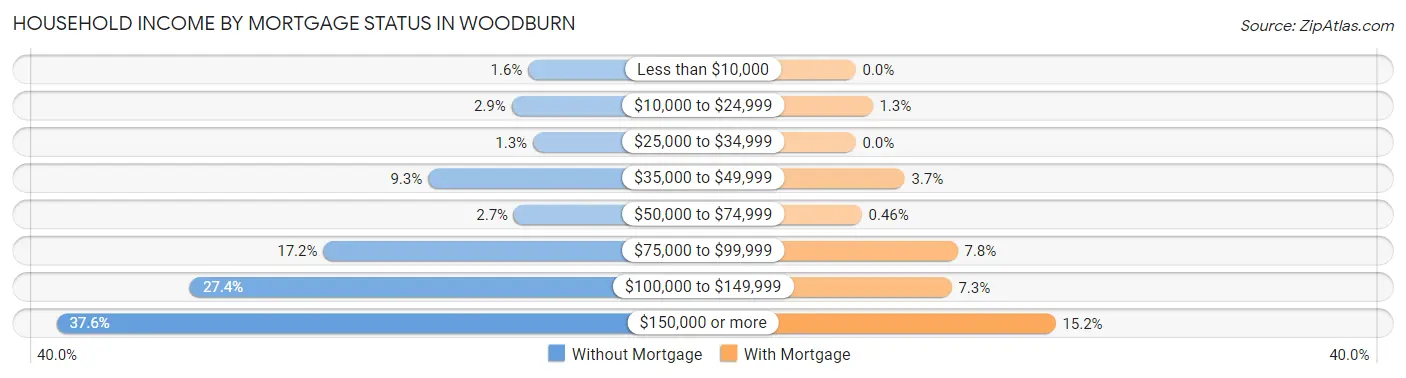
| Household Income | Without Mortgage | With Mortgage |
| Less than $10,000 | 9 (1.6%) | 0 (0.0%) |
| $10,000 to $24,999 | 16 (2.9%) | 17 (1.3%) |
| $25,000 to $34,999 | 7 (1.3%) | 0 (0.0%) |
| $35,000 to $49,999 | 51 (9.3%) | 49 (3.7%) |
| $50,000 to $74,999 | 15 (2.7%) | 6 (0.5%) |
| $75,000 to $99,999 | 95 (17.2%) | 102 (7.8%) |
| $100,000 to $149,999 | 151 (27.4%) | 96 (7.3%) |
| $150,000 or more | 207 (37.6%) | 200 (15.2%) |
| Total | 551 (100.0%) | 1,313 (100.0%) |
Property Value to Household Income Ratio in Woodburn
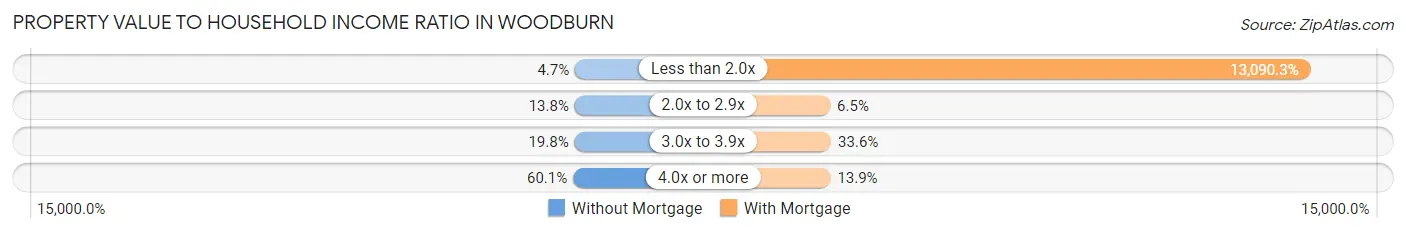
| Value-to-Income Ratio | Without Mortgage | With Mortgage |
| Less than 2.0x | 26 (4.7%) | 171,875 (13,090.3%) |
| 2.0x to 2.9x | 76 (13.8%) | 85 (6.5%) |
| 3.0x to 3.9x | 109 (19.8%) | 441 (33.6%) |
| 4.0x or more | 331 (60.1%) | 183 (13.9%) |
| Total | 551 (100.0%) | 1,313 (100.0%) |
Real Estate Taxes by Mortgage Status in Woodburn
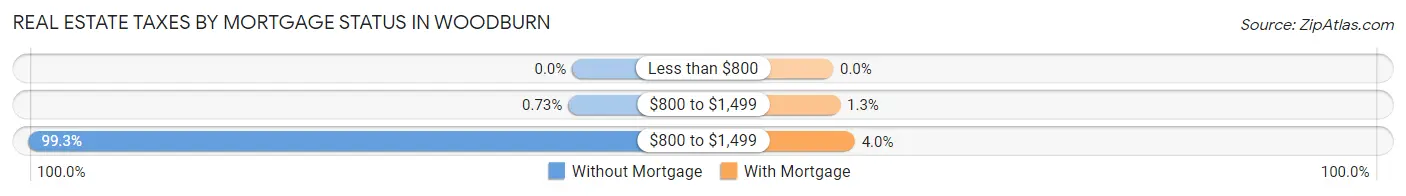
| Property Taxes | Without Mortgage | With Mortgage |
| Less than $800 | 0 (0.0%) | 0 (0.0%) |
| $800 to $1,499 | 4 (0.7%) | 17 (1.3%) |
| $800 to $1,499 | 547 (99.3%) | 52 (4.0%) |
| Total | 551 (100.0%) | 1,313 (100.0%) |
Health & Disability in Woodburn
Health Insurance Coverage by Age in Woodburn
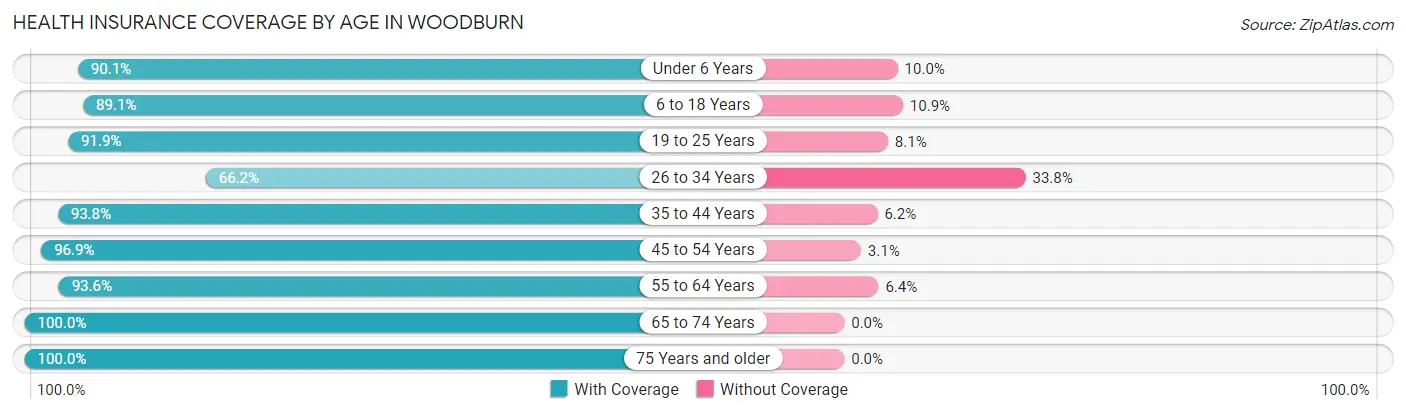
| Age Bracket | With Coverage | Without Coverage |
| Under 6 Years | 706 (90.0%) | 78 (10.0%) |
| 6 to 18 Years | 1,956 (89.1%) | 240 (10.9%) |
| 19 to 25 Years | 520 (91.9%) | 46 (8.1%) |
| 26 to 34 Years | 1,179 (66.2%) | 602 (33.8%) |
| 35 to 44 Years | 1,091 (93.8%) | 72 (6.2%) |
| 45 to 54 Years | 1,124 (96.9%) | 36 (3.1%) |
| 55 to 64 Years | 882 (93.6%) | 60 (6.4%) |
| 65 to 74 Years | 700 (100.0%) | 0 (0.0%) |
| 75 Years and older | 381 (100.0%) | 0 (0.0%) |
| Total | 8,539 (88.3%) | 1,134 (11.7%) |
Health Insurance Coverage by Citizenship Status in Woodburn
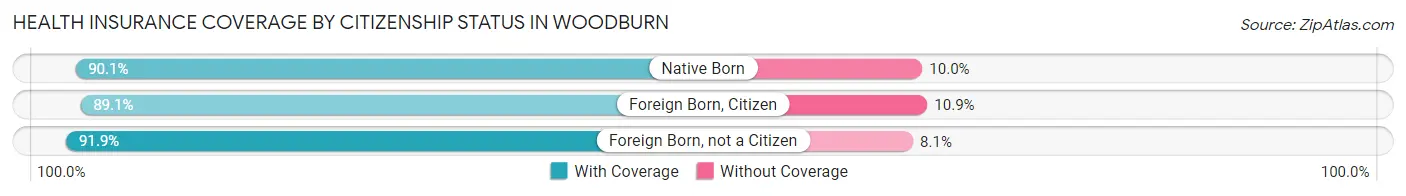
| Citizenship Status | With Coverage | Without Coverage |
| Native Born | 706 (90.0%) | 78 (10.0%) |
| Foreign Born, Citizen | 1,956 (89.1%) | 240 (10.9%) |
| Foreign Born, not a Citizen | 520 (91.9%) | 46 (8.1%) |
Health Insurance Coverage by Household Income in Woodburn
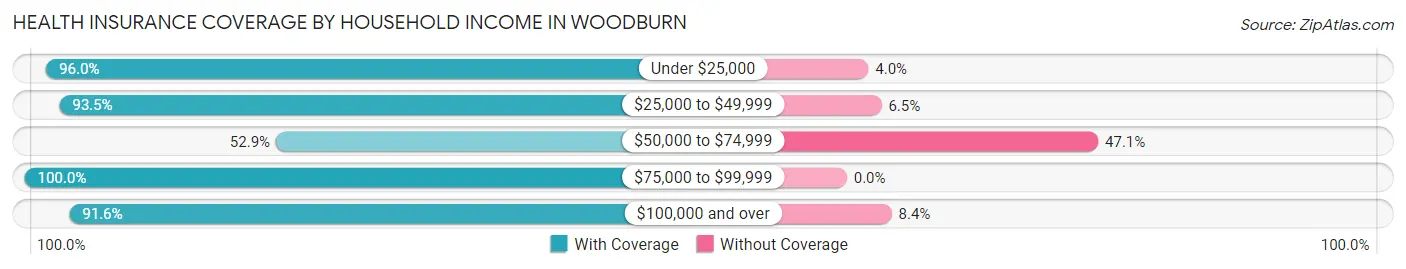
| Household Income | With Coverage | Without Coverage |
| Under $25,000 | 1,115 (96.0%) | 47 (4.0%) |
| $25,000 to $49,999 | 532 (93.5%) | 37 (6.5%) |
| $50,000 to $74,999 | 580 (52.9%) | 516 (47.1%) |
| $75,000 to $99,999 | 715 (100.0%) | 0 (0.0%) |
| $100,000 and over | 5,550 (91.6%) | 508 (8.4%) |
Public vs Private Health Insurance Coverage by Age in Woodburn
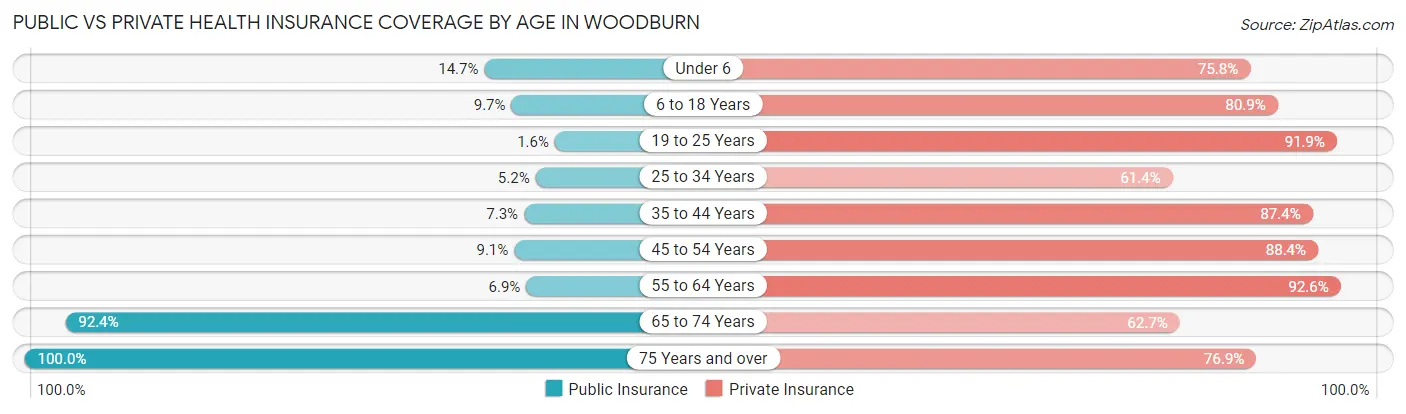
| Age Bracket | Public Insurance | Private Insurance |
| Under 6 | 115 (14.7%) | 594 (75.8%) |
| 6 to 18 Years | 212 (9.7%) | 1,776 (80.9%) |
| 19 to 25 Years | 9 (1.6%) | 520 (91.9%) |
| 25 to 34 Years | 92 (5.2%) | 1,093 (61.4%) |
| 35 to 44 Years | 85 (7.3%) | 1,016 (87.4%) |
| 45 to 54 Years | 106 (9.1%) | 1,025 (88.4%) |
| 55 to 64 Years | 65 (6.9%) | 872 (92.6%) |
| 65 to 74 Years | 647 (92.4%) | 439 (62.7%) |
| 75 Years and over | 381 (100.0%) | 293 (76.9%) |
| Total | 1,712 (17.7%) | 7,628 (78.9%) |
Disability Status by Sex by Age in Woodburn
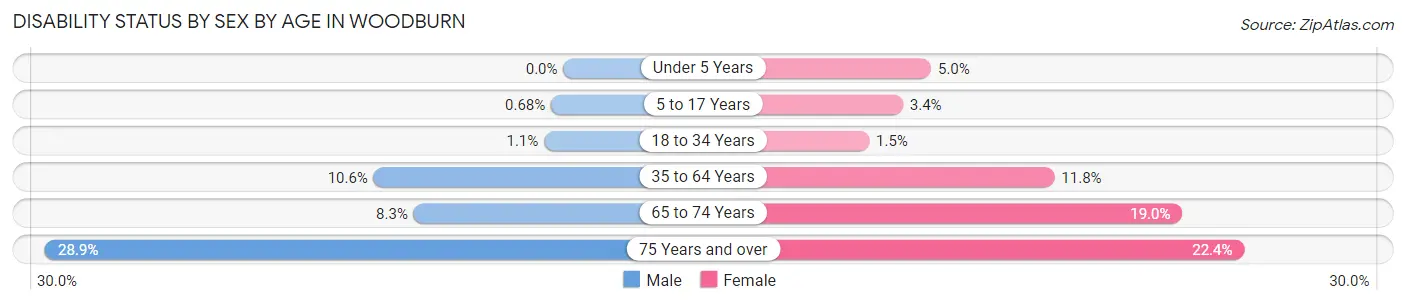
| Age Bracket | Male | Female |
| Under 5 Years | 0 (0.0%) | 8 (5.0%) |
| 5 to 17 Years | 9 (0.7%) | 31 (3.4%) |
| 18 to 34 Years | 13 (1.1%) | 19 (1.5%) |
| 35 to 64 Years | 170 (10.6%) | 196 (11.8%) |
| 65 to 74 Years | 28 (8.3%) | 69 (19.0%) |
| 75 Years and over | 43 (28.9%) | 52 (22.4%) |
Disability Class by Sex by Age in Woodburn
Disability Class: Hearing Difficulty
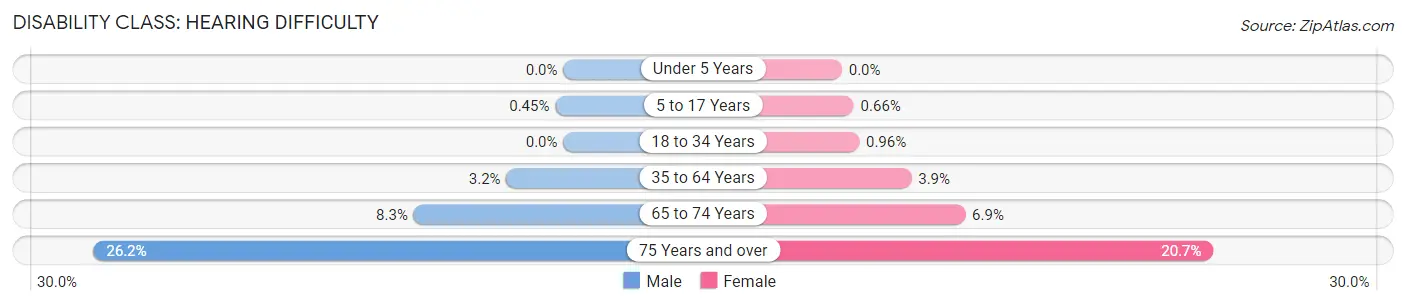
| Age Bracket | Male | Female |
| Under 5 Years | 0 (0.0%) | 0 (0.0%) |
| 5 to 17 Years | 6 (0.4%) | 6 (0.7%) |
| 18 to 34 Years | 0 (0.0%) | 12 (1.0%) |
| 35 to 64 Years | 51 (3.2%) | 64 (3.9%) |
| 65 to 74 Years | 28 (8.3%) | 25 (6.9%) |
| 75 Years and over | 39 (26.2%) | 48 (20.7%) |
Disability Class: Vision Difficulty
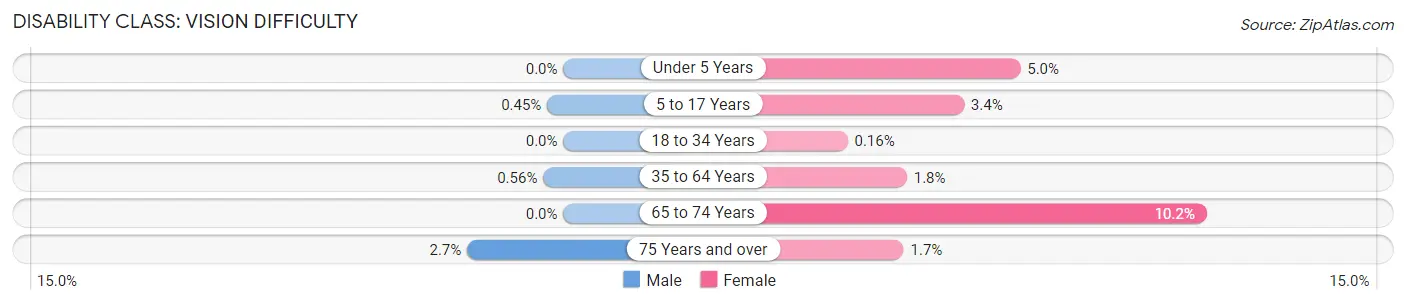
| Age Bracket | Male | Female |
| Under 5 Years | 0 (0.0%) | 8 (5.0%) |
| 5 to 17 Years | 6 (0.4%) | 31 (3.4%) |
| 18 to 34 Years | 0 (0.0%) | 2 (0.2%) |
| 35 to 64 Years | 9 (0.6%) | 30 (1.8%) |
| 65 to 74 Years | 0 (0.0%) | 37 (10.2%) |
| 75 Years and over | 4 (2.7%) | 4 (1.7%) |
Disability Class: Cognitive Difficulty
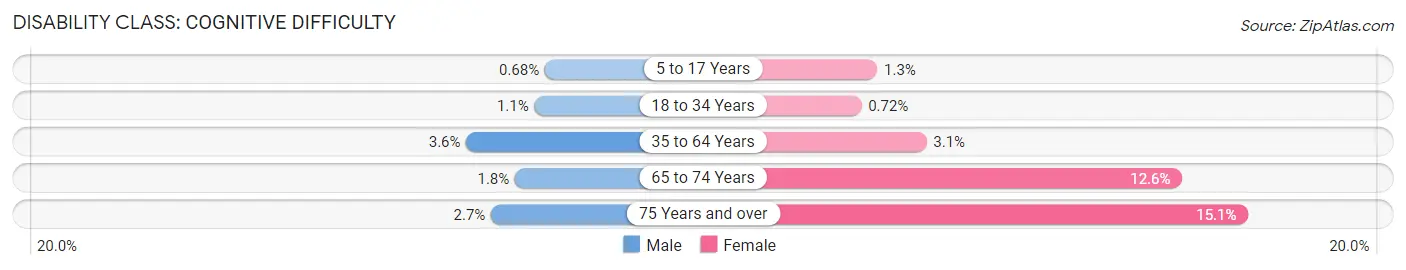
| Age Bracket | Male | Female |
| 5 to 17 Years | 9 (0.7%) | 12 (1.3%) |
| 18 to 34 Years | 13 (1.1%) | 9 (0.7%) |
| 35 to 64 Years | 58 (3.6%) | 52 (3.1%) |
| 65 to 74 Years | 6 (1.8%) | 46 (12.6%) |
| 75 Years and over | 4 (2.7%) | 35 (15.1%) |
Disability Class: Ambulatory Difficulty
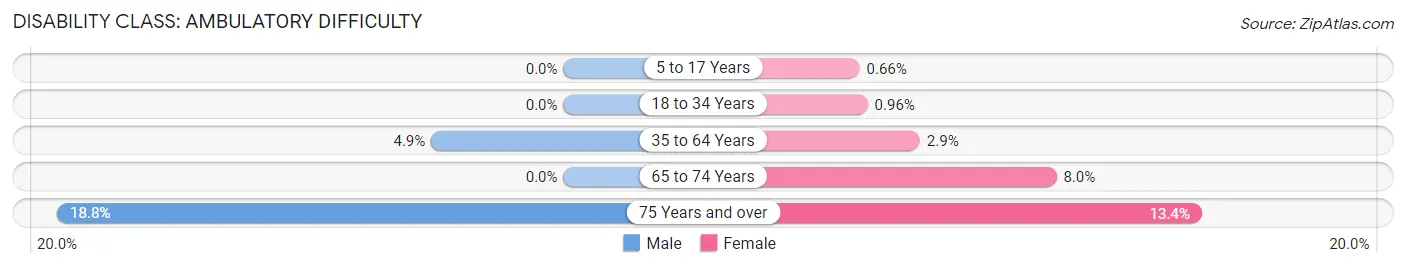
| Age Bracket | Male | Female |
| 5 to 17 Years | 0 (0.0%) | 6 (0.7%) |
| 18 to 34 Years | 0 (0.0%) | 12 (1.0%) |
| 35 to 64 Years | 79 (4.9%) | 48 (2.9%) |
| 65 to 74 Years | 0 (0.0%) | 29 (8.0%) |
| 75 Years and over | 28 (18.8%) | 31 (13.4%) |
Disability Class: Self-Care Difficulty
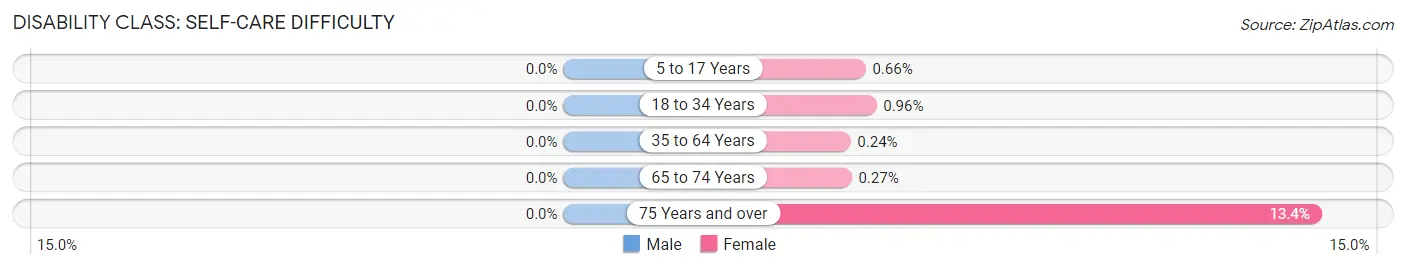
| Age Bracket | Male | Female |
| 5 to 17 Years | 0 (0.0%) | 6 (0.7%) |
| 18 to 34 Years | 0 (0.0%) | 12 (1.0%) |
| 35 to 64 Years | 0 (0.0%) | 4 (0.2%) |
| 65 to 74 Years | 0 (0.0%) | 1 (0.3%) |
| 75 Years and over | 0 (0.0%) | 31 (13.4%) |
Technology Access in Woodburn
Computing Device Access in Woodburn
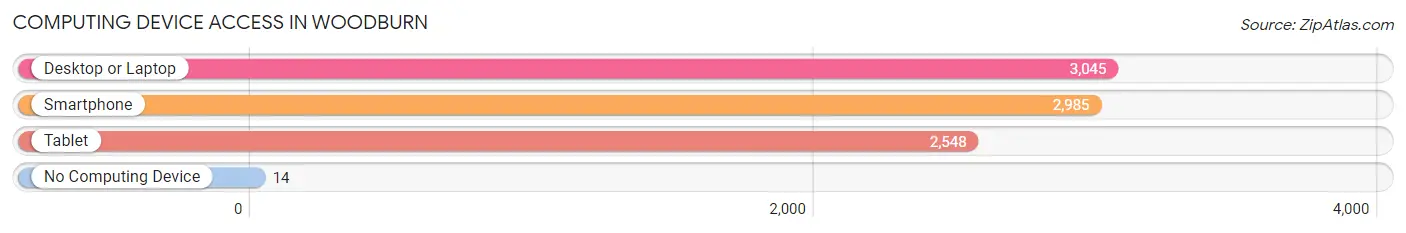
| Device Type | # Households | % Households |
| Desktop or Laptop | 3,045 | 95.9% |
| Smartphone | 2,985 | 94.1% |
| Tablet | 2,548 | 80.3% |
| No Computing Device | 14 | 0.4% |
| Total | 3,174 | 100.0% |
Internet Access in Woodburn
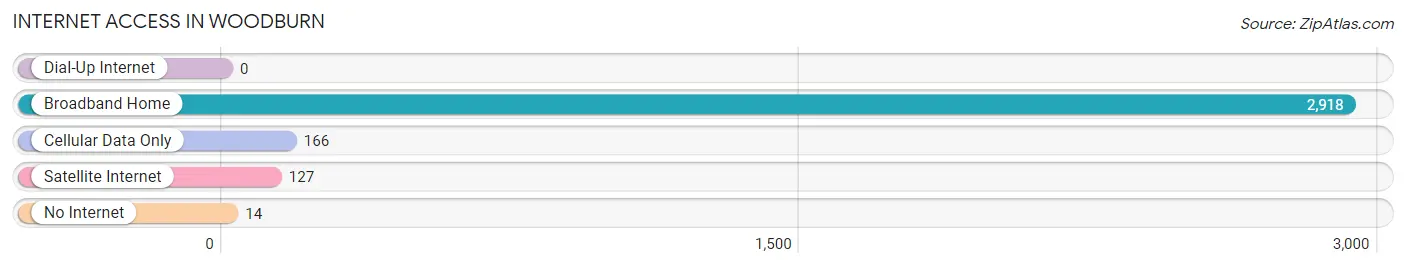
| Internet Type | # Households | % Households |
| Dial-Up Internet | 0 | 0.0% |
| Broadband Home | 2,918 | 91.9% |
| Cellular Data Only | 166 | 5.2% |
| Satellite Internet | 127 | 4.0% |
| No Internet | 14 | 0.4% |
| Total | 3,174 | 100.0% |
Woodburn Summary
Woodburn is a small unincorporated community located in the northern part of Fairfax County, Virginia. It is situated on the banks of the Potomac River, just south of the town of Occoquan. The community is home to a variety of businesses, including a post office, a gas station, a convenience store, and a few restaurants.
History
Woodburn was first settled in the late 1700s by a group of Quakers from Pennsylvania. The community was originally known as “Woodburn’s Corner” and was located near the intersection of what is now Route 123 and Route 1. The Quakers built a meeting house and a school, and the community grew steadily over the years.
In the early 1900s, the community was home to a number of small businesses, including a general store, a blacksmith shop, and a grist mill. The community also had a post office, which was established in 1891.
In the 1950s, the community began to decline as the population shifted to the suburbs of Washington, D.C. The post office closed in the 1970s, and the general store and other businesses followed suit.
Geography
Woodburn is located in the northern part of Fairfax County, Virginia. It is situated on the banks of the Potomac River, just south of the town of Occoquan. The community is bordered by the towns of Lorton and Fairfax Station to the north, and by the towns of Clifton and Centreville to the south.
The community is located in a rural area, with rolling hills and wooded areas. The terrain is mostly flat, with some areas of higher elevation. The climate is temperate, with hot summers and cold winters.
Economy
Woodburn is a small, rural community with a limited economy. The primary industry is agriculture, with some small businesses located in the area. The community is home to a post office, a gas station, a convenience store, and a few restaurants.
The community is also home to a number of small farms, which produce a variety of crops, including corn, soybeans, and hay. The farms also raise livestock, including cows, pigs, and chickens.
Demographics
As of the 2010 census, the population of Woodburn was 1,845. The racial makeup of the community was 94.3% White, 2.2% African American, 0.3% Native American, 0.7% Asian, 0.1% Pacific Islander, and 2.4% from other races. The median household income was $76,250, and the median family income was $87,500.
Conclusion
Woodburn is a small, rural community located in the northern part of Fairfax County, Virginia. It is situated on the banks of the Potomac River, just south of the town of Occoquan. The community is home to a variety of businesses, including a post office, a gas station, a convenience store, and a few restaurants. The primary industry is agriculture, with some small businesses located in the area. As of the 2010 census, the population of Woodburn was 1,845. The racial makeup of the community was 94.3% White, 2.2% African American, 0.3% Native American, 0.7% Asian, 0.1% Pacific Islander, and 2.4% from other races. The median household income was $76,250, and the median family income was $87,500. Woodburn is a small, rural community with a limited economy, but it is a great place to live and work.
Common Questions
What is Per Capita Income in Woodburn?
Per Capita income in Woodburn is $50,915.
What is the Median Family Income in Woodburn?
Median Family Income in Woodburn is $153,224.
What is the Median Household income in Woodburn?
Median Household Income in Woodburn is $127,406.
What is Income or Wage Gap in Woodburn?
Income or Wage Gap in Woodburn is 15.1%.
Women in Woodburn earn 84.9 cents for every dollar earned by a man.
What is Inequality or Gini Index in Woodburn?
Inequality or Gini Index in Woodburn is 0.42.
What is the Total Population of Woodburn?
Total Population of Woodburn is 9,960.
What is the Total Male Population of Woodburn?
Total Male Population of Woodburn is 5,299.
What is the Total Female Population of Woodburn?
Total Female Population of Woodburn is 4,661.
What is the Ratio of Males per 100 Females in Woodburn?
There are 113.69 Males per 100 Females in Woodburn.
What is the Ratio of Females per 100 Males in Woodburn?
There are 87.96 Females per 100 Males in Woodburn.
What is the Median Population Age in Woodburn?
Median Population Age in Woodburn is 32.6 Years.
What is the Average Family Size in Woodburn
Average Family Size in Woodburn is 3.6 People.
What is the Average Household Size in Woodburn
Average Household Size in Woodburn is 3.1 People.
How Large is the Labor Force in Woodburn?
There are 5,076 People in the Labor Forcein in Woodburn.
What is the Percentage of People in the Labor Force in Woodburn?
69.4% of People are in the Labor Force in Woodburn.
What is the Unemployment Rate in Woodburn?
Unemployment Rate in Woodburn is 3.0%.